1/ it’s been five days since I last posted an updated review of Oregon-specific #COVID19 data. There have been some big announcements in the interval about how Oregon continues to #FlattenTheCurve, so I will include that info along with updated versions of the models. https://twitter.com/aoglasser/status/1247561198783983616">https://twitter.com/aoglasser...
2/ yesterday’s update from @OHAOregon
https://twitter.com/ohaoregon/status/1249116081425395713?s=21">https://twitter.com/ohaoregon... https://twitter.com/ohaoregon/status/1249116081425395713">https://twitter.com/ohaoregon...
https://twitter.com/ohaoregon/status/1249116081425395713?s=21">https://twitter.com/ohaoregon... https://twitter.com/ohaoregon/status/1249116081425395713">https://twitter.com/ohaoregon...
3/ starting last week @OHAOregon also started releasing info via this profile tool. This graft shows positive cases (x axis is date of symptom onset)
Can we say we’ve peaked? Maybe not—I’ve seen more of a discussion about how we are in the plateau
https://public.tableau.com/profile/oregon.health.authority.covid.19#!/vizhome/OregonHealthAuthorityCOVID-19DataDashboard/COVID-19EPIConfirmed?:display_count=y&:toolbar=n&:origin=viz_share_link&:showShareOptions=false">https://public.tableau.com/profile/o...
4/ also from the @OHAOregon profile
Number of Oregonians tested. There has been drop off in testing on the weekends, though I’m not sure why the numbers for last week look low (maybe there’s a reporting lag??)
Positive rate is currently 5%
https://public.tableau.com/profile/oregon.health.authority.covid.19#!/vizhome/OregonHealthAuthorityCOVID-19DataDashboard/COVID-19EPIConfirmed?:display_count=y&:toolbar=n&:origin=viz_share_link&:showShareOptions=false">https://public.tableau.com/profile/o...
5/ in the past week, @OHAOregon released a weekly report
This was published 4/7/2020, so I will keep an eye out for an update in the next few days
https://govsite-assets.s3.amazonaws.com/FWgP9MbXQSiVlxbh9eQc_COVID-19-Weekly%20Report-04-07-2020-FINAL.pdf">https://govsite-assets.s3.amazonaws.com/FWgP9MbXQ...
This was published 4/7/2020, so I will keep an eye out for an update in the next few days
https://govsite-assets.s3.amazonaws.com/FWgP9MbXQSiVlxbh9eQc_COVID-19-Weekly%20Report-04-07-2020-FINAL.pdf">https://govsite-assets.s3.amazonaws.com/FWgP9MbXQ...
6/ more granular information from @OHAOregon, including demographics, hospital bed utilization, and available hospital resources
County specific data is also available online
https://govstatus.egov.com/OR-OHA-COVID-19 ">https://govstatus.egov.com/OR-OHA-CO...
County specific data is also available online
https://govstatus.egov.com/OR-OHA-COVID-19 ">https://govstatus.egov.com/OR-OHA-CO...
7/ publically available information from my employer @OHSUNews @OHSUSOM: https://news.ohsu.edu/2020/04/09/preparing-for-the-novel-coronavirus-at-ohsu">https://news.ohsu.edu/2020/04/0...
8/ available information from other hospital systems about number of cases:
(From 2 days ago) https://www.oregonlive.com/coronavirus/2020/04/coronavirus-hospitalizations-at-146-in-oregon.html">https://www.oregonlive.com/coronavir...
(From 2 days ago) https://www.oregonlive.com/coronavirus/2020/04/coronavirus-hospitalizations-at-146-in-oregon.html">https://www.oregonlive.com/coronavir...
9/ who is being affected?
it appears those who are older, frailer, sicker patients
Nearly 50% of the deaths in Oregon are senior care home residents, plus (to be continued next slide) https://www.oregonlive.com/coronavirus/2020/04/25-oregon-senior-care-home-coronavirus-patients-dead-state-says.html">https://www.oregonlive.com/coronavir...
10/ looking back at the data from @OHAOregon, the majority of deaths are in older patients, and data is being recorded about underlying conditions along with other risk factors
11/ broader look at trends, from
http://91-divoc.com/pages/covid-visualization/
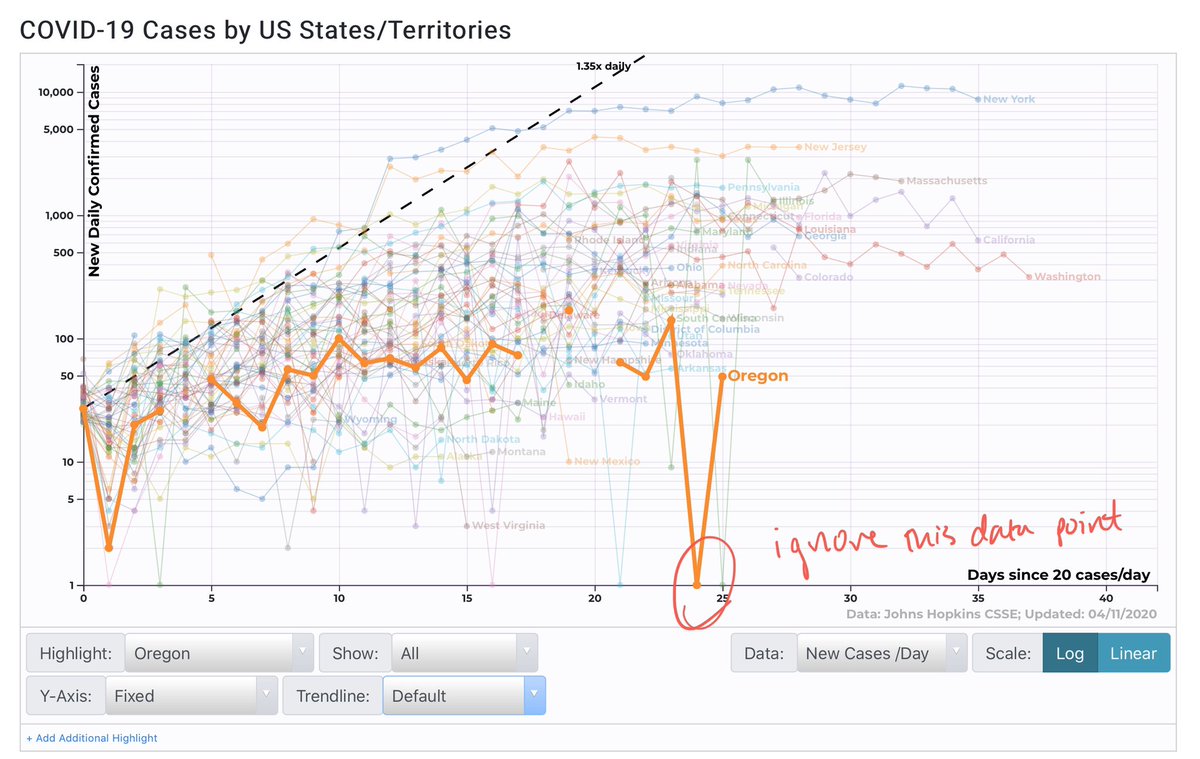
Oregon’s">https://91-divoc.com/pages/cov... trend line overall appears to be improving
New cases confirmed per day oscillate between ~50 to 70-80 (per OHA daily updates)
So, what does this mean??
http://91-divoc.com/pages/covid-visualization/
Oregon’s">https://91-divoc.com/pages/cov... trend line overall appears to be improving
New cases confirmed per day oscillate between ~50 to 70-80 (per OHA daily updates)
So, what does this mean??
12/ first, from the lay press
I used the term “plateau” versus peak earlier in this thread
Numbers are going to stay low AND HOPEFULLY MANAGEABLE!
But, it is going to take time to fight this https://www.oregonlive.com/coronavirus/2020/04/coronavirus-cases-plateau-in-oregon-drop-not-expected-for-six-weeks-new-estimates-show.html">https://www.oregonlive.com/coronavir...
13/ from that article—this is the very good news about strict #PhysicalDistancing to #FlattenTheCurve
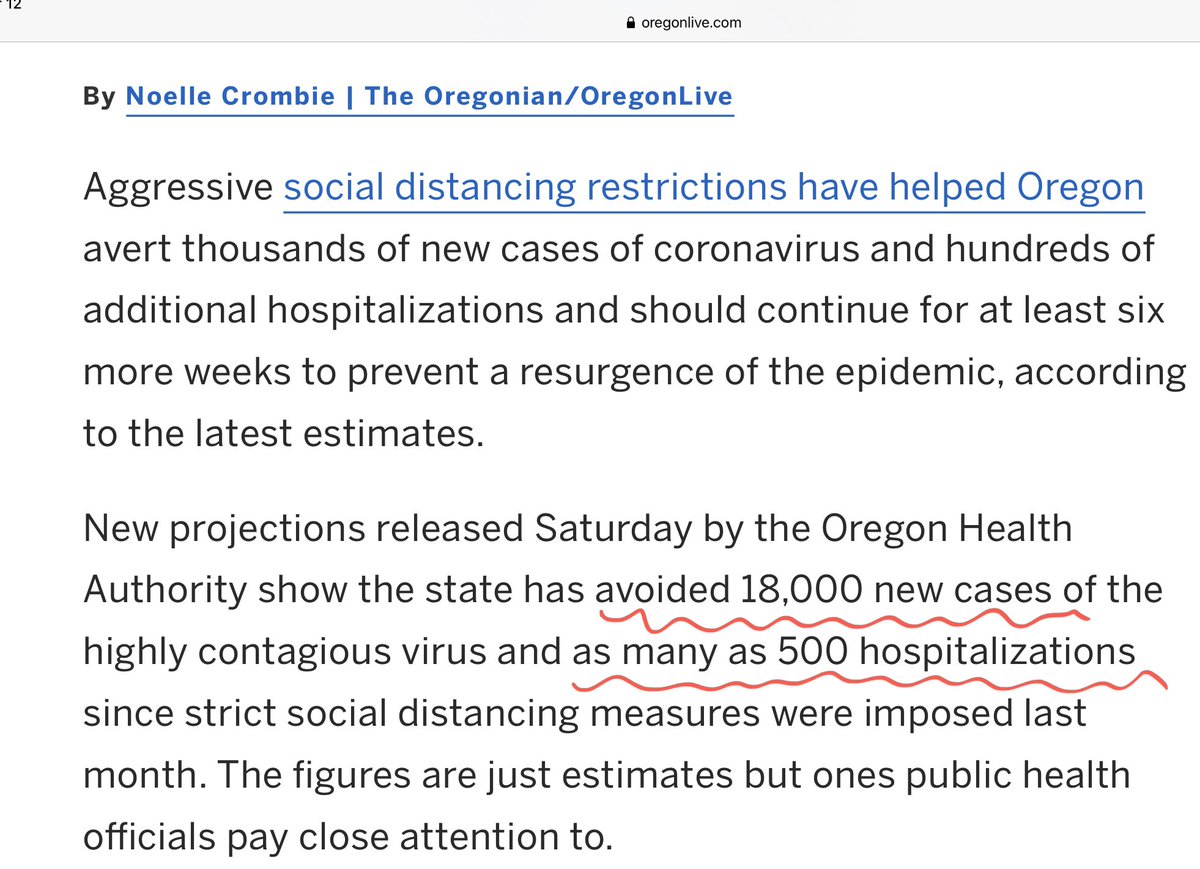
Estimated 18,000 new cases and ~500 hospitalizations AVOIDED!
Estimated 18,000 new cases and ~500 hospitalizations AVOIDED!

 Read on Twitter


