PROFESSOR GATO, back again with another look at the burning question of the day:
do the current spate of unprecedented lockdowns and quarantines work to stop COV?
the evidence from the US is even more compelling than the EU.
short answer: there is no evidence it works.
do the current spate of unprecedented lockdowns and quarantines work to stop COV?
the evidence from the US is even more compelling than the EU.
short answer: there is no evidence it works.
let& #39;s lay out the rationale again:
correlation is not causality. we all know this. BUT, causality without correlation is pretty implausible.
if you have a plan to stop fires, even if it only works part way, you& #39;d expect to see some change in the burn rate.
correlation is not causality. we all know this. BUT, causality without correlation is pretty implausible.
if you have a plan to stop fires, even if it only works part way, you& #39;d expect to see some change in the burn rate.
but what if we don& #39;t see it?
in the US, there is no meaningful correlation between degree of lockdown/distancing variance and COV deaths/mm population
here& #39;s the first chart:
SD variance is the simple avg of time spent at retail/restaurants, grocery, parks, mass transit, work
in the US, there is no meaningful correlation between degree of lockdown/distancing variance and COV deaths/mm population
here& #39;s the first chart:
SD variance is the simple avg of time spent at retail/restaurants, grocery, parks, mass transit, work
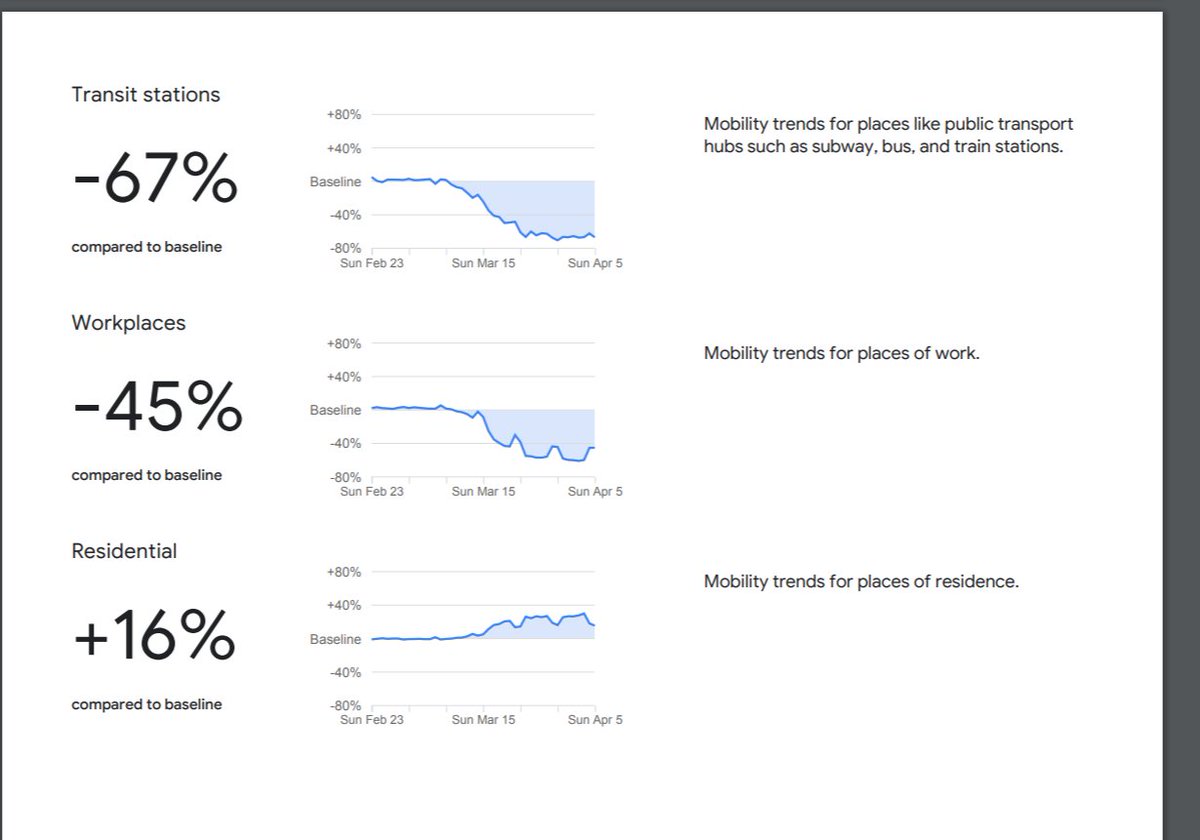
i plotted this from google community mobility reports.
3/29 were the earliest available and they are in annoying, siloed PDF format so it& #39;s manually intensive to extract data. 3/29 is earliest actual reported figures. BUT the pdf& #39;s have charts going back further and they help
3/29 were the earliest available and they are in annoying, siloed PDF format so it& #39;s manually intensive to extract data. 3/29 is earliest actual reported figures. BUT the pdf& #39;s have charts going back further and they help
they show that in the US, nearly all states reached 3/29 levels by 3/22 & stayed pretty constant. we see same on 4/5 data. this leads me to believe that 3/29 levels are highly predictive of 3/22 levels and that we have a 3 week series.
this shud start to make deaths predictive
this shud start to make deaths predictive
a key question right now is whether parks matter. i& #39;m not at all clear they predict anything. r2 is near zero and variance is odd. i& #39;m concerned they are injecting noise (perhaps a weather signal) into the data.
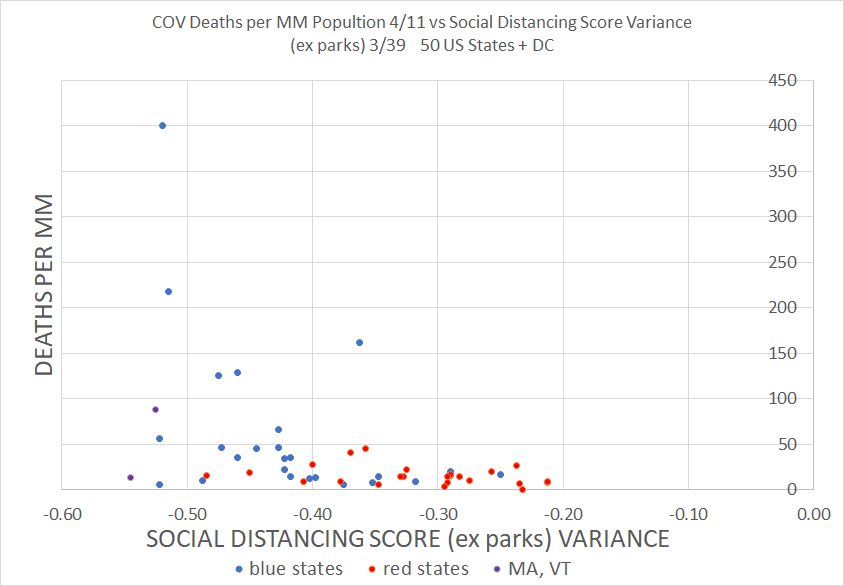
so, i ran it again without parks.
so, i ran it again without parks.
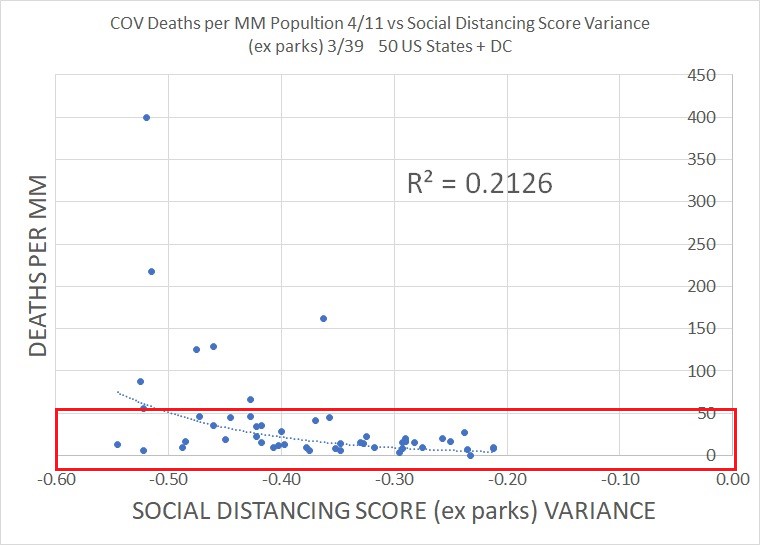
i think this is the best US dataset.
what we see is NOTHING. the r2 is very low. more provocatively, it has the opposite sign you& #39;d expect. but this seems driven mostly by a few outliers.
let& #39;s look at it a bit differently.
what we see is NOTHING. the r2 is very low. more provocatively, it has the opposite sign you& #39;d expect. but this seems driven mostly by a few outliers.
let& #39;s look at it a bit differently.
look at the states with fewer than 50 deaths per million pop.
it& #39;s just a smear. there is no correlation there at all. this is VERY interesting as not only does it show lack of efficacy, but it casts real doubt on the thesis that lockdown intensity is responsive to death rates
it& #39;s just a smear. there is no correlation there at all. this is VERY interesting as not only does it show lack of efficacy, but it casts real doubt on the thesis that lockdown intensity is responsive to death rates
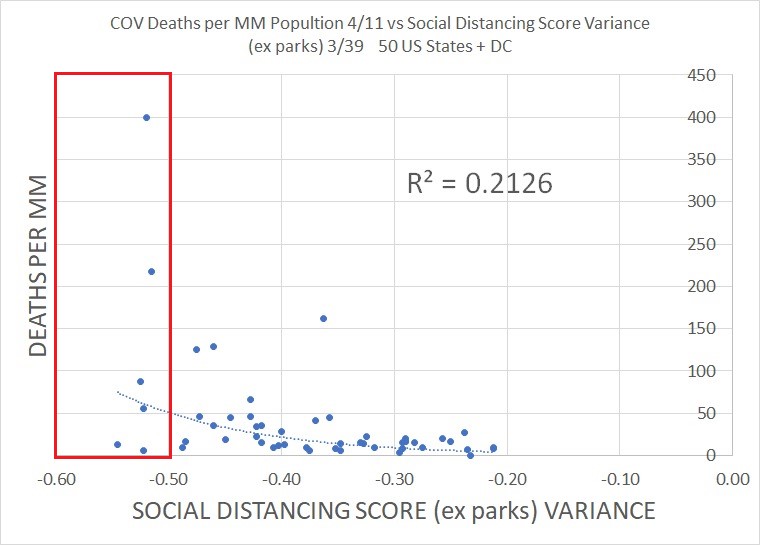
we can also look at this small set of the states that imposed the strictest policies. again, it& #39;s all over the place and seems to have no real pattern.
again, problematic for both claims of efficacy and the idea that policy is predominantly driven by death rates.
again, problematic for both claims of efficacy and the idea that policy is predominantly driven by death rates.
let& #39;s look at some component analysis.
i did not include "time at home" in the SD measure because hours at home are much higher, so % change is smaller. i did not want it to be swamped by "time at grocery store" or to invent an arbitrary over-weighting coefficient.
i did not include "time at home" in the SD measure because hours at home are much higher, so % change is smaller. i did not want it to be swamped by "time at grocery store" or to invent an arbitrary over-weighting coefficient.
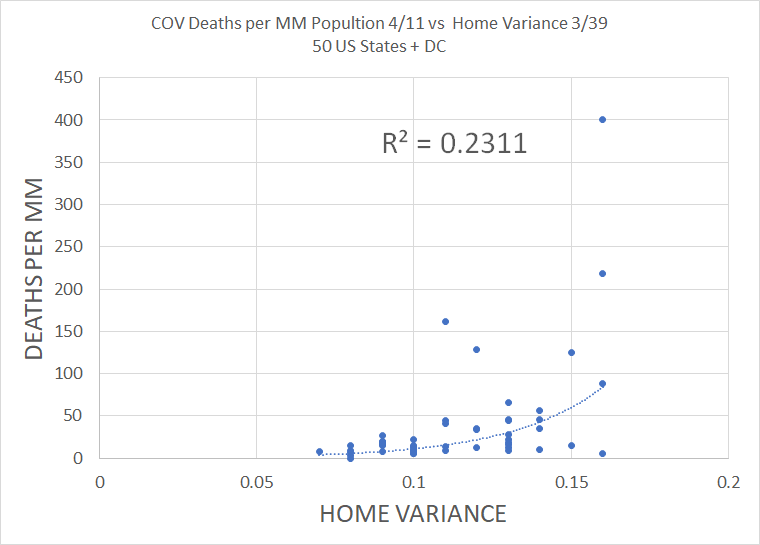
home data is also uncorrelated. it has the same features for < 50 deaths and > 15% rise edge cases as the SD score. it seems to be telling us nothing and has the same slight correlation opposite to what we& #39;d expect if quarantine were working.
time at work is the same story.
time at work is the same story.
it& #39;s just the same all over. no matter how you slice and dice this, the same story emerges:
the intensity of social distancing changes is not predictive (and even slightly anti predictive) of how well you avoid deaths.
this is severely problematic.
the intensity of social distancing changes is not predictive (and even slightly anti predictive) of how well you avoid deaths.
this is severely problematic.
the US has just undertaken, mostly at the urging of state governments, the most aggressive set of economically impactful policies since the 1930& #39;s.
the costs are staggering.
and there is little or no evidence that it& #39;s working or was even needed.
the costs are staggering.
and there is little or no evidence that it& #39;s working or was even needed.
we bet the ranch on a model. the model is failing
assuming my results hold, and in another week or so, we can start ascribing high confidence to them, there is gonna be some serious explaining to do
there will not be enough tar and feathers in the whole US to mete out justice
assuming my results hold, and in another week or so, we can start ascribing high confidence to them, there is gonna be some serious explaining to do
there will not be enough tar and feathers in the whole US to mete out justice
now, because i& #39;m apparently not very smart, i& #39;m going to put my foot in a political pothole notorious for breaking ankles.
i noticed something else in the data.
there was one variable highly predictive of response intensity: politics.
i noticed something else in the data.
there was one variable highly predictive of response intensity: politics.
average change in red states was -.32.
average change in blue states was -.42.
i put massachusetts and vermont in a sep category as they both have republican governors, but not that would be called so in pretty much any other state.
it& #39;s hard to call them red.
average change in blue states was -.42.
i put massachusetts and vermont in a sep category as they both have republican governors, but not that would be called so in pretty much any other state.
it& #39;s hard to call them red.
deaths per million average 16 in red states vs 62 in blue states
please note that i am NOT ascribing this to better leadership. red states tend to be more rural & blue more urban. this trend could be caused by a lot of things and that avg is heavily affected by a few outliers
please note that i am NOT ascribing this to better leadership. red states tend to be more rural & blue more urban. this trend could be caused by a lot of things and that avg is heavily affected by a few outliers
BUT, politics do look highly predictive of response and this may explain why this issue has become so politically rancorous in the US.
in a time when we needed leaders, we got politicians.
i& #39;m pretty disgusted with 99% of them.
and it& #39;s time to start holding them to account.
in a time when we needed leaders, we got politicians.
i& #39;m pretty disgusted with 99% of them.
and it& #39;s time to start holding them to account.
they have run us off the road quite badly for what increasingly looks like no good reason.
it& #39;s time to develop herd immunity to "expert models."
from maoist 5 year plans to the TVA and the new deal, they have not been humanity& #39;s friend.
let& #39;s stop falling for this.
it& #39;s time to develop herd immunity to "expert models."
from maoist 5 year plans to the TVA and the new deal, they have not been humanity& #39;s friend.
let& #39;s stop falling for this.
a note on choices:
i used deaths because it& #39;s the most standardized series.
cases are really hard to compare. it mostly measures testing and that varies widely. also, mild cases can be argued to be good as a foundation of herd immunity.
i used deaths because it& #39;s the most standardized series.
cases are really hard to compare. it mostly measures testing and that varies widely. also, mild cases can be argued to be good as a foundation of herd immunity.
hospitalization and ICU would be great to use, but i cannot find any sort of standardized series and measurement looks haphazard and methodology varied.
(though if someone has a good set, please share)
(though if someone has a good set, please share)

 Read on Twitter