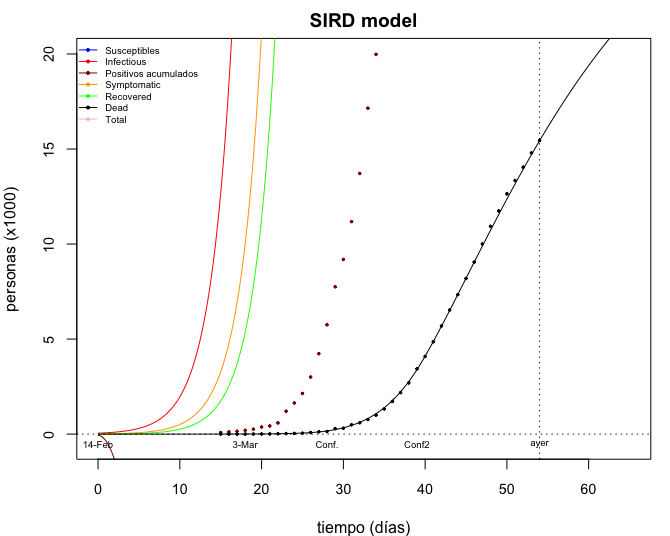
1) I need to share some interesting results from the model I described last week. As said, this is by no means to scrutinise any official policy, but to help understanding.
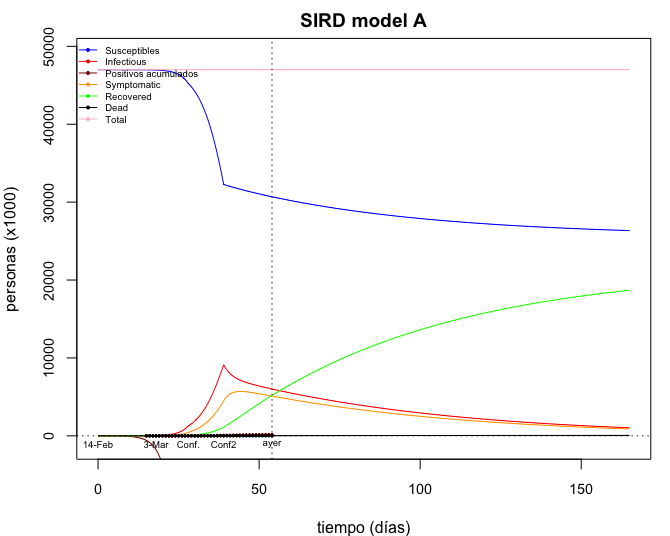
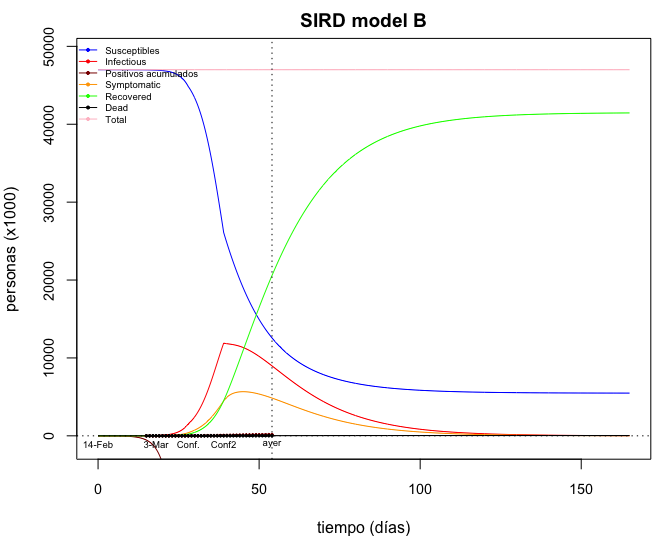
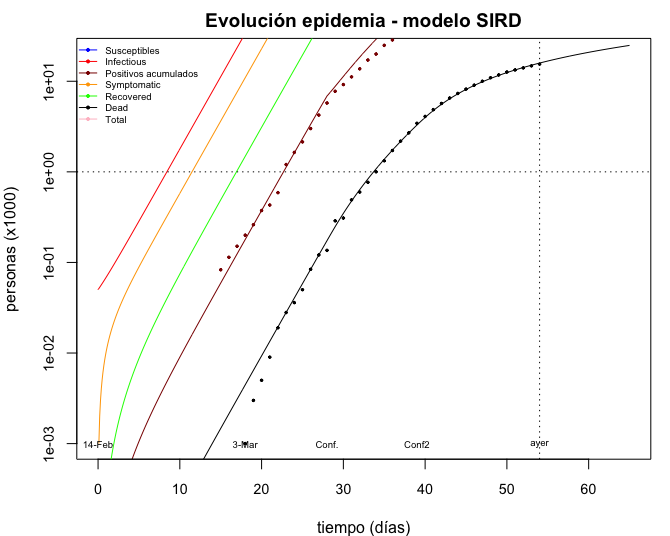
These two model runs (calibrated for Spanish Covid-19 data) are identical except for two parameters (...)
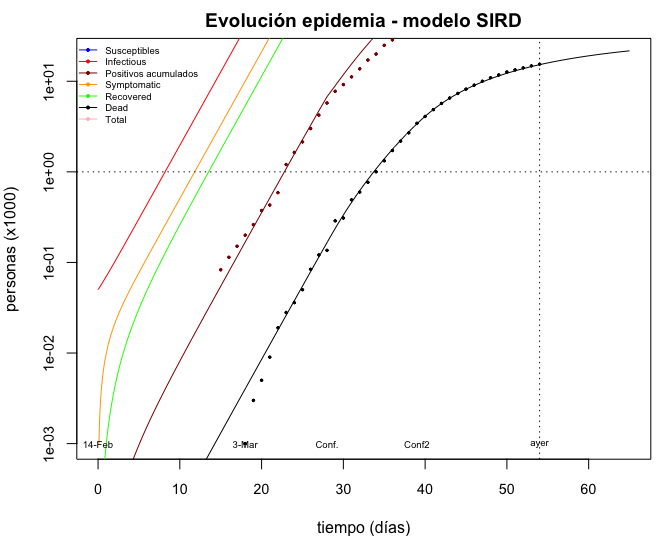
These two model runs (calibrated for Spanish Covid-19 data) are identical except for two parameters (...)
2) But before going any further on them, let me link the description of the model: https://twitter.com/danigeos/status/1247107402102693888?s=20
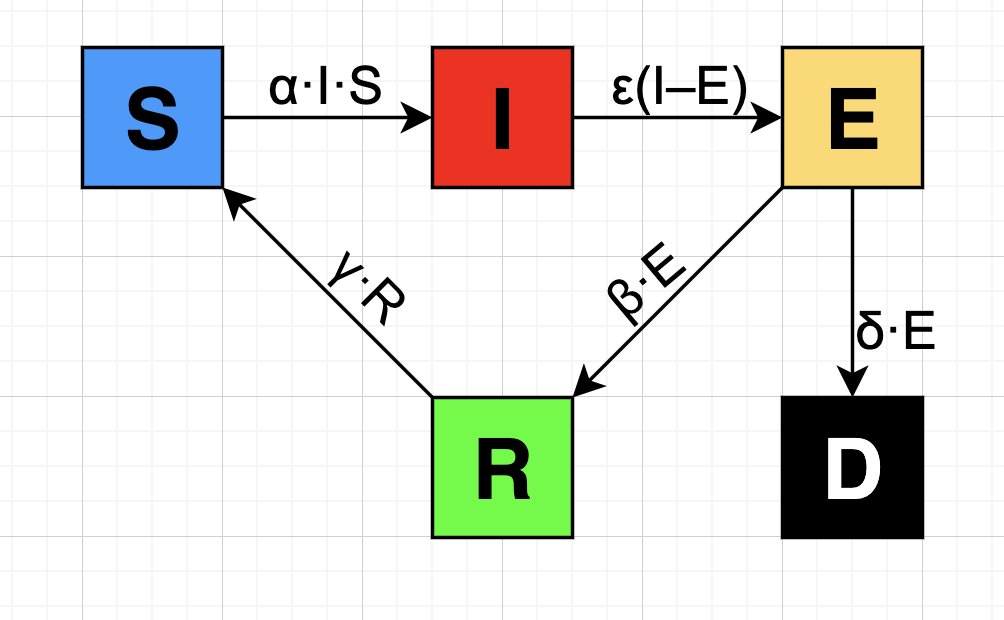
I">https://twitter.com/danigeos/... calculate the flow between 5 boxes of people:
S-Susceptible
I-Infectious
E-Infected
R-Recovered
D-Dead
They add to 47 M (Spanish population).
I">https://twitter.com/danigeos/... calculate the flow between 5 boxes of people:
S-Susceptible
I-Infectious
E-Infected
R-Recovered
D-Dead
They add to 47 M (Spanish population).
3) and this is where to download my last (present) version. You can run this in RStudio in two clicks: https://github.com/danigeos/epSIRDemics">https://github.com/danigeos/...
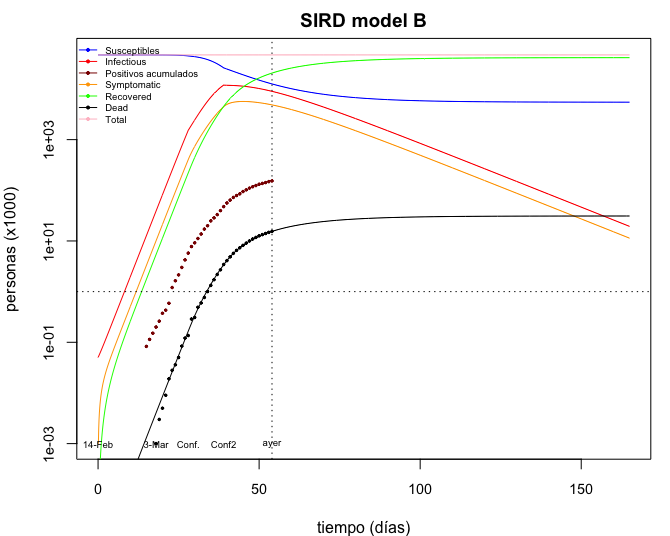
4) OK. What I& #39;ve done is fitting the death data (black) by arbitrarily changing the least constrained parameters: α (infectivity) and β (recovery rate). β is 4 times higher in model B (20%/day) than in A (5%).
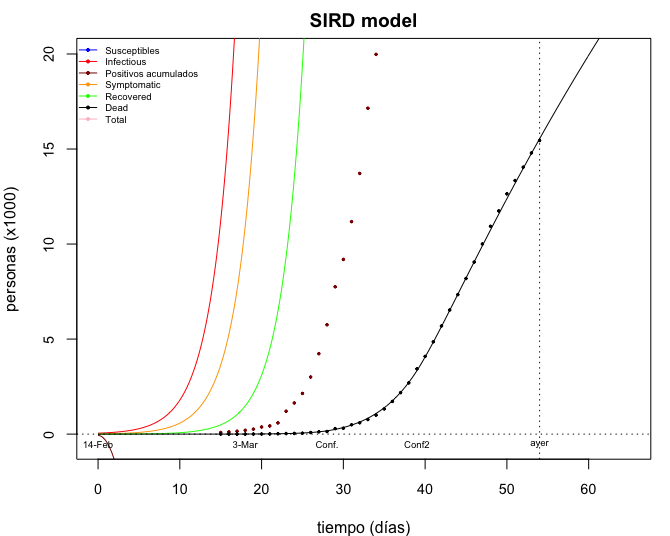
5) Fitting the predicted curve to the data is far easier in a logarithmic scale (I lost weeks before realising this). As I argued in the thread linked above, I do not prioritise fitting the positive tests (dark-red) because they are too unreliable.
6) Going back to the different predictions in the two model runs A and B (here in log scale), what is interesting is that both fit well the data available until yesterday and yet they yield significantly different future results.
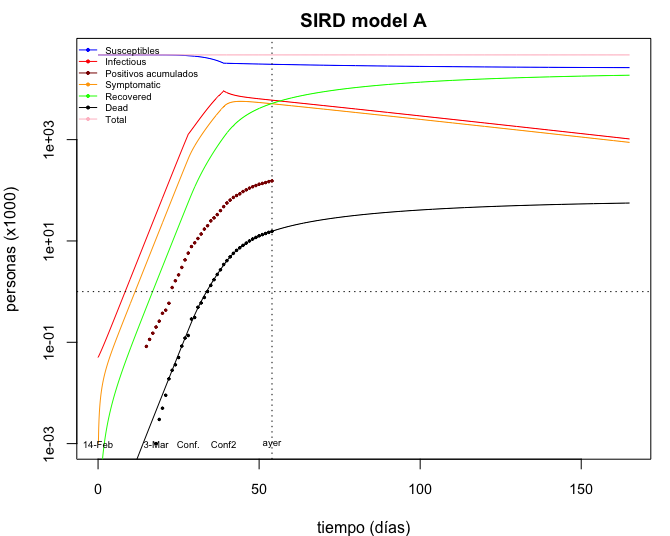
Final casualties:
D(A)=56k
D(B)=31k
Final casualties:
D(A)=56k
D(B)=31k
7) (the vertical dotted line is the present time)
More deaths D, on the other hand, leads to significantly less susceptibles S in the far future:
S(A)=5.5M
S(B)=26.3M
More deaths D, on the other hand, leads to significantly less susceptibles S in the far future:
S(A)=5.5M
S(B)=26.3M
8) In the code you can see I played with 3 stages of α:
normal, confined, lockdown (ending at t=C1, C2, C3).
Both models fit consistently with decreasing values of α, which makes our intuition happier (more confinement <=> smaller alpha).
normal, confined, lockdown (ending at t=C1, C2, C3).
Both models fit consistently with decreasing values of α, which makes our intuition happier (more confinement <=> smaller alpha).
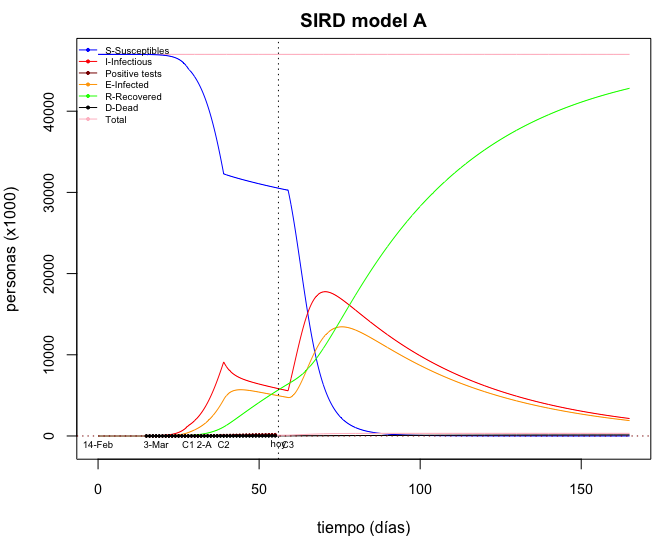
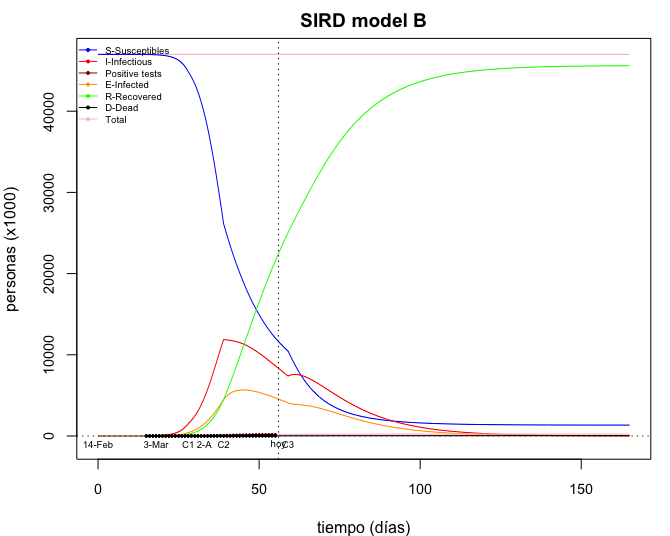
9) This gives the impression that the model could predict the future impact of lockdown decisions.
BUT, this is what happens to our two & #39;good& #39; models when restoring the original infectivity to & #39;normal& #39; by tomorrow:
BUT, this is what happens to our two & #39;good& #39; models when restoring the original infectivity to & #39;normal& #39; by tomorrow:
10)
While A duplicates the number of victims, B stays nearly as originally.
While A predicts a second wave of infections, B doesn& #39;t.
And there is no way to tell which model is more accurate!
While A duplicates the number of victims, B stays nearly as originally.
While A predicts a second wave of infections, B doesn& #39;t.
And there is no way to tell which model is more accurate!
11) This is because the model is simplistic (in the code above you have a list of things knowingly unaccounted for, such as spatial or age compartmentalisation).
Surely, models run by the teams advising the Gvmt are more sophisticated and their data more reliable.
Surely, models run by the teams advising the Gvmt are more sophisticated and their data more reliable.
12) So: deciding when to end the confinement is a decision submitted to strong uncertainties.
In the last days, studies aside of the official channels have been used to strongly oppose Spanish gvnmt decisions in connection with nationalist political positions here in Catalonia.
In the last days, studies aside of the official channels have been used to strongly oppose Spanish gvnmt decisions in connection with nationalist political positions here in Catalonia.
13) Unfortunately, those modelling studies were accompanied by strong political statements addressed to the media instead of addressing the coordinators of the committee or other official channels set for this crisis. CC @ToniTrilla @_MiguelHernan @miquelporta
14) Unsurprisingly if you read all this thread, those models did not have the accuracy they claimed, and they have been later discretely smoothed out by their authors in their conclusions. But the damage of their interference with official positions is already done.

 Read on Twitter