LESSON:
Supports and resistances are not numbers. They are ranges.
The range is directly proportional to candlestick wicks from the previous range.
Most of you know this, but there are a lot of newcomers lately. Don& #39;t make the mistakes I did.
I will explain with a few charts.
Supports and resistances are not numbers. They are ranges.
The range is directly proportional to candlestick wicks from the previous range.
Most of you know this, but there are a lot of newcomers lately. Don& #39;t make the mistakes I did.
I will explain with a few charts.
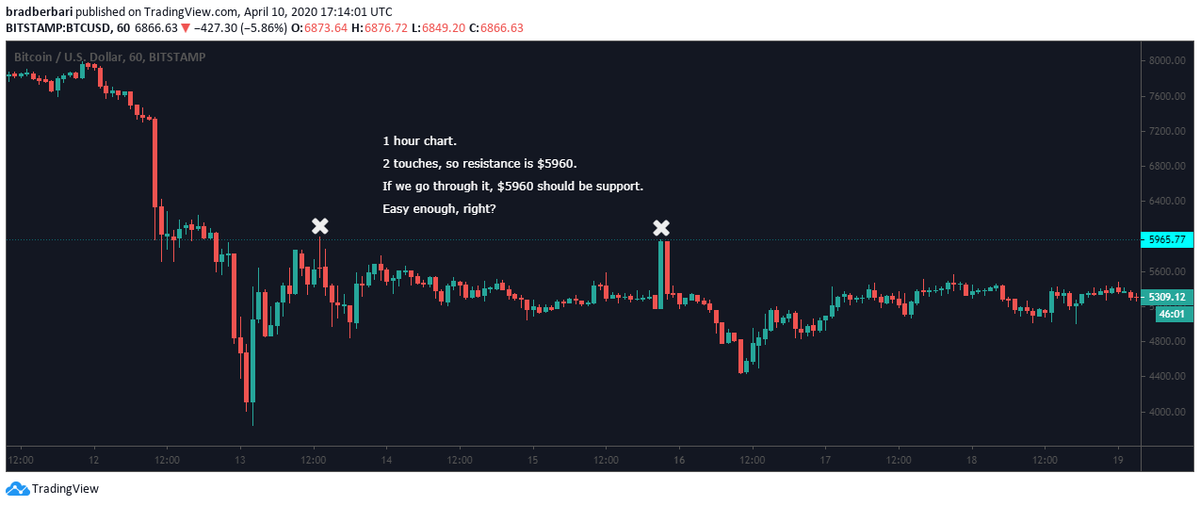
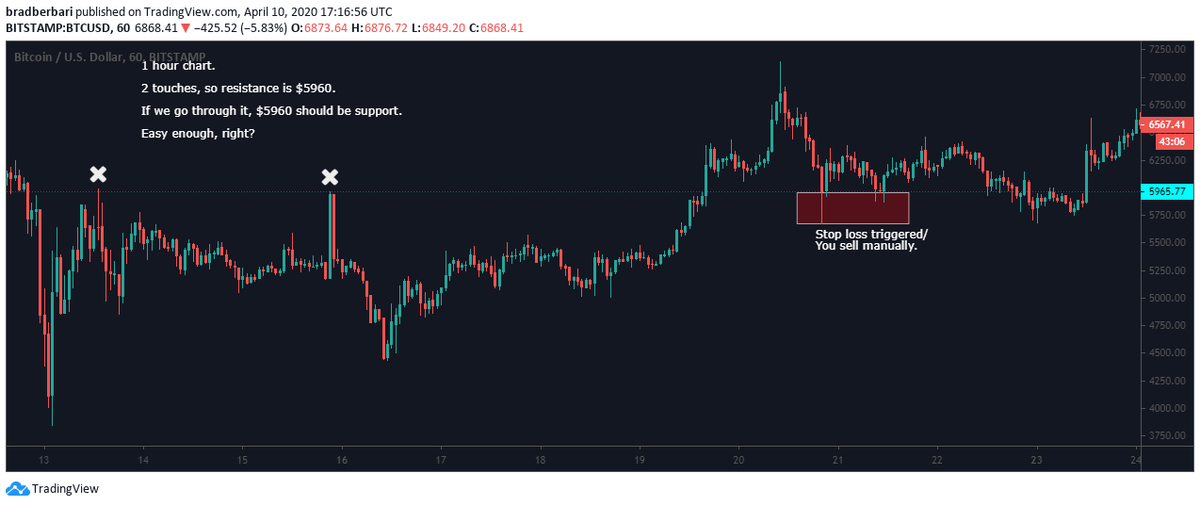
So here we& #39;re looking at BTC after it crashed and bounced.
Left: You think the resistance is the highest price that BTC reached in its previous range.
Right: You sell on a break under $5960 (red box), once price pumps to $6800 and then corrects underneath it.
Left: You think the resistance is the highest price that BTC reached in its previous range.
Right: You sell on a break under $5960 (red box), once price pumps to $6800 and then corrects underneath it.
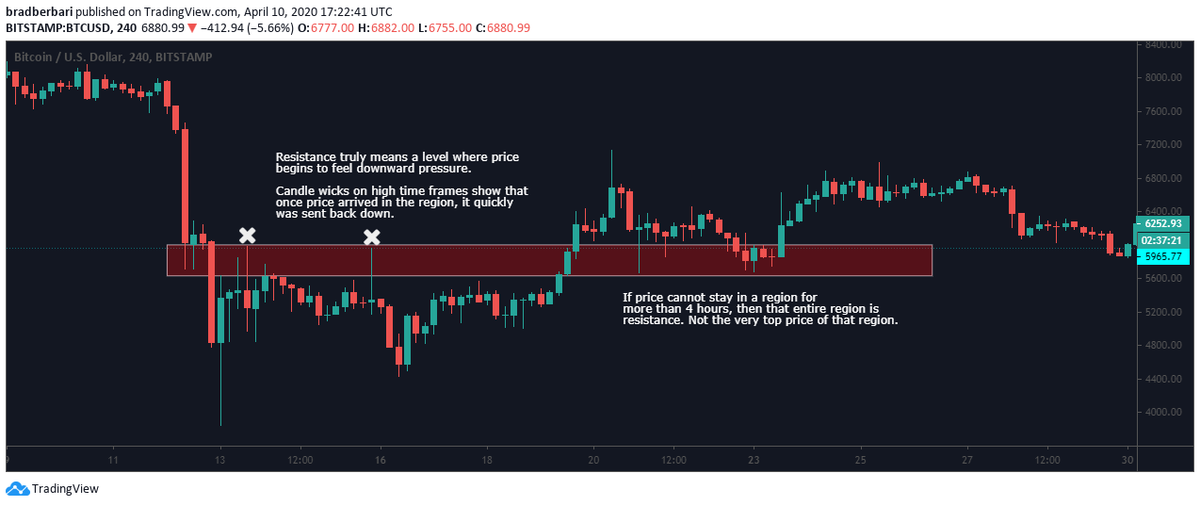
Big difference here. Changing it from 1 hour to 4 hours.
4 hour chart, for me, is the min. TF for drawing reliable S/R regions.
Draw the bottom of your former resistance (now support) region. Use the highest candle close from the previous region.
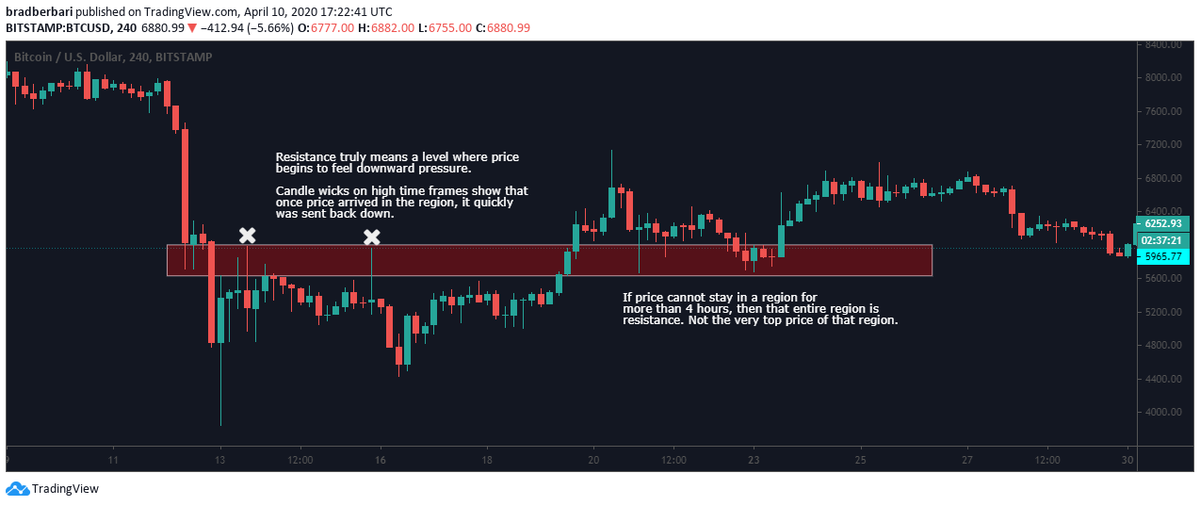
4 hour chart, for me, is the min. TF for drawing reliable S/R regions.
Draw the bottom of your former resistance (now support) region. Use the highest candle close from the previous region.
Price dips under the top of the region $5960. But now, you drew your support as a range instead of a flat number.
You placed limit buys from the top to bottom of the range, and your stop 1% below the range bottom.
Like magic, the price wicks down to your orders.
You placed limit buys from the top to bottom of the range, and your stop 1% below the range bottom.
Like magic, the price wicks down to your orders.
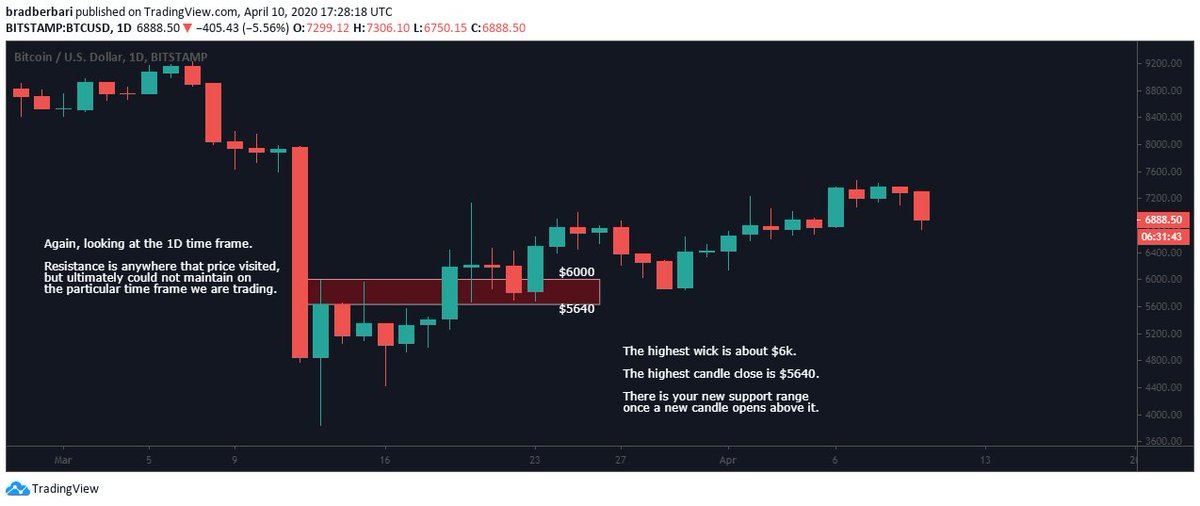
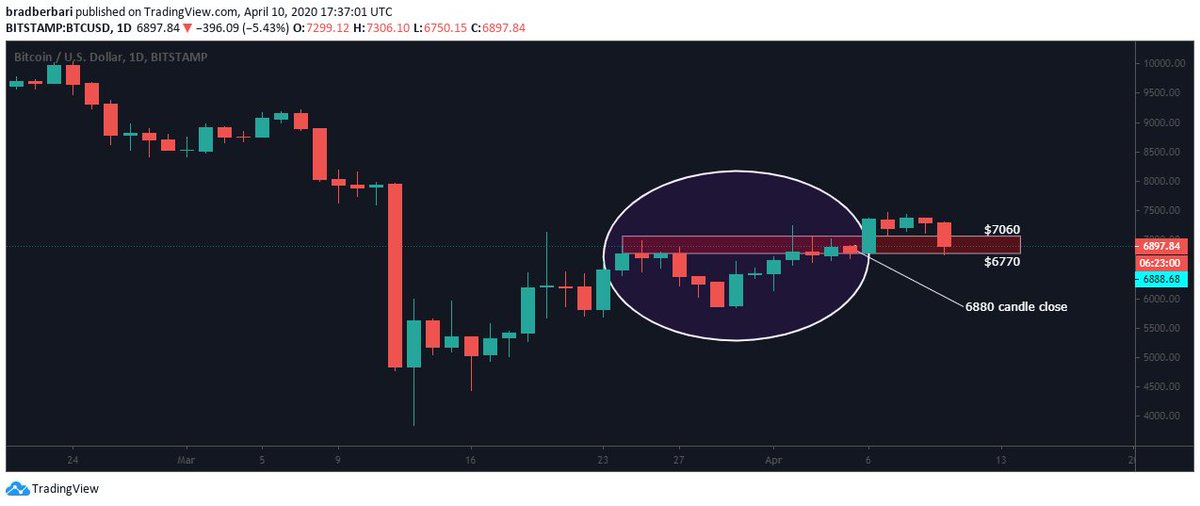
Using the 1D chart is even better.
Left: I outlined the range a little more clearly.
Right: I did the same thing with our new trading range.
Left: I outlined the range a little more clearly.
Right: I did the same thing with our new trading range.
Now you could say that the bottom of the support should be drawn at $6880 (shown on chart) because of that candle close.
I would argue that we were in the same range the whole time in the purple oval.
We should still use the lowest resistance close as the bottom of next support
I would argue that we were in the same range the whole time in the purple oval.
We should still use the lowest resistance close as the bottom of next support
At the end of the day, trading is tough. It will never be an exact science.
In general, 90% of our mistakes come from greed or impatience.
Setting a bid that never hits is better than losing money.
Trust your plan. If it doesn& #39;t work out, on to the next!
In general, 90% of our mistakes come from greed or impatience.
Setting a bid that never hits is better than losing money.
Trust your plan. If it doesn& #39;t work out, on to the next!

 Read on Twitter