Reporters have been asking for weeks.
Now the Minnesota Department of Health is bringing its modeling into the public eye via a video conference.
Now the Minnesota Department of Health is bringing its modeling into the public eye via a video conference.
Minnesota how has a website to explain its modeling.
The slideshow that reporters are getting at today& #39;s news conference is found at the bottom of this webpage.
https://mn.gov/covid19/data/modeling.jsp">https://mn.gov/covid19/d...
The slideshow that reporters are getting at today& #39;s news conference is found at the bottom of this webpage.
https://mn.gov/covid19/data/modeling.jsp">https://mn.gov/covid19/d...
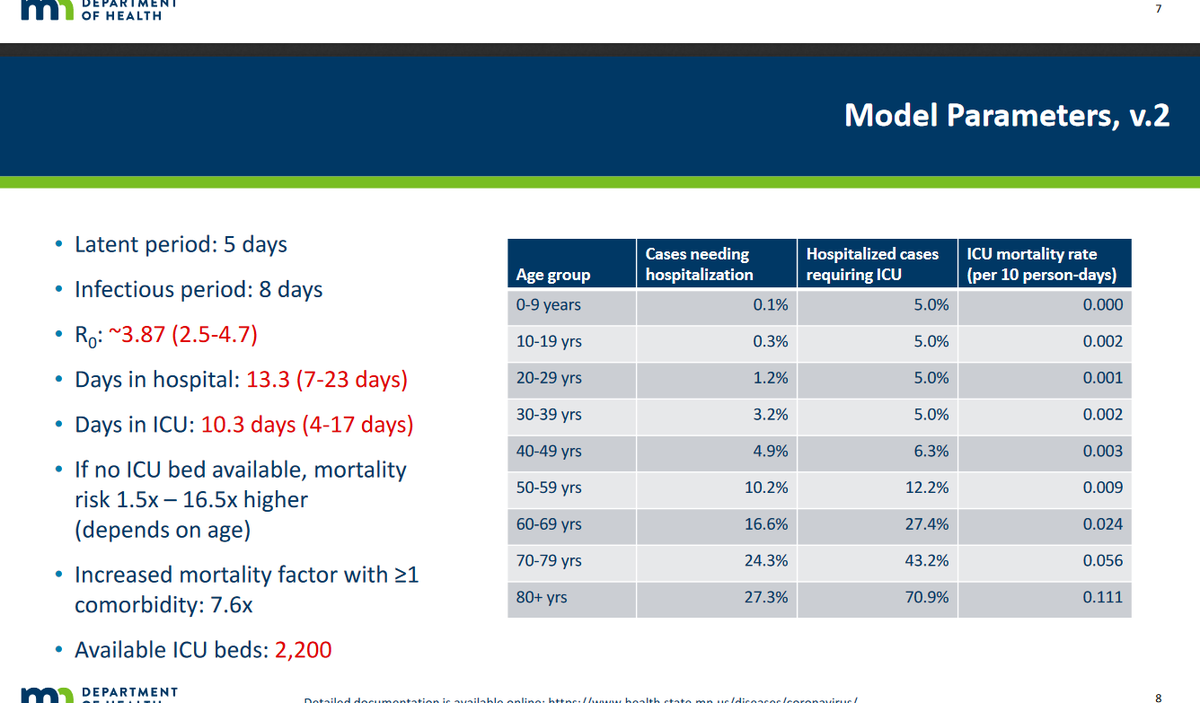
The R0 - the average number of people an infected person will infect -- has increased to 3.9 in this latest model.
Gov. Tim Walz first revealed this at a news conference on Wednesday.
Gov. Tim Walz first revealed this at a news conference on Wednesday.
MDH repeats an earlier assertion that the number of confirmed cases is around 1% of the total number of cases in the state.
This is based on the lack of testing and asymptomatic patients.
This is based on the lack of testing and asymptomatic patients.
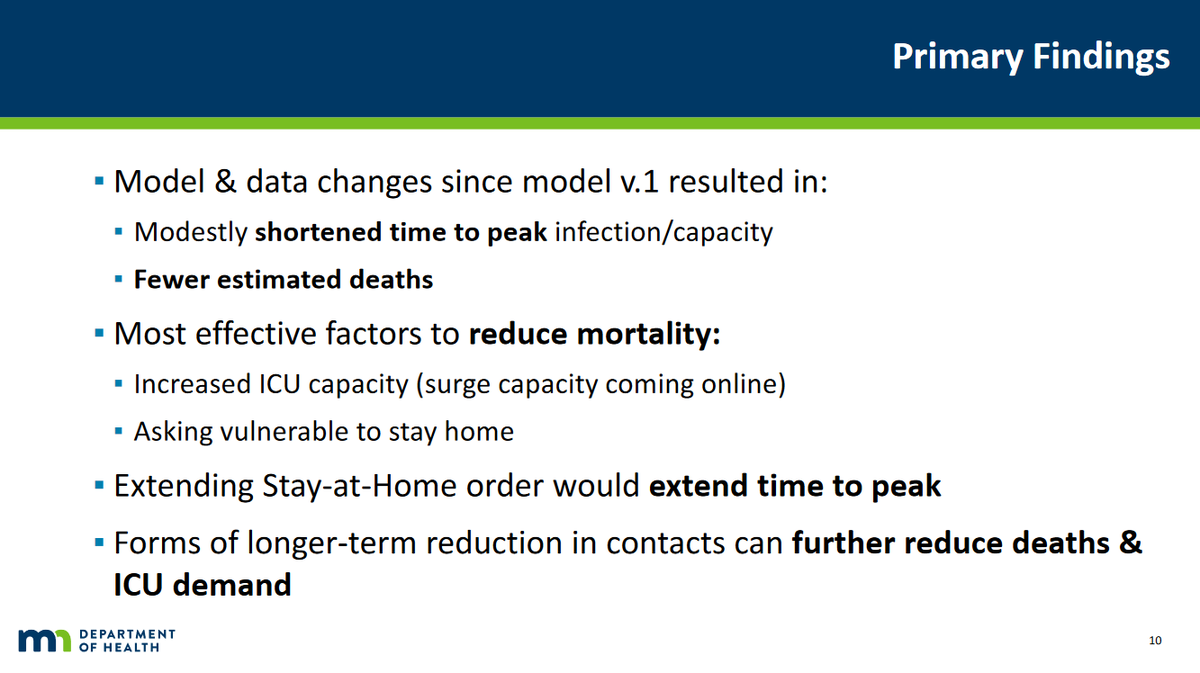
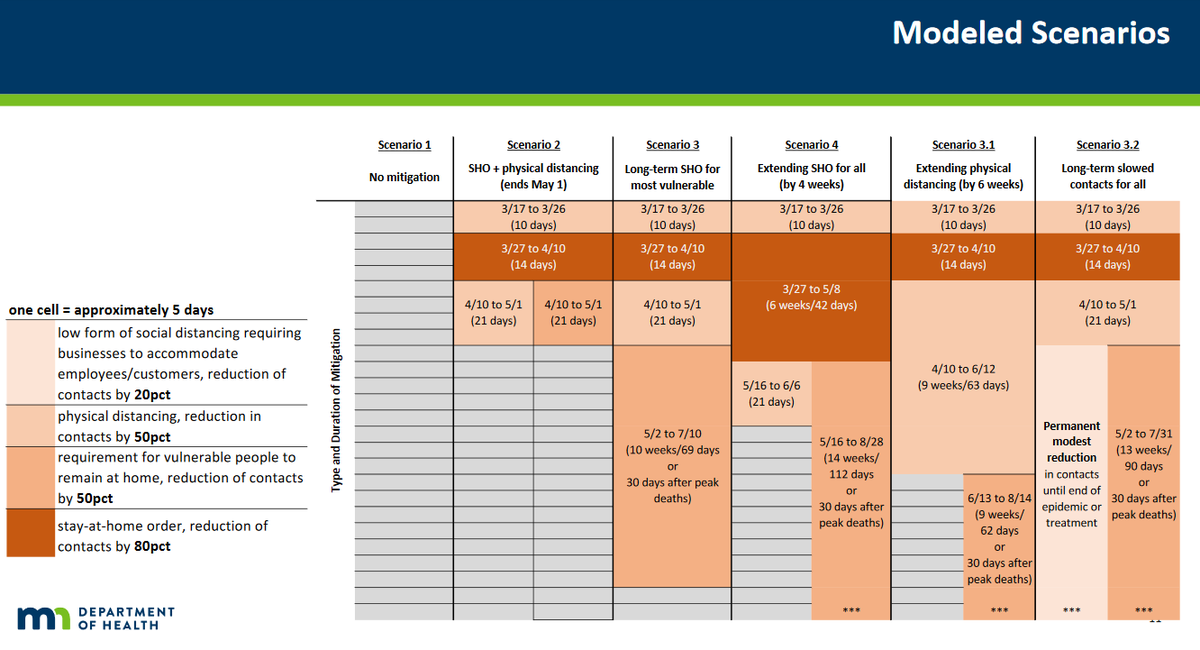
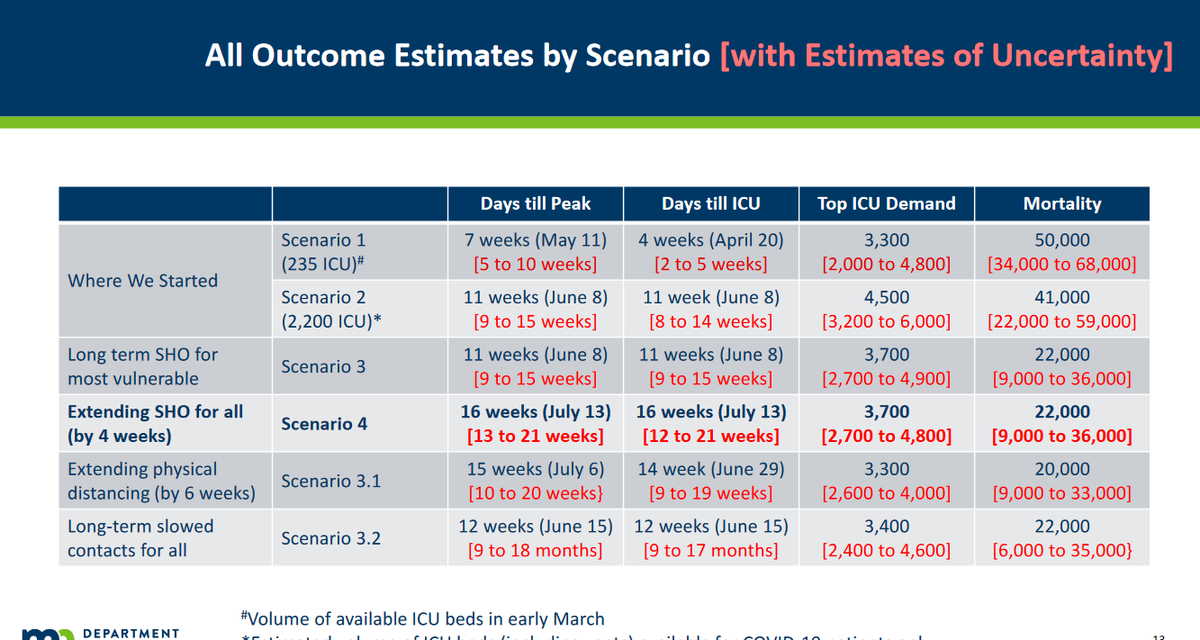
Here& #39;s what changed since MDH did Version 1 of the model:
The Minnesota Department of Health is aiming to release its "model interface and code" in late April.
NEWS: MDH& #39;s Stefan Gildemeister says of the @IHME_UW model that shows significantly fewer deaths in Minnesota, "they have made some incredibly optimistic assumptions."
The UW model only looks out four months, until August.
The UW model only looks out four months, until August.
Health Commissioner Jan Malcolm says some hospitals are doing their own models and they "are much more pessimistic" than the MDH-UMN model.
Malcolm: “This is not a one-time event. This is not, hit the peak and everything goes back to normal."
There will be more waves, she says.
There will be more waves, she says.

 Read on Twitter


