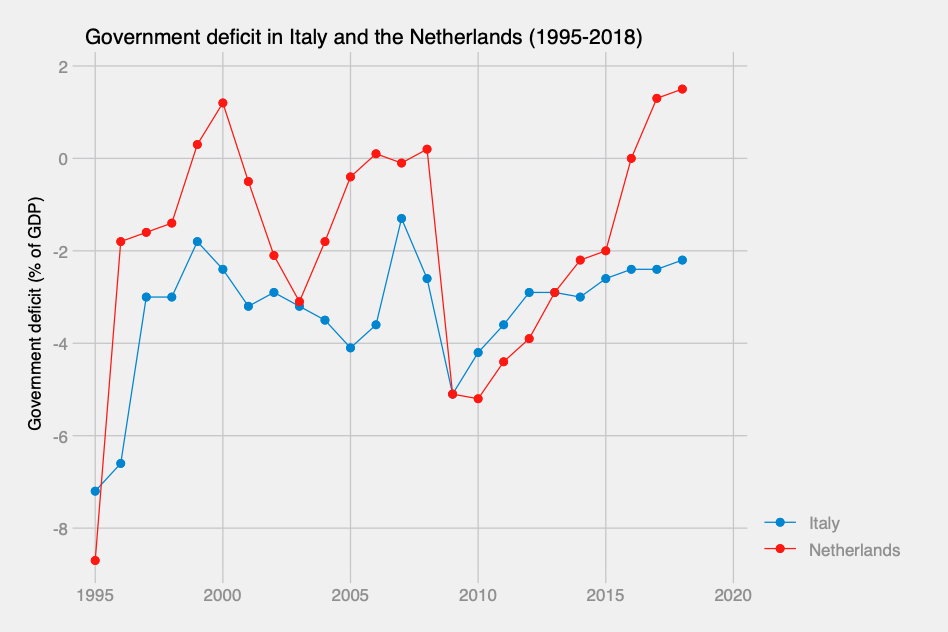
Since 1995, Italy has never had a balanced budget. The Netherlands has also run a deficit most years, but in general somewhat lower ones, and has had a surplus in a few years (Eurostat)
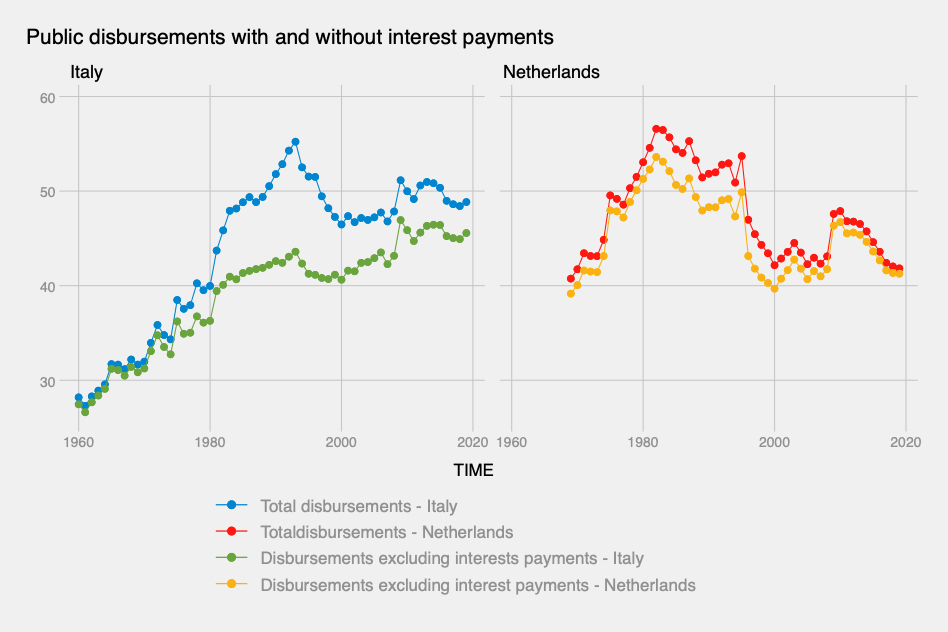
A big difference between Italy and the Netherlands is that Italy had been saddled with debt mostly built in the 1980s. In the 1990s, it managed to massively reduce it. This graph shows public spending with and without interest payments. Difference huge in Italy, small in the NL
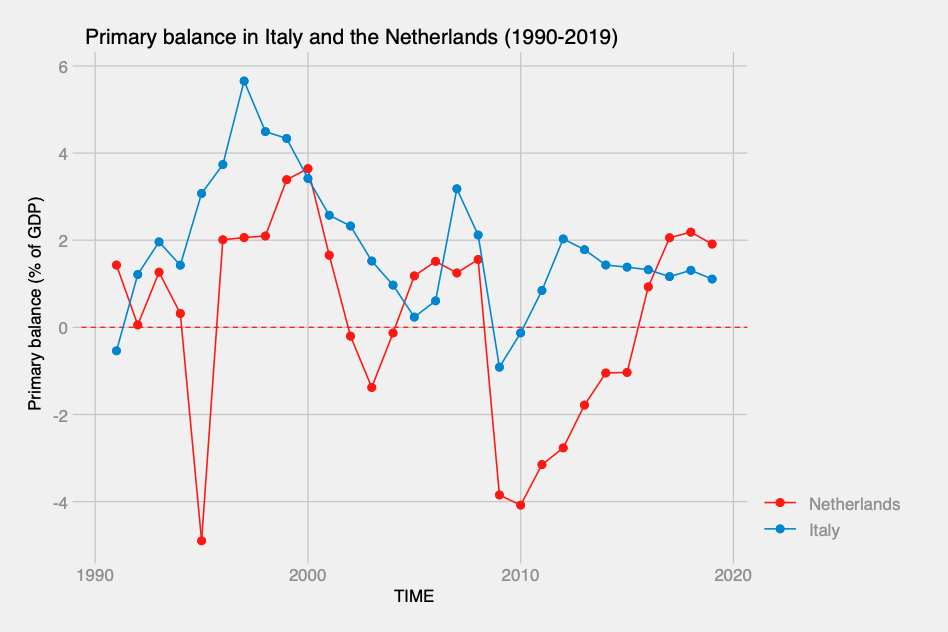
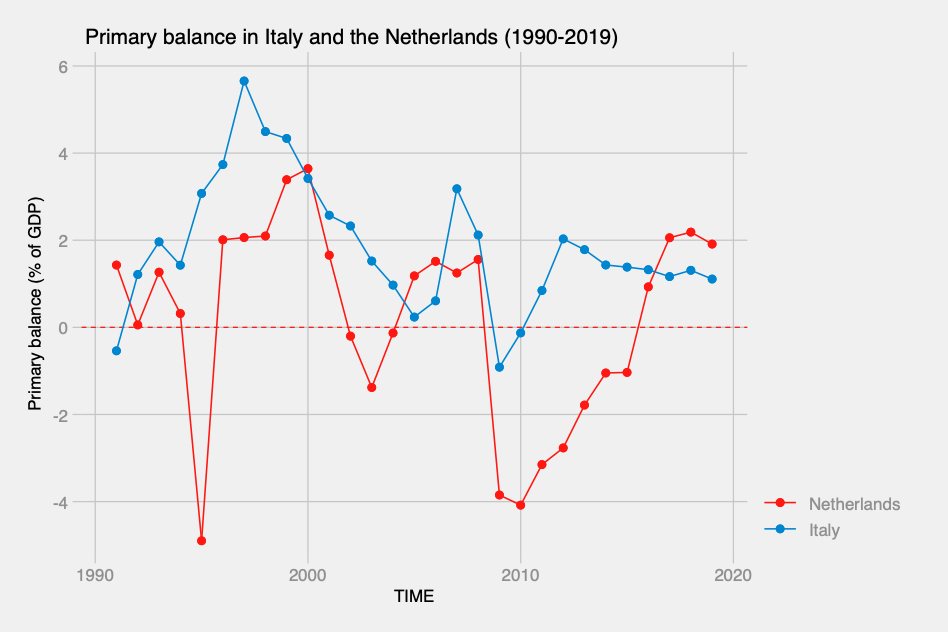
If you take out these interest payments and only consider public spending that goes to the population (health, roads, pensions, etc.), called the primary balance) since 1990 Italy has run a primary deficit in only 3 years, while the Netherlands has run a deficit in 11 years.
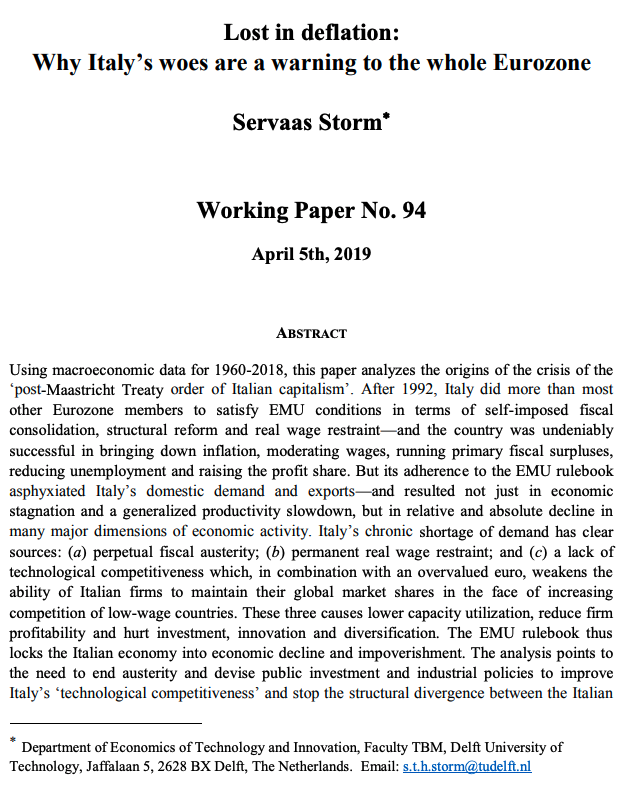
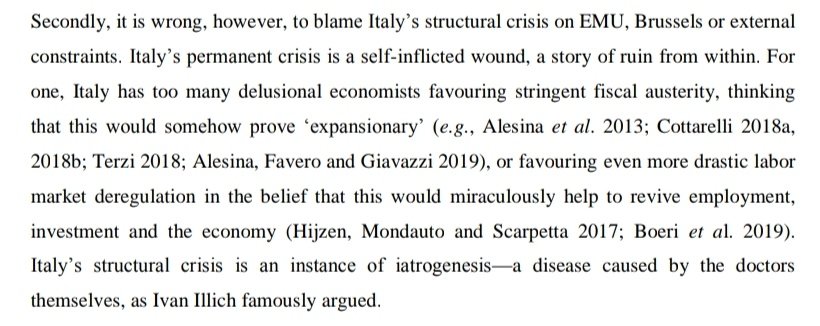
This is an interesting paper (by a Dutch academic!) showing that Italy& #39;s problem has clearly not been profligacy, but the opposite. https://www.ineteconomics.org/uploads/papers/WP_94-Storm-Italy.pdf">https://www.ineteconomics.org/uploads/p...
"After 1992, Italy did more than most other Eurozone members to satisfy EMU conditions in terms of self-imposed fiscal consolidation, structural reform and real wage restraint. But its adherence to the EMU rulebook
asphyxiated Italy’s domestic demand and exports"
asphyxiated Italy’s domestic demand and exports"
So if you think that Italy should simply spend less and tax more to reduce its debt: that& #39;s what Italy has done and iT dOEsn& #39;t WoRk
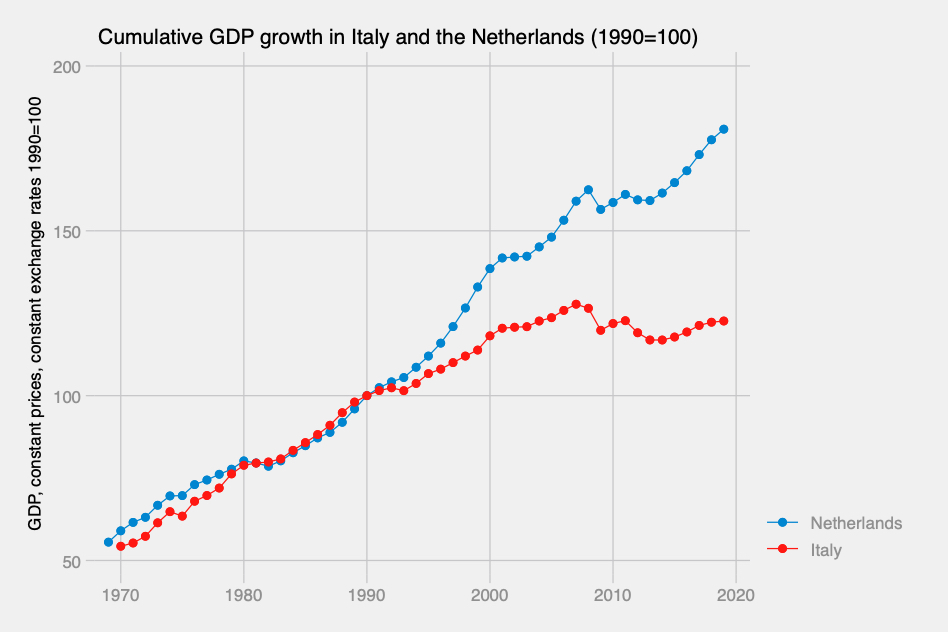
What is remarkable about Italy& #39;s constant primary balance since the 1990s is that it was done during a period of very long stagnation, when revenues are low and expenditures are high. This graph shows GDP growth in Italy and the Netherlands (base 1990 = 100).
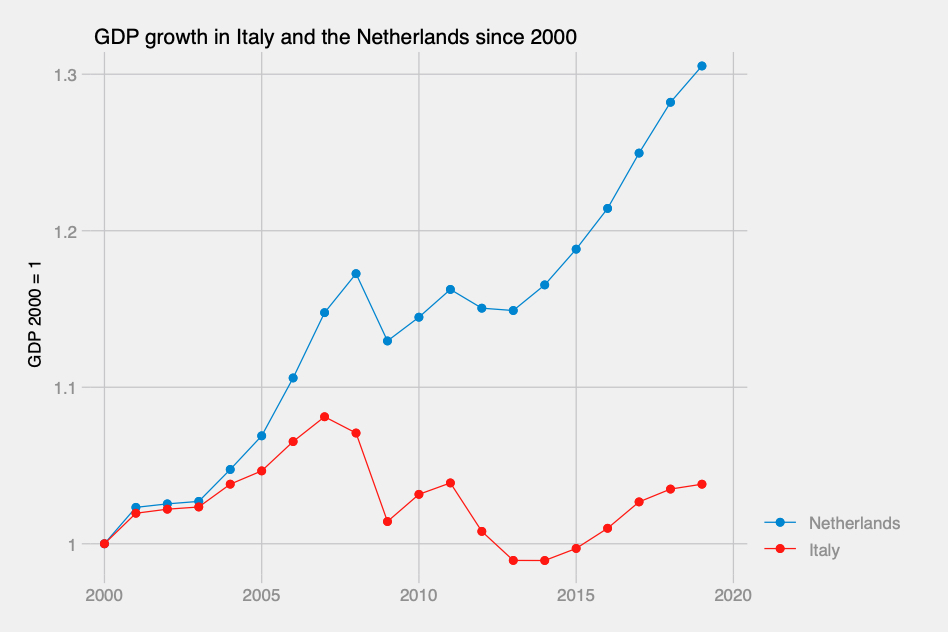
This is the same graph for the period after 2000, taking 2000 as a base. Since 2000, the Dutch economy has grown 30%, while the Italian economy has grown... 3%. In fact, it is even smaller than 10 years ago.
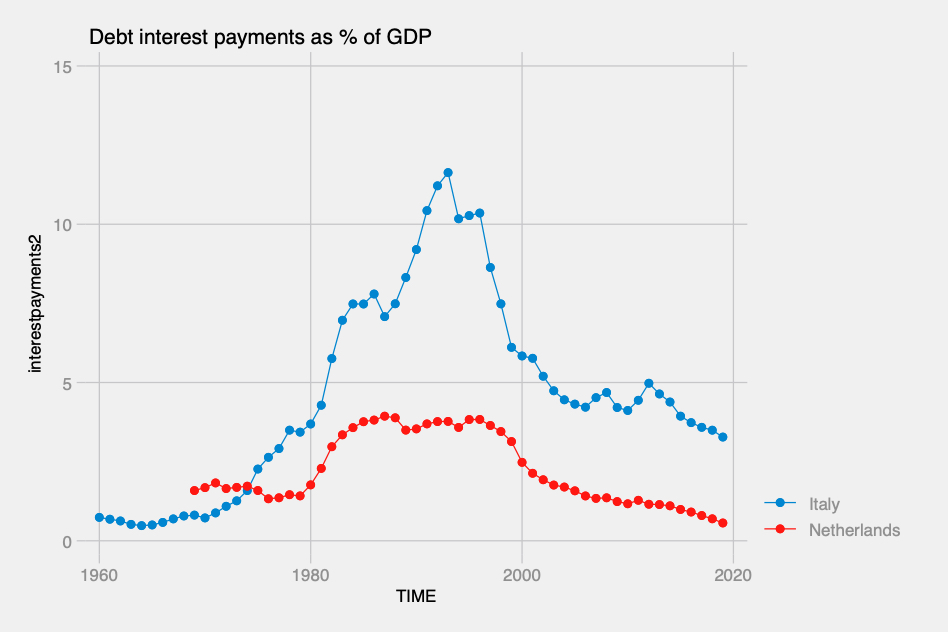
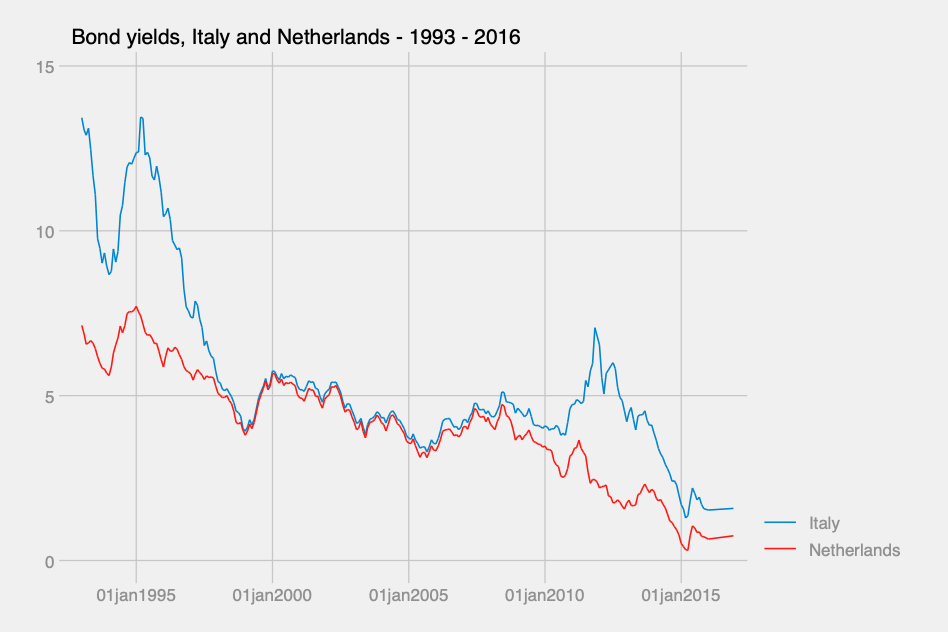
The Dutch government is able to borrow money at much cheaper rates than Italy. These are the interest payments that IT and NL pay every year to service their debt, as a share of GDP. Since 2010, IT has paid 4% of its GDP in interests every year; the NL, less than 1%.
Achieving a balanced budget with these liabilities is a bit like swimming with a bloc of concrete.
This is a good explainer on the origins of the Italian debt pile: #49855c421284">https://www.forbes.com/sites/annalisagirardi/2018/12/17/understanding-the-huge-italian-public-debt-as-a-legacy-of-the-oil-crisis/ #49855c421284">https://www.forbes.com/sites/ann...
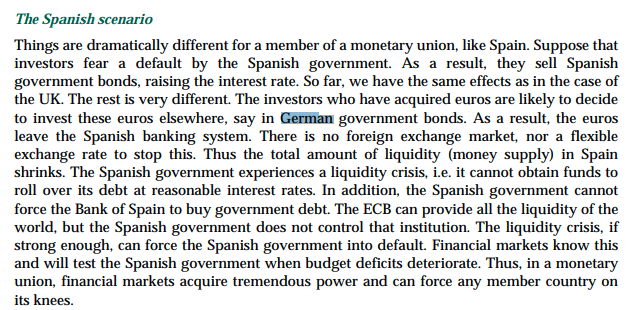
You might think that it& #39;s not the NL& #39;s fault if IT faces such high interest rates. Well in fact, within a currency union, money flows from countries considered risky (IT), pushing their borrowing costs upwards, to "safe" ones (NL), lowering theirs https://www.ceps.eu/wp-content/uploads/2011/05/WD%20346%20De%20Grauwe%20on%20Eurozone%20Governance.pdf">https://www.ceps.eu/wp-conten...
This is precisely what has happened as the pandemic hit Italy
https://www.wsj.com/articles/investors-drop-italian-bonds-seeking-safety-in-german-and-french-debt-11582825743">https://www.wsj.com/articles/...
https://www.wsj.com/articles/investors-drop-italian-bonds-seeking-safety-in-german-and-french-debt-11582825743">https://www.wsj.com/articles/...
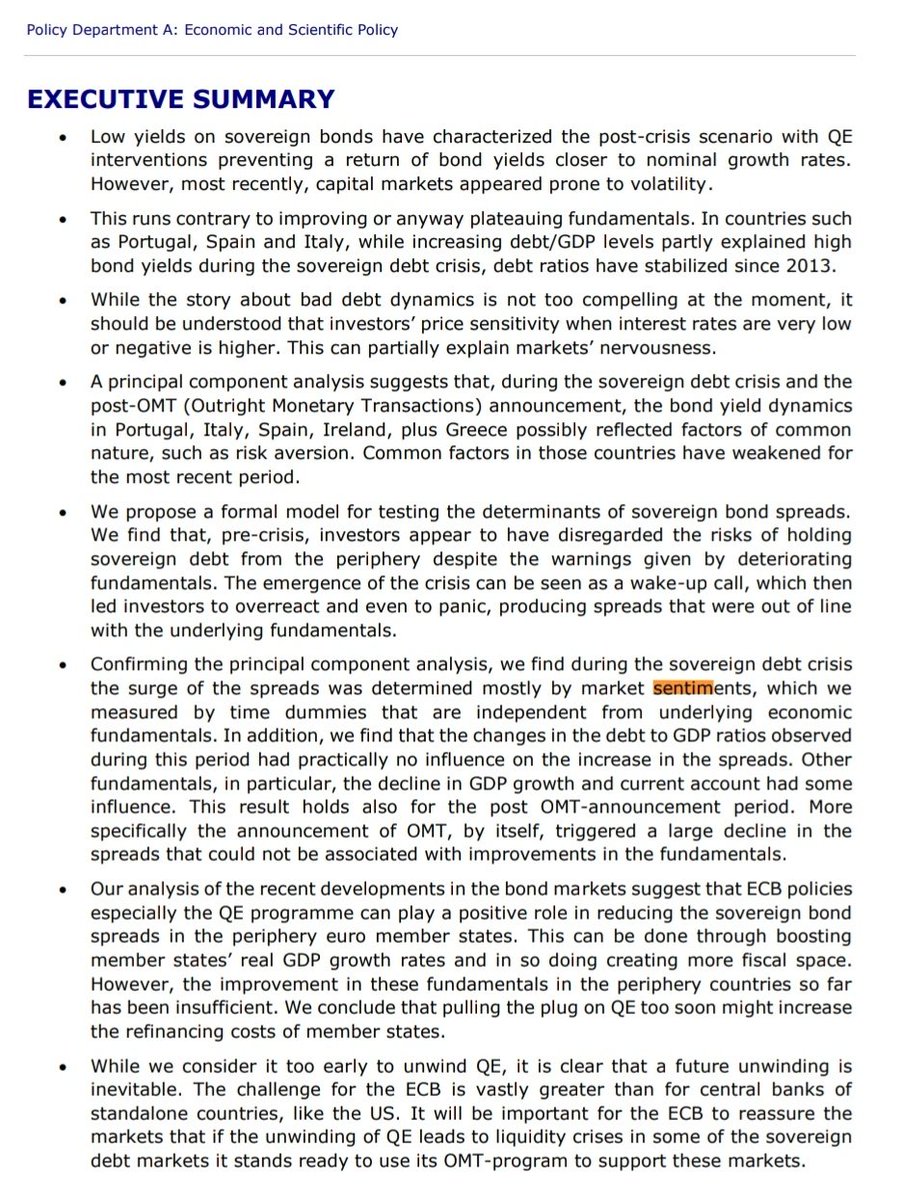
In theory, bond yields should reflect the actual risk of a country defaulting. But research by @pdegrauwe et al. shows that they are driven mostly by (erratic) "market sentiments" rather than fundamentals.
https://www.google.com/url?sa=t&source=web&rct=j&url=http://www.europarl.europa.eu/RegData/etudes/IDAN/2017/602049/IPOL_IDA(2017)602049_EN.pdf&ved=2ahUKEwjgjcCx4d7oAhWO-6QKHdqmAUcQFjAAegQIGhAB&usg=AOvVaw3k2xJP9FnSfWv1hmXitYG7">https://www.google.com/url...
https://www.google.com/url?sa=t&source=web&rct=j&url=http://www.europarl.europa.eu/RegData/etudes/IDAN/2017/602049/IPOL_IDA(2017)602049_EN.pdf&ved=2ahUKEwjgjcCx4d7oAhWO-6QKHdqmAUcQFjAAegQIGhAB&usg=AOvVaw3k2xJP9FnSfWv1hmXitYG7">https://www.google.com/url...
And anyway, defaults nowadays almost never happen: countries always pay their creditors. In his excellent book, @JeromeRoos shows that total share of world public debt in a state of default was 0.2 (!) percent. 99.8% of it was paid back! https://press.princeton.edu/books/ebook/9780691184937/why-not-default">https://press.princeton.edu/books/ebo...
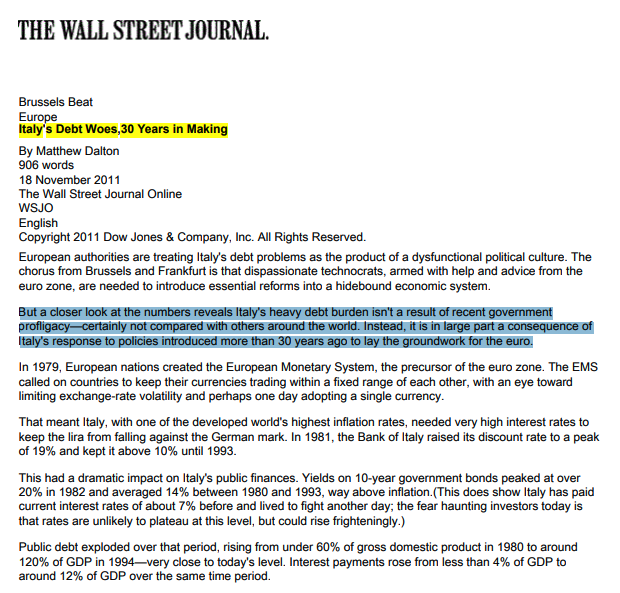
Even the Wall Street Journal - not exactly a Marxist-leninist publication - acknowledges that fiscal profligacy in recent years is not the cause of Italy& #39;s debt problem, but an interplay of policies that went terribly wrong 40 years ago.
One way to see that the interests different governments have to pay when they borrow is not a good reflection of fundamentals: Dutch and Italian bond yields strongly converged between 2000 and the Eurocrisis, before diverging again...
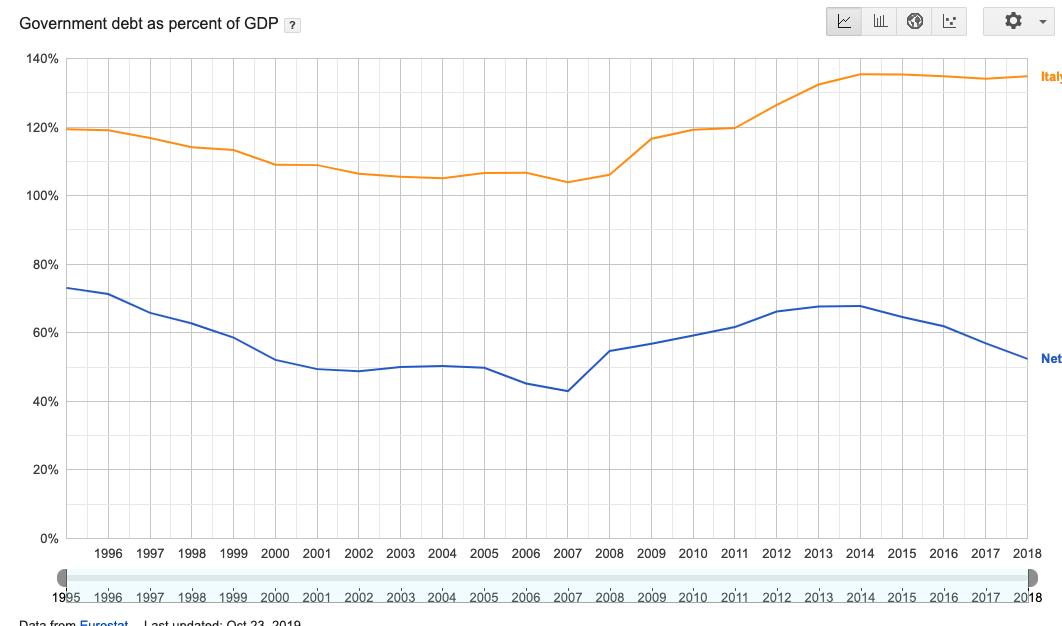
...but the differences in the debt/gdp ratio stayed pretty much the same. What "markets believe" and determines the cost of borrowing is driven by other things, sometimes irrational.
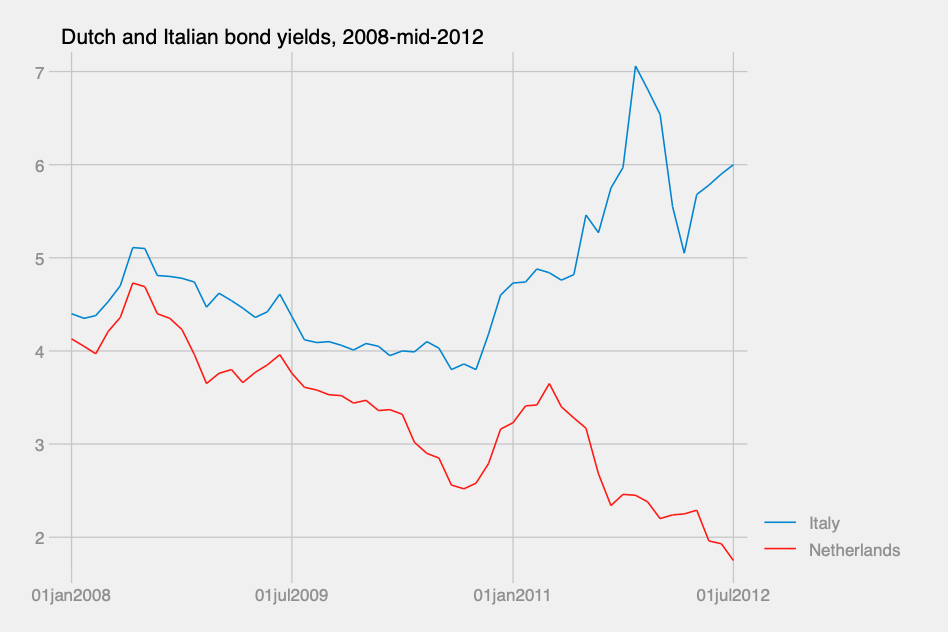
To understand how Dutch borrowing costs went down *because* Italian borrowing costs went up: here is a graph of bond yields between the beginning of the financial crisis in 2008 and Mario Draghi& #39;s "whatever it takes" in mid-2012: almost a mirror image.
This is because of the pattern found by De Grauwe: because money is "trapped" in Euros, capital fled from South (pushing interests up) to North (pushing interests down) within the Eurozone.
I really don& #39;t know what to say. I have lived in Italy. Infrastructure is crumbling. Look at trains, motorways. https://twitter.com/TH_says/status/1248656516267335681">https://twitter.com/TH_says/s...
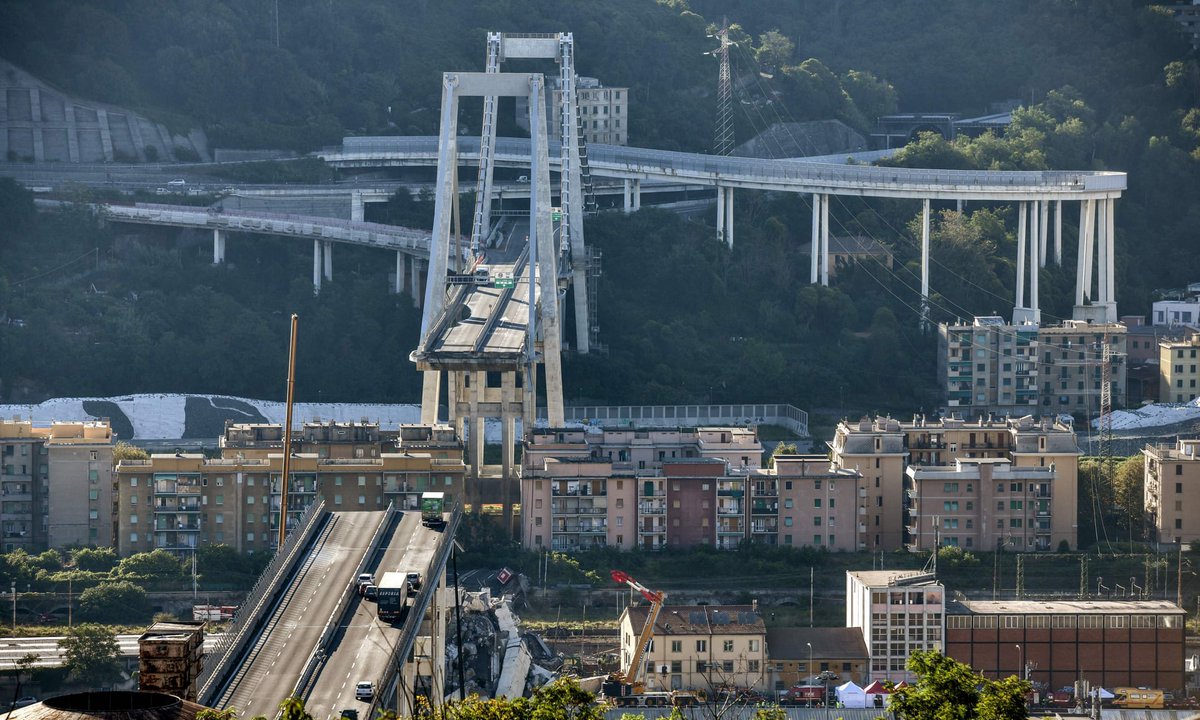
4 days ago, a bridge collapsed. In which other West European country does this kind of thing happen? https://www.bbc.com/news/world-europe-52213898">https://www.bbc.com/news/worl...
Last year another bridge collapsed, killing 43. https://www.theguardian.com/cities/2019/feb/26/what-caused-the-genoa-morandi-bridge-collapse-and-the-end-of-an-italian-national-myth">https://www.theguardian.com/cities/20...
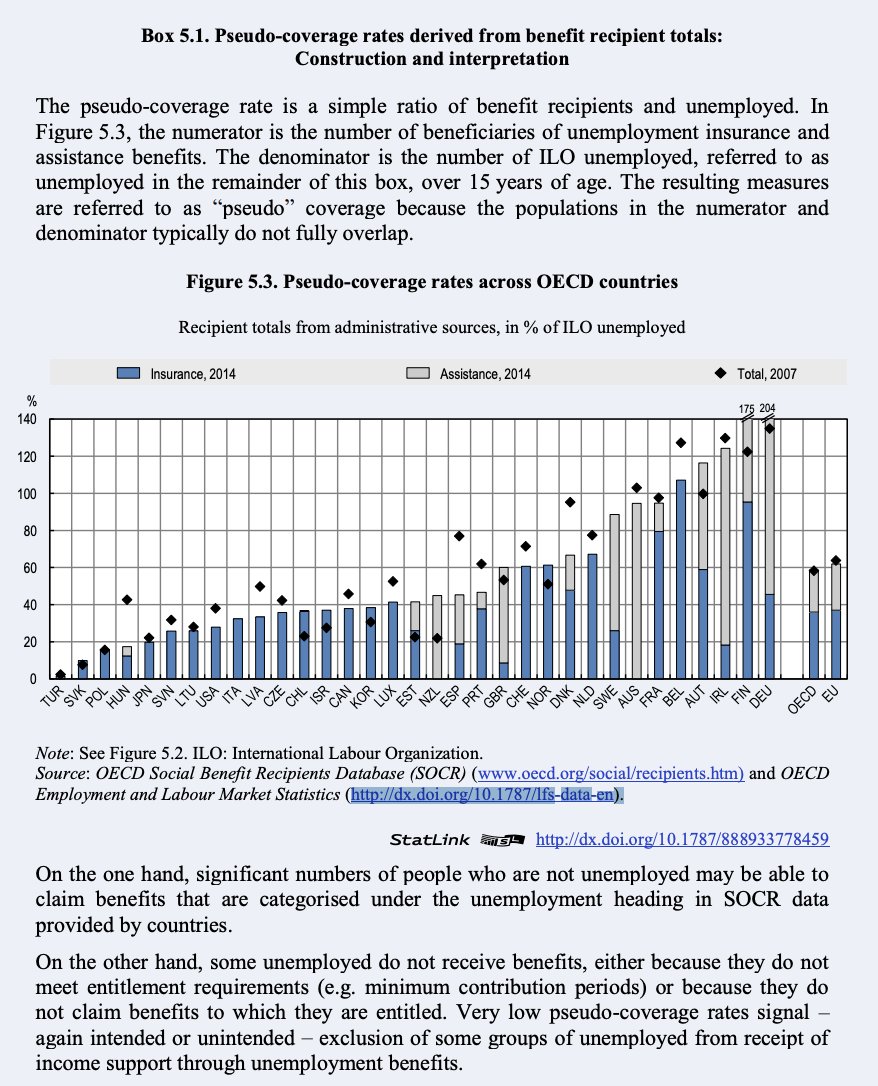
And if you think that Italy should simply tax its informal sector: people in low-wage informal employment may not pay income tax, but also don& #39;t receive social benefits. As a result, the % of unemployed people in Italy who effectively receive unemployment benefits is really low.
Usually people at the lower end of the labour market receive more in benefits than they pay in taxes, and informal employment is mostly low-wage.
Data above is from the OECD employment outlook https://www.oecd-ilibrary.org/employment/oecd-employment-outlook-2018/unemployment-benefit-coverage-recent-trends-and-their-drivers_empl_outlook-2018-9-en">https://www.oecd-ilibrary.org/employmen...
So it& #39;s not really clear that taking in the low-wage informal sector would improve the fiscal situation if you balance the revenue and expenditure side.
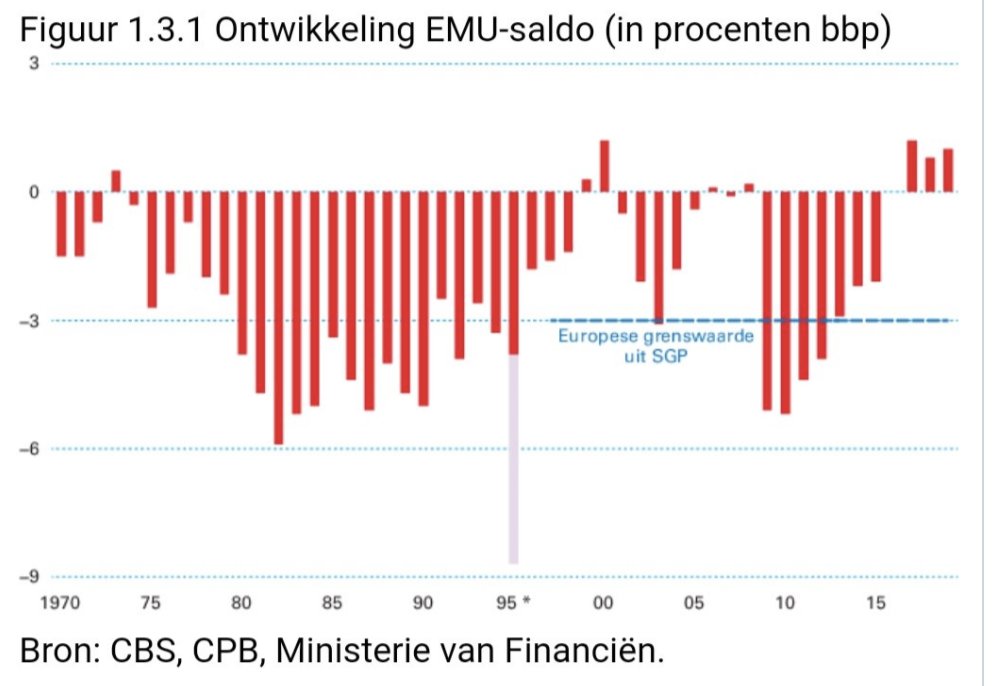
If you go further back in time, Dutch public finances don& #39;t exactly look amazing. http://www.rijksbegroting.nl/2019/voorbereiding/miljoenennota,kst248657_5.html">https://www.rijksbegroting.nl/2019/voor...
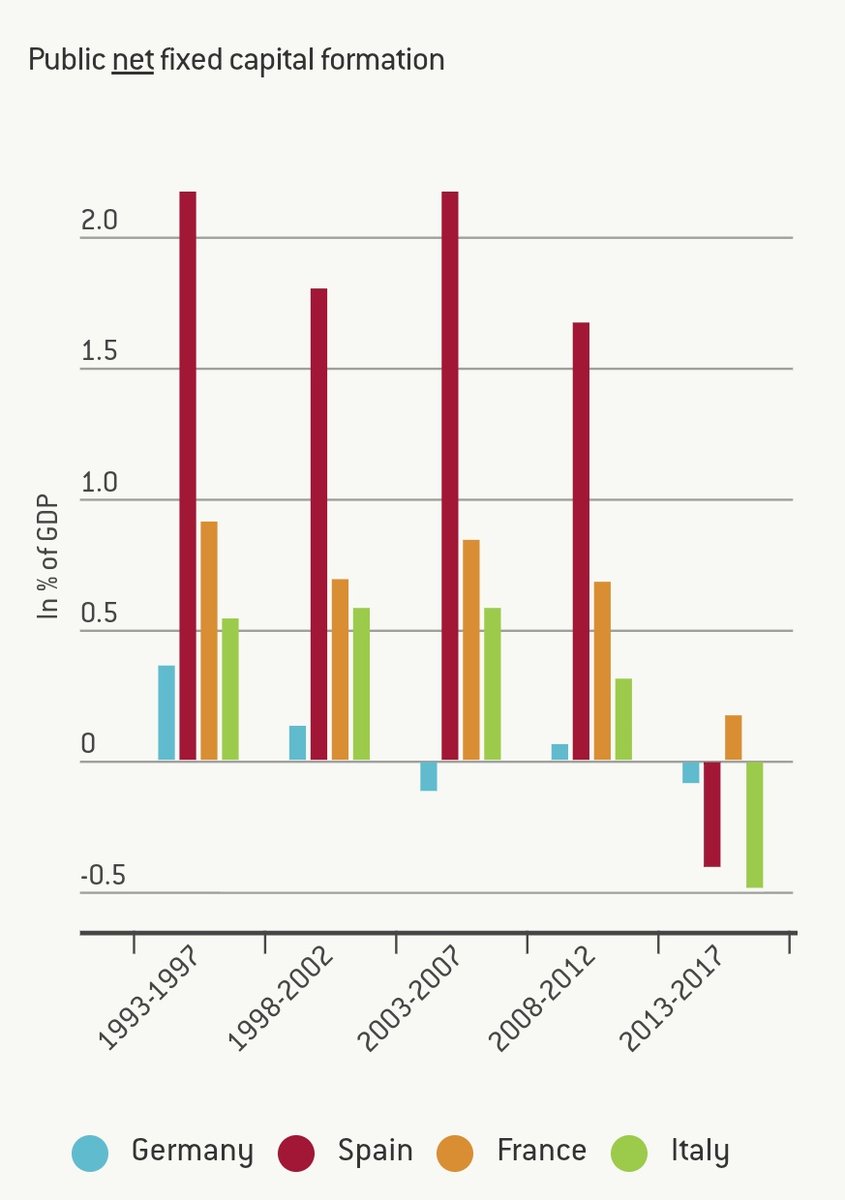
Italy has one of the lowest levels of public investment (in roads, schools, etc.) in the EU. In recent years, it hasn& #39;t even invested enough to compensate for the depreciation of its infrastructure.
https://www.bruegel.org/2018/06/understanding-the-lack-of-german-public-investment/">https://www.bruegel.org/2018/06/u...
https://www.bruegel.org/2018/06/understanding-the-lack-of-german-public-investment/">https://www.bruegel.org/2018/06/u...
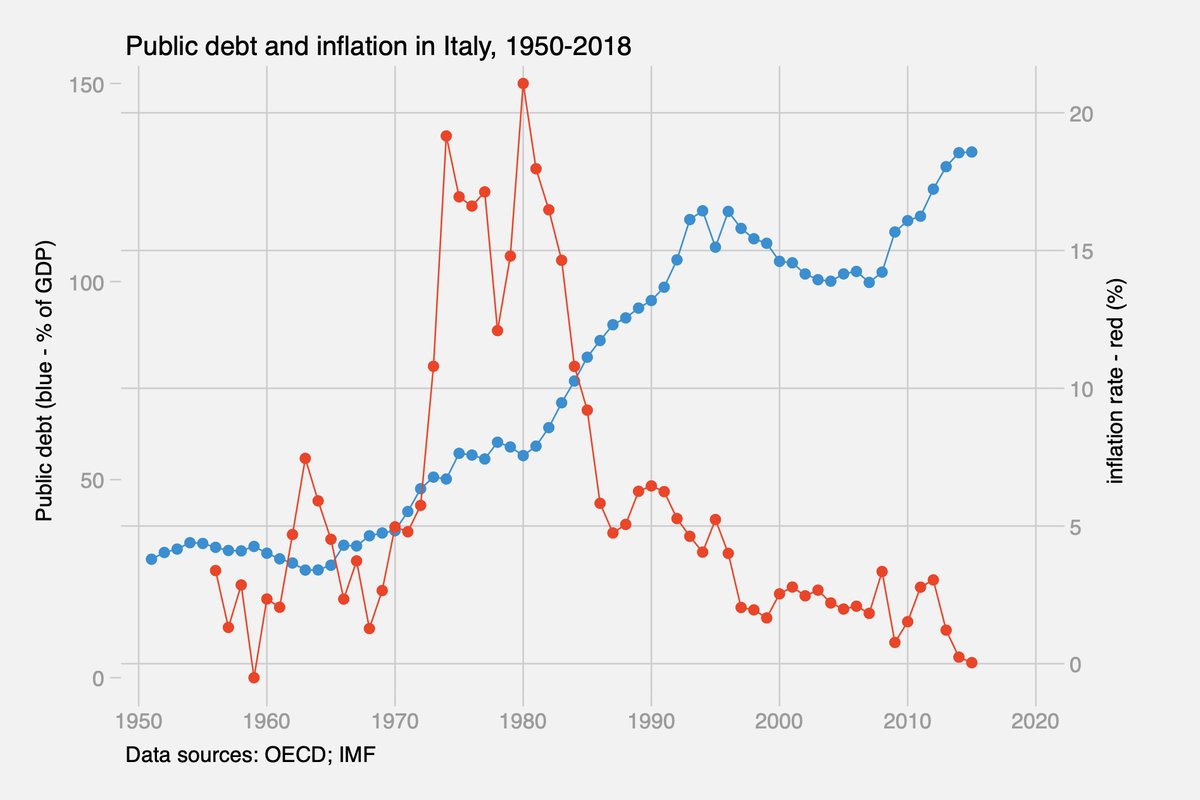
On this graph you can see pretty well what happened in the 1980s in Italy. Inflation was rooted down by high interest rates but the debt-to-gdp ratio doubled.
Italy has carried out lots of reforms in recent years. Not as dramatically as Greece or Portugal under explicit adjustment programs, but quite wide-ranging nevertheless (here in open access): https://ejpr.onlinelibrary.wiley.com/doi/full/10.1111/1475-6765.12317">https://ejpr.onlinelibrary.wiley.com/doi/full/...

 Read on Twitter