1/ THREAD: Time for another set of charts on the real-time economic and market impact of COVID-19, using proprietary data from @Quandl:
2/ Let& #39;s start with e-commerce, where we have first-party data that captures transactions by category and not just by store.
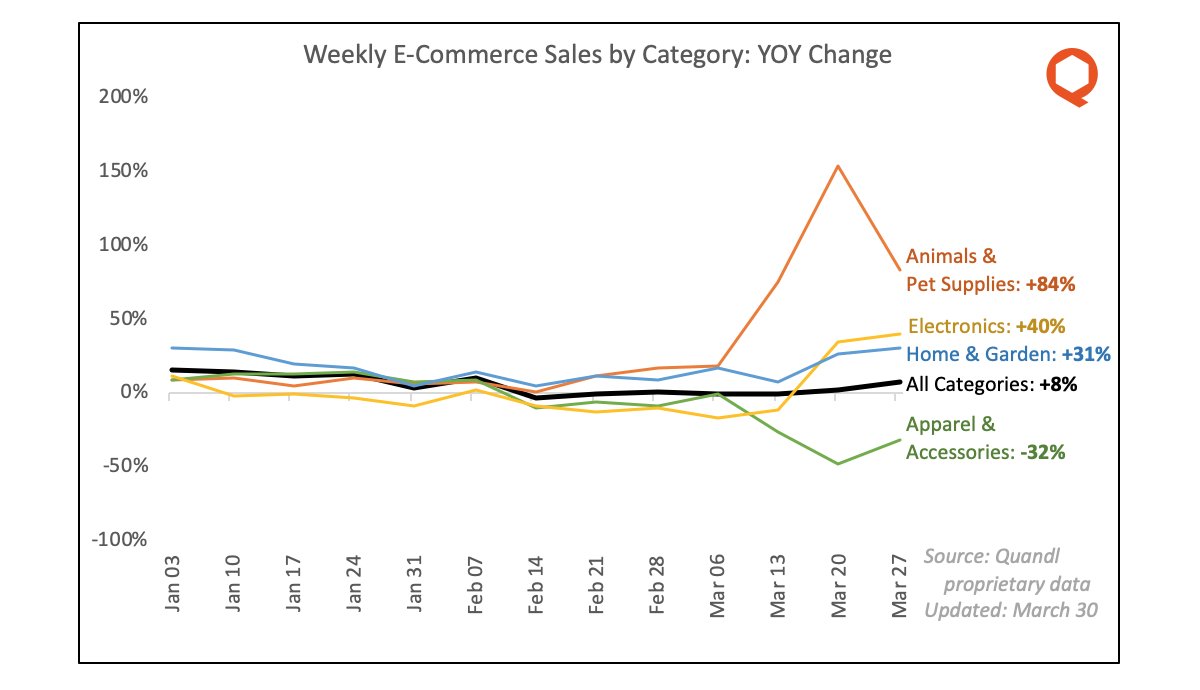
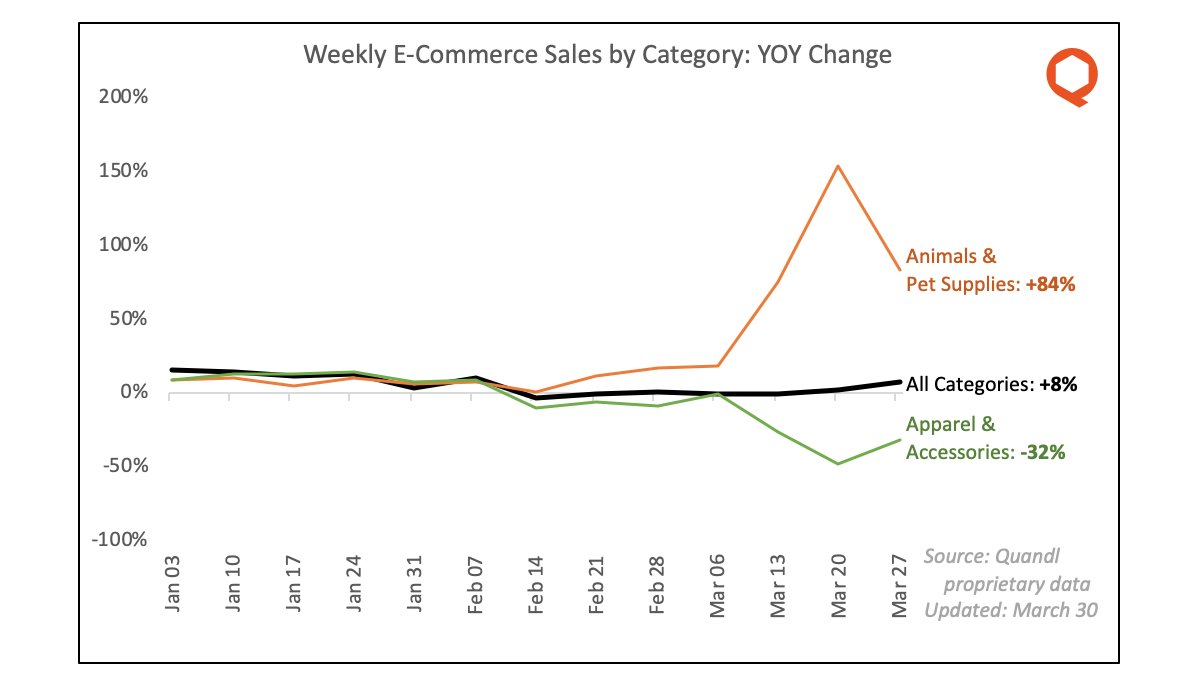
3/ Last week I pointed out a category divergence: animals & pet supplies exploding, apparel & accessories collapsing. That divergence still exists, but has come back a lot from the extremes seen 2 weeks ago; perhaps an early sign of a return to normalcy?
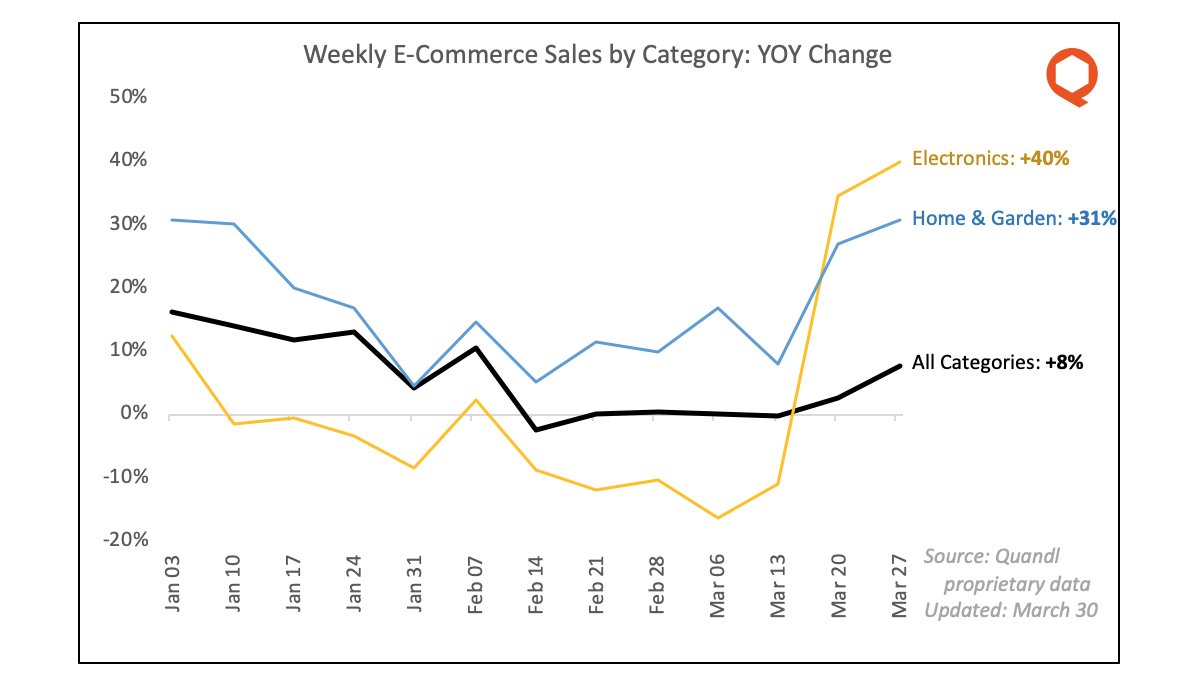
4/ Two other major e-commerce categories doing well are Electronics (+40% YOY) and Home & Garden (+31% YOY). This is almost certainly driven by the replacement of brick-and-mortar sales by online sales.
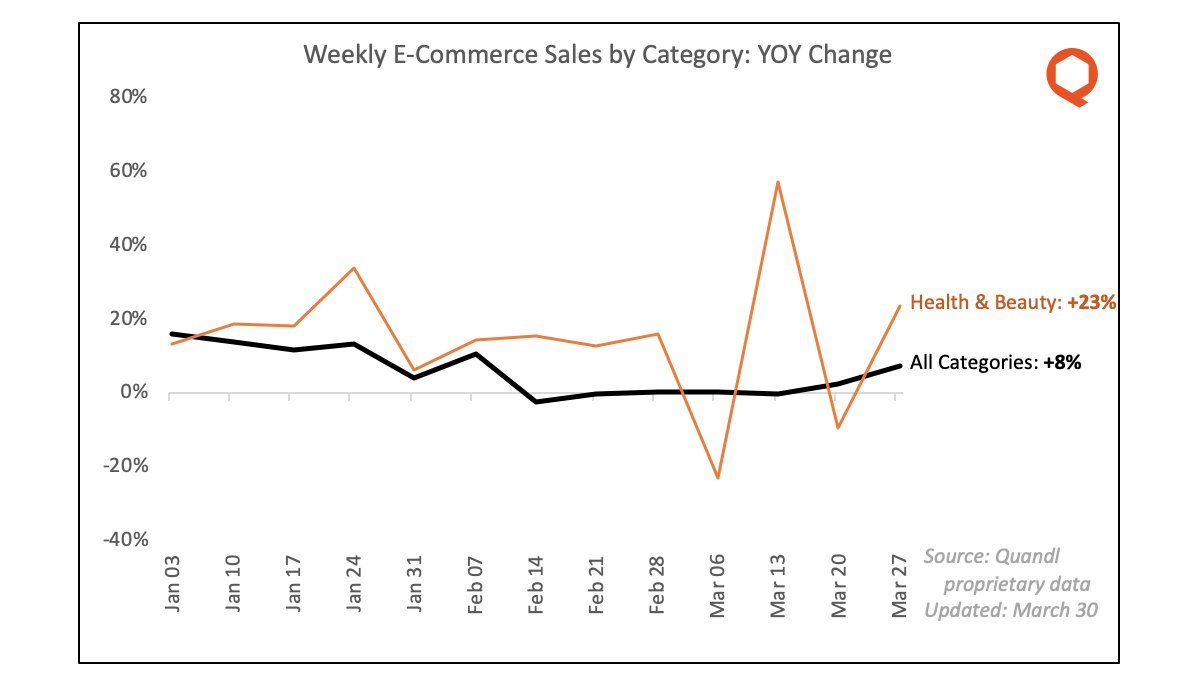
5/ Health & Beauty shows a lot of volatility week to week. We suspect sales of many health products have declined recently due to a lack of inventory, which in turn was perhaps driven by heavy purchasing in early March.
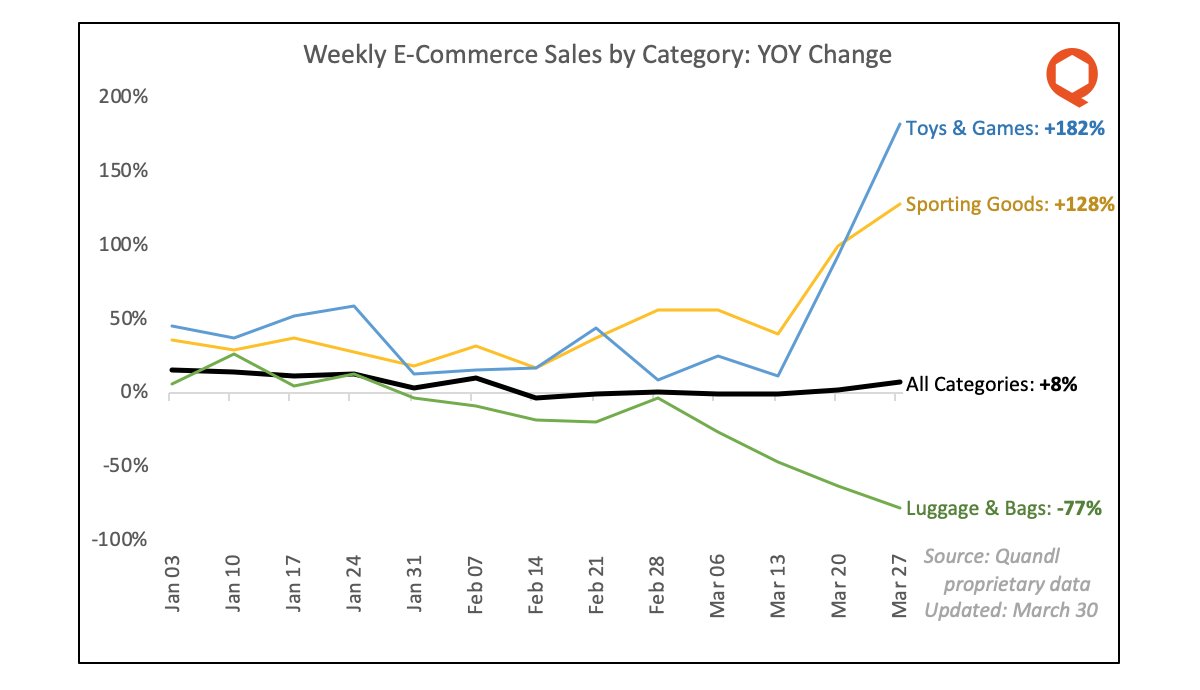
6/ Smaller categories also show divergence. Toys & Games and Sporting Goods (think: exercise equipment!) are both up a lot year-over-year, while Luggage & Bags is down a lot -- both very intuitive observations.
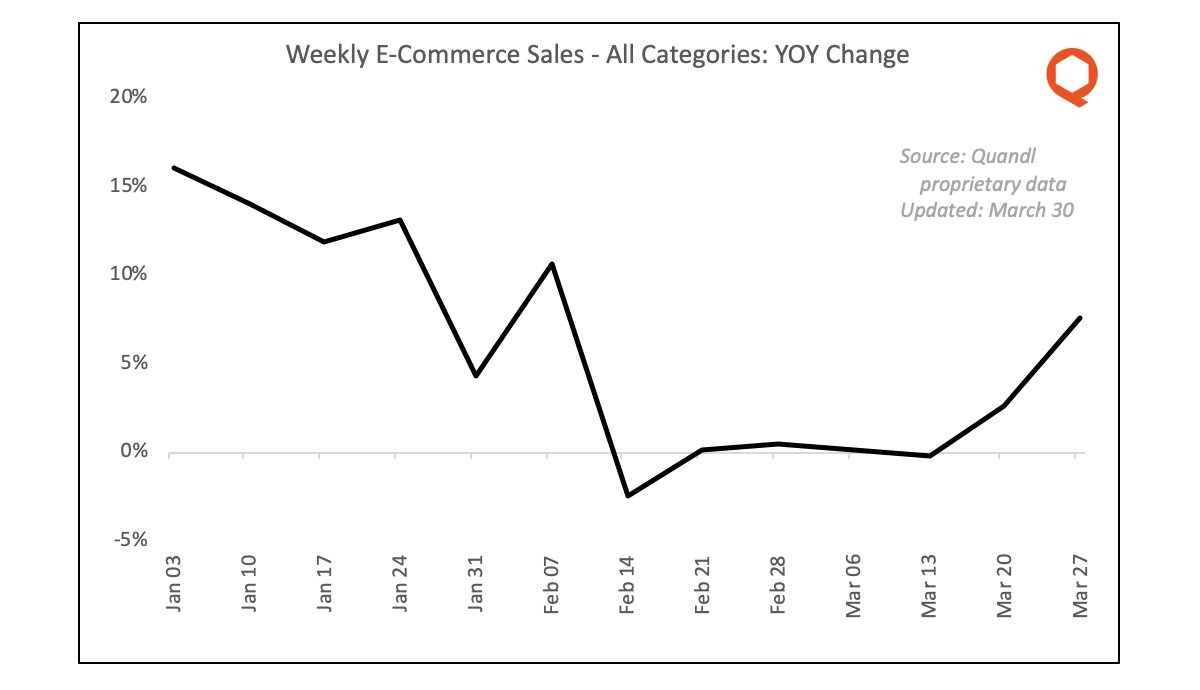
7/ Overall e-commerce sales are recovering -- revenue in the last week of March 2020 was up 8% versus the corresponding week of 2019. This is not quite at the long-term trend line (expected ~20% YOY), but is nonetheless encouraging.
8/ There are also some interesting brand-level stories in e-commerce. For example, a number of cosmetic and luxury apparel names are doing better than I would have expected in a stay-at-home situation.
9/ Conversely, some makers of "pandemic essentials" are not doing as well as I would have thought, perhaps due to inventory issues: there& #39;s terrific demand but no supply and hence no sales.
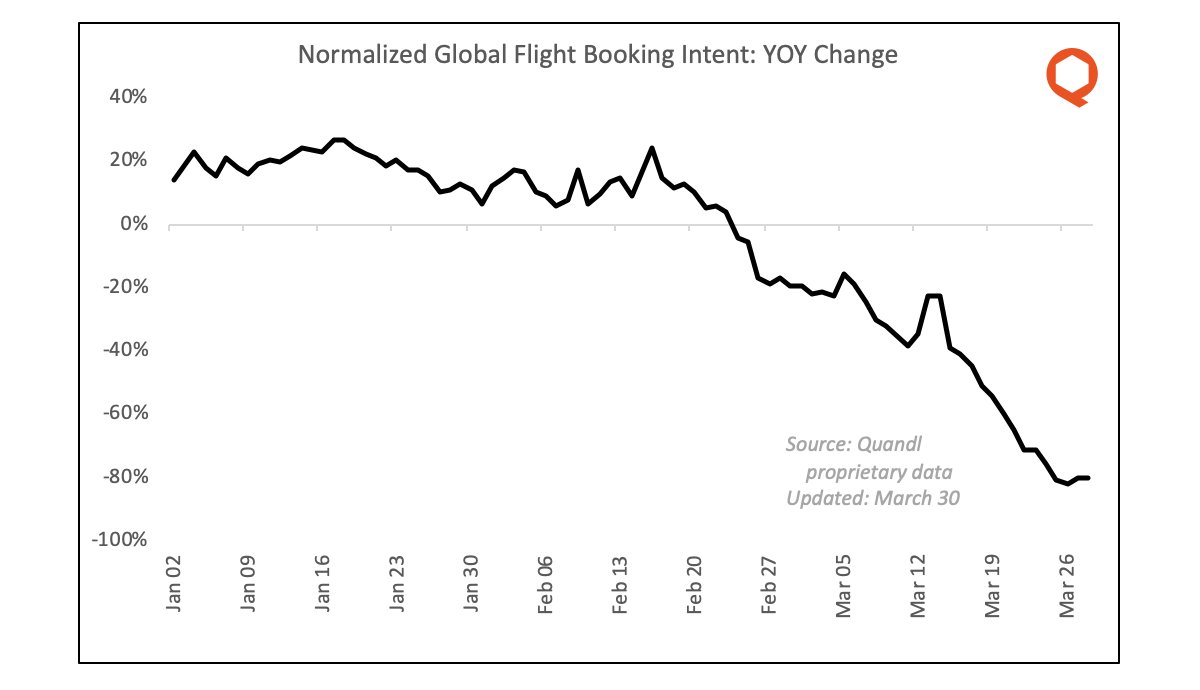
10/ Let& #39;s move on to airlines, where we have another first-party dataset that uses travel intent (searches, clicks, booking page visits) as a very accurate proxy for future passenger counts. Naturally, this has fallen off a cliff.
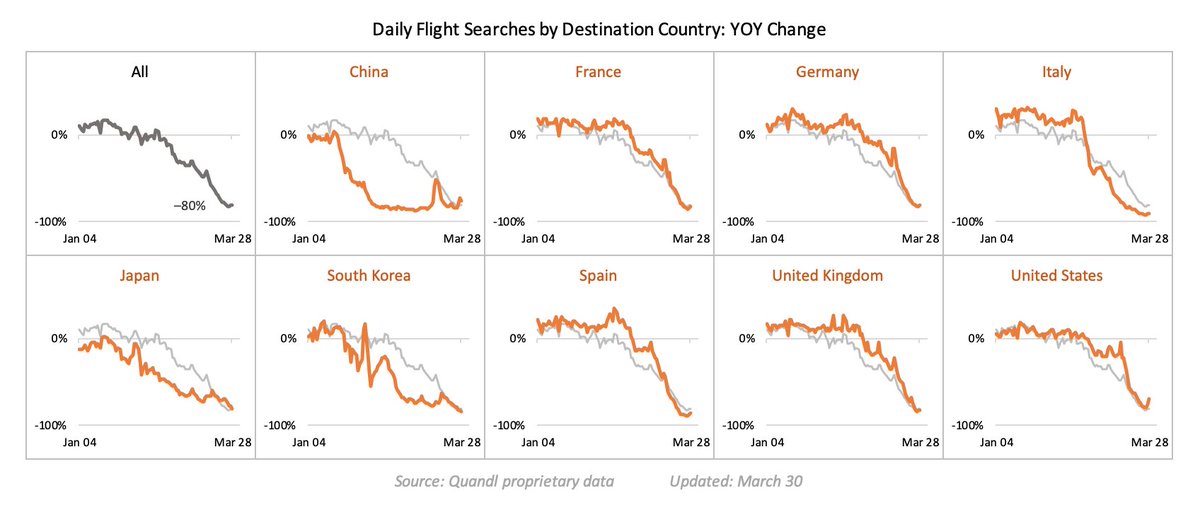
11/ What& #39;s interesting is the pace at which different regions manifest this behaviour. Here& #39;s a chart showing flight booking intent sliced by destination country:
12/ Flights to China fell far before any other country, but there appear to be indications of a rebound. (Remember this is booking *intent*). South Korea and Japan have seen flights drop steadily all year long.
13/ Flights to European destinations (especially Italy and Spain) faced steeper declines that began later in the year, compared with APAC. The United States saw next to no decrease until early March, only dipping late in the month.
14/ The US commercial data is interesting when cross-referenced against Quandl data on private jet flights in the US -- https://twitter.com/athomasq/status/1246227116330561536">https://twitter.com/athomasq/...
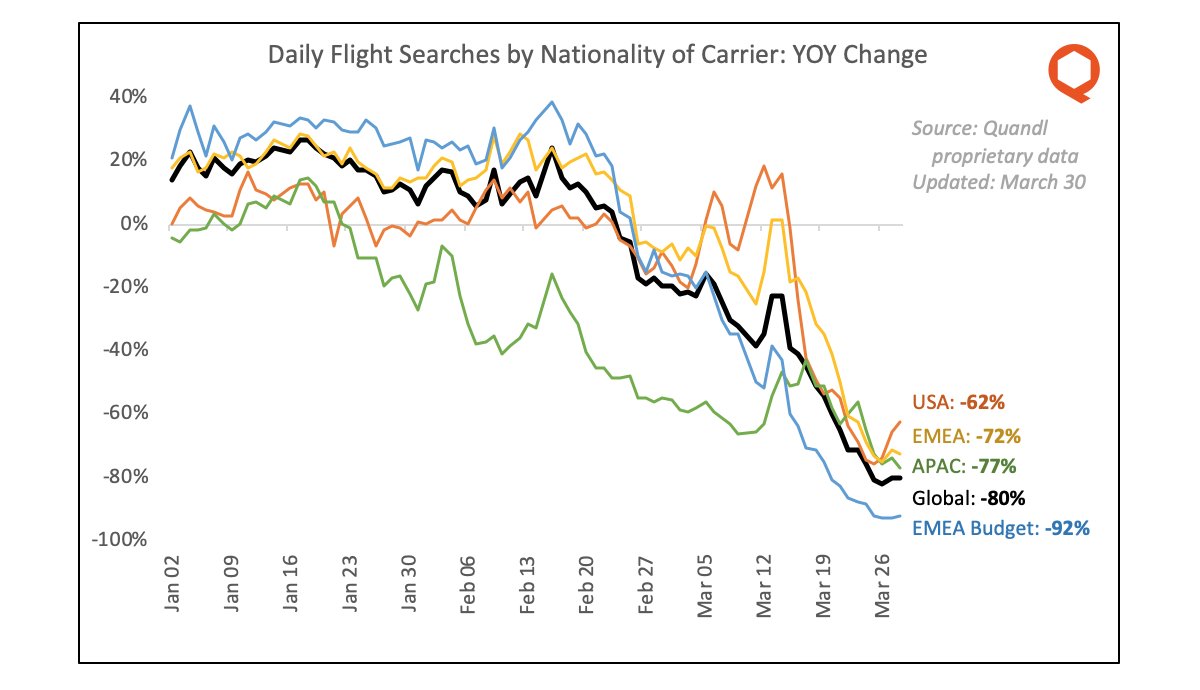
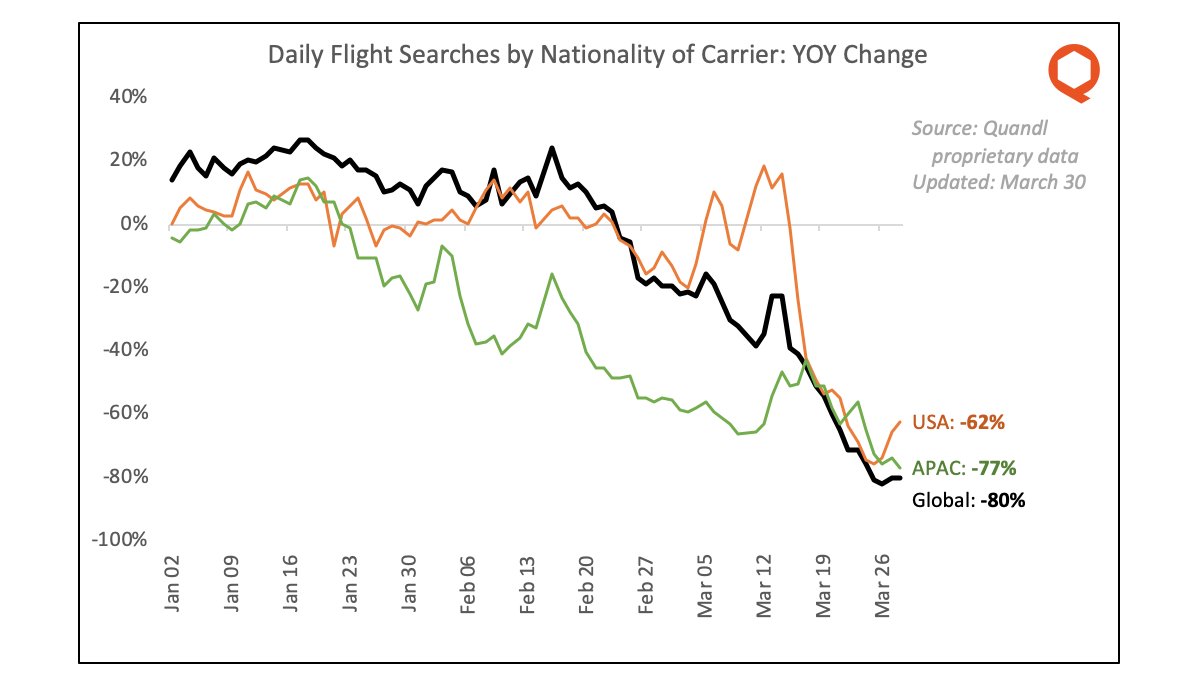
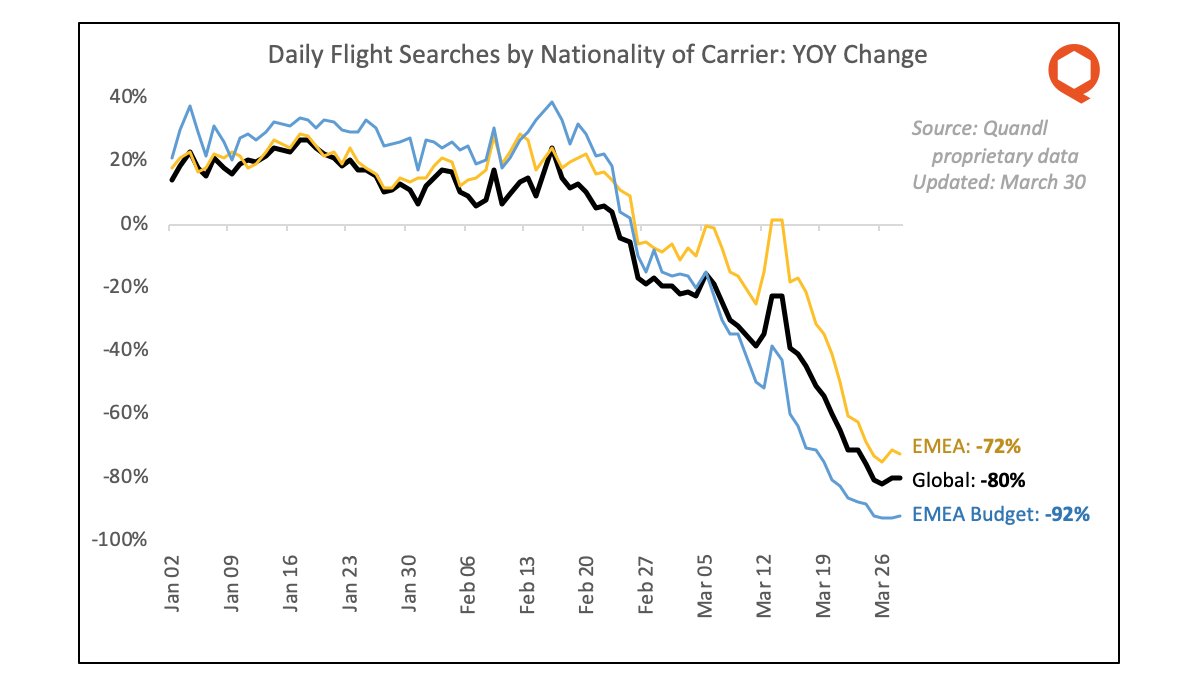
15/ What if we slice air travel intent by nationality of carrier instead of by destination country? Similar patterns emerge.
16/ APAC carriers have been declining steadily all year long; there was a brief bump mid March but we are back at the lows. Flight searches on US carriers stayed amazingly steady till March 15 and then dropped sharply.
17/ EMEA reveals a divergence between budget carriers and full-service. While the timing and shape of the decline has been similar for both categories, the size of the decline is significantly larger for budget carriers in EMEA.
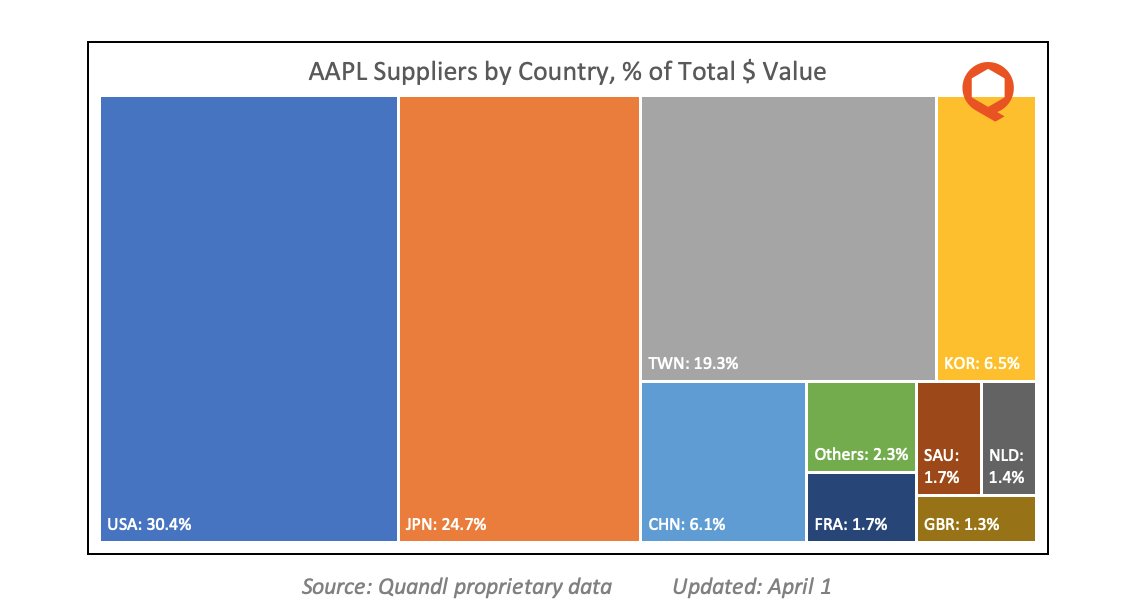
18/ Let& #39;s talk about supply chain! A more detailed analysis covering multiple firms and industries will wait for next week, but for now let& #39;s just focus on a single company, the biggest of them all. How exposed is $AAPL to supply chain disruption?
19/ The answer: not very. Apple has been moving an increasing proportion of its suppliers back to the US in recent years. Japan and Taiwan are also significant, with China and South Korea rounding out the top 5.
20/ These APAC countries are among those that have responded most effectively to the COVID pandemic, suggesting that Apple’s cross-border supply chain is likely to remain relatively robust over the coming months.
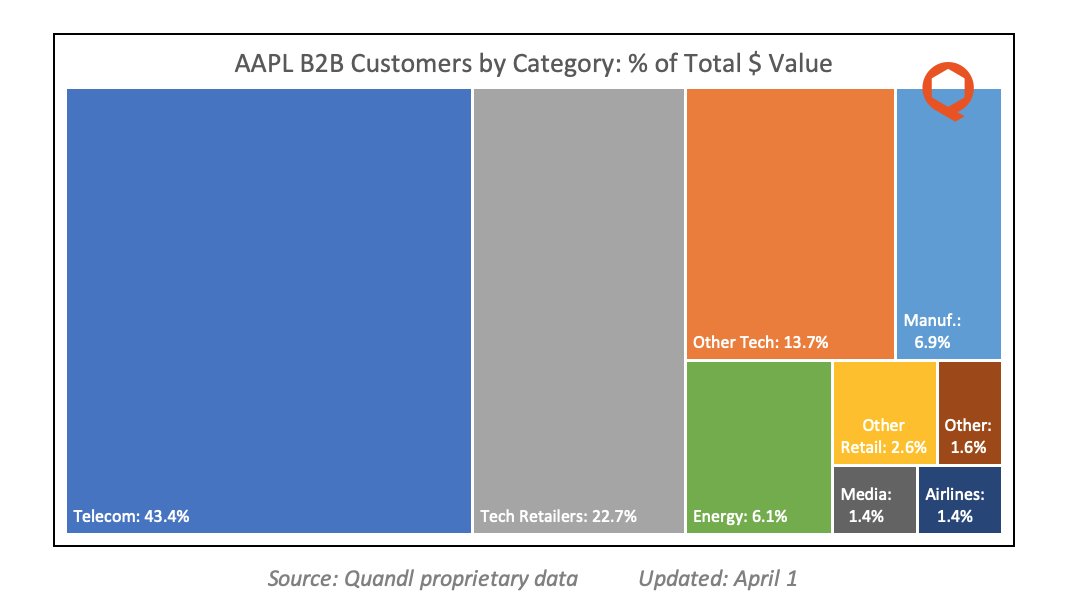
21/ On the other side of the flowchart, how exposed is $AAPL to the health of its B2B customers? Telecom + Tech is ~60% of Apple& #39;s business customer base, while Retail is 25%. Energy, Manufacturing and Airlines also add material amounts.
22/ Many of Apple& #39;s suppliers and customers report their earnings over the next few weeks, at which point these exposures will begin to matter. (More analysis to come on this subject).

 Read on Twitter