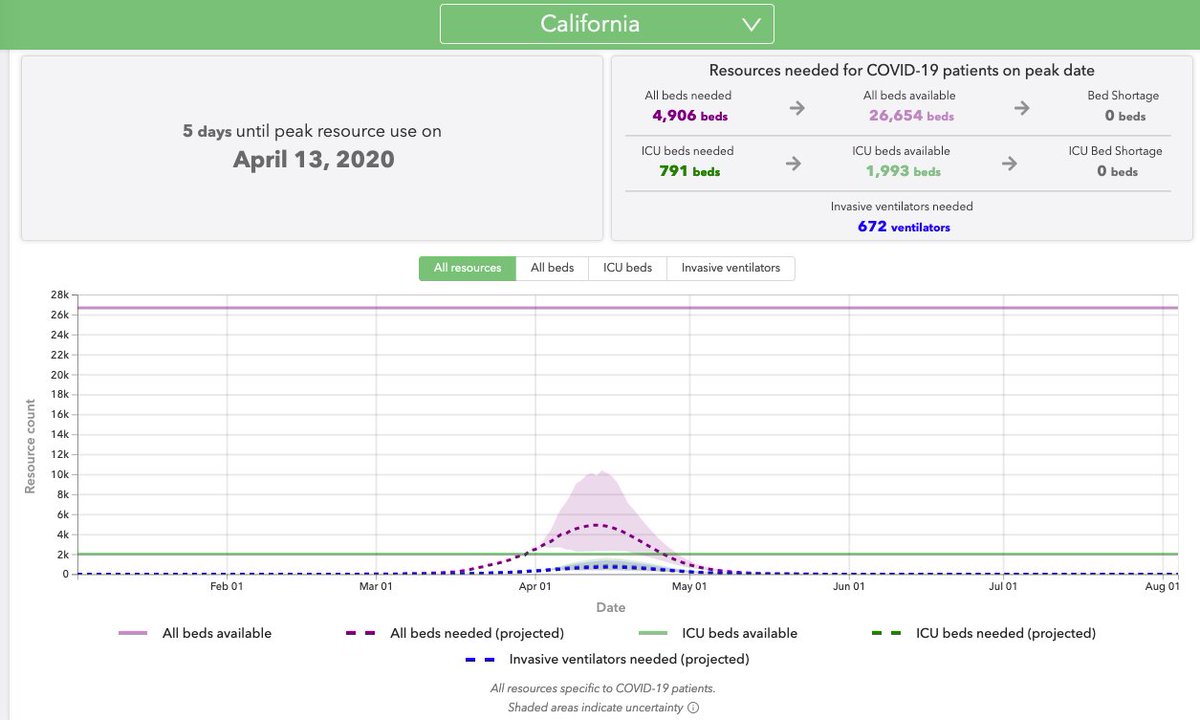
UPDATED DATA:
New modeling suggests that California& #39;s peak will now be on April 13th, and with dramatically lower numbers thanks to significantly flattening of the curve and reducing transmission.
https://covid19.healthdata.org/united-states-of-america/california">https://covid19.healthdata.org/united-st... https://twitter.com/tnicholsmd/status/1245401687600148482">https://twitter.com/tnicholsm...
Based on this new data, New York just passed their peak - expected to be on April 8th - with demand still significantly outstripping resources; however, less than in previous predictive modeling. https://covid19.healthdata.org/united-states-of-america/new-york">https://covid19.healthdata.org/united-st...
Oregon has been impressive with their measures to #FlattenTheCurve and prior predictive models demonstrating that demand would not outstrip available resources in the state; however, the curve is almost completely flat now, with a slight peak on April 22. https://covid19.healthdata.org/united-states-of-america/oregon">https://covid19.healthdata.org/united-st...
The changes in predictive models based on new data, with changes unquestionably due to #PhysicalDistancing measures, are receiving wide spread attention. While there is reason to be optimistic, this news does not support letting up on such measures yet. https://twitter.com/NPRHealth/status/1248178100388560896?s=20">https://twitter.com/NPRHealth...
This bit of good news comes just in time, as we& #39;re seeing that the R0 (transmission rate) might be higher than previously estimated.
Once estimated at 2.0-2.5, this early release (should then be held to higher level of scrutiny) estimates an R0 of 5.7. https://twitter.com/tnicholsmd/status/1248113946747273216?s=20">https://twitter.com/tnicholsm...
Once estimated at 2.0-2.5, this early release (should then be held to higher level of scrutiny) estimates an R0 of 5.7. https://twitter.com/tnicholsmd/status/1248113946747273216?s=20">https://twitter.com/tnicholsm...
Considering the decreased number of infections, hospitalizations, and deaths in updated predictive models after implementation of #PhysicalDistancing orders, a higher R0 than previously estimated could make sense - and demonstrate why such measures are critically important.
California& #39;s curve:

 Read on Twitter


