#DailyUpdate #Covid19India
This is the statistic that we are monitoring most closely - the 5Day Moving Median (average) of new confirmed cases in India. It is showing a plateauing - and hope this trend continues. https://abs.twimg.com/emoji/v2/... draggable="false" alt="🤞" title="Crossed fingers" aria-label="Emoji: Crossed fingers">
This is the statistic that we are monitoring most closely - the 5Day Moving Median (average) of new confirmed cases in India. It is showing a plateauing - and hope this trend continues.
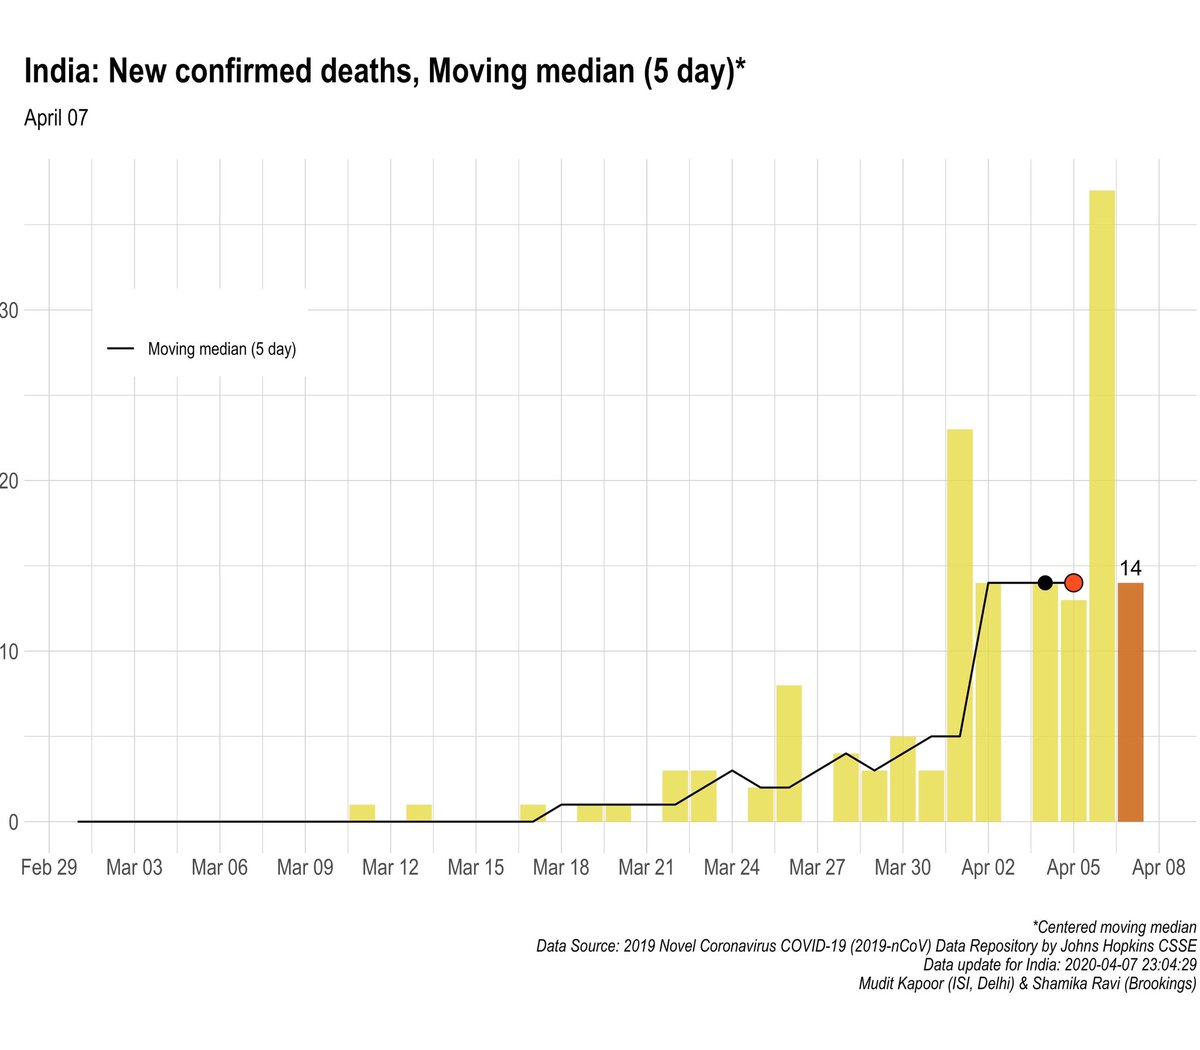
The 5Day Moving Median (average) of new confirmed COVID deaths in India - shows a sign of plateauing. Hope this continues.  https://abs.twimg.com/emoji/v2/... draggable="false" alt="🤞" title="Crossed fingers" aria-label="Emoji: Crossed fingers">
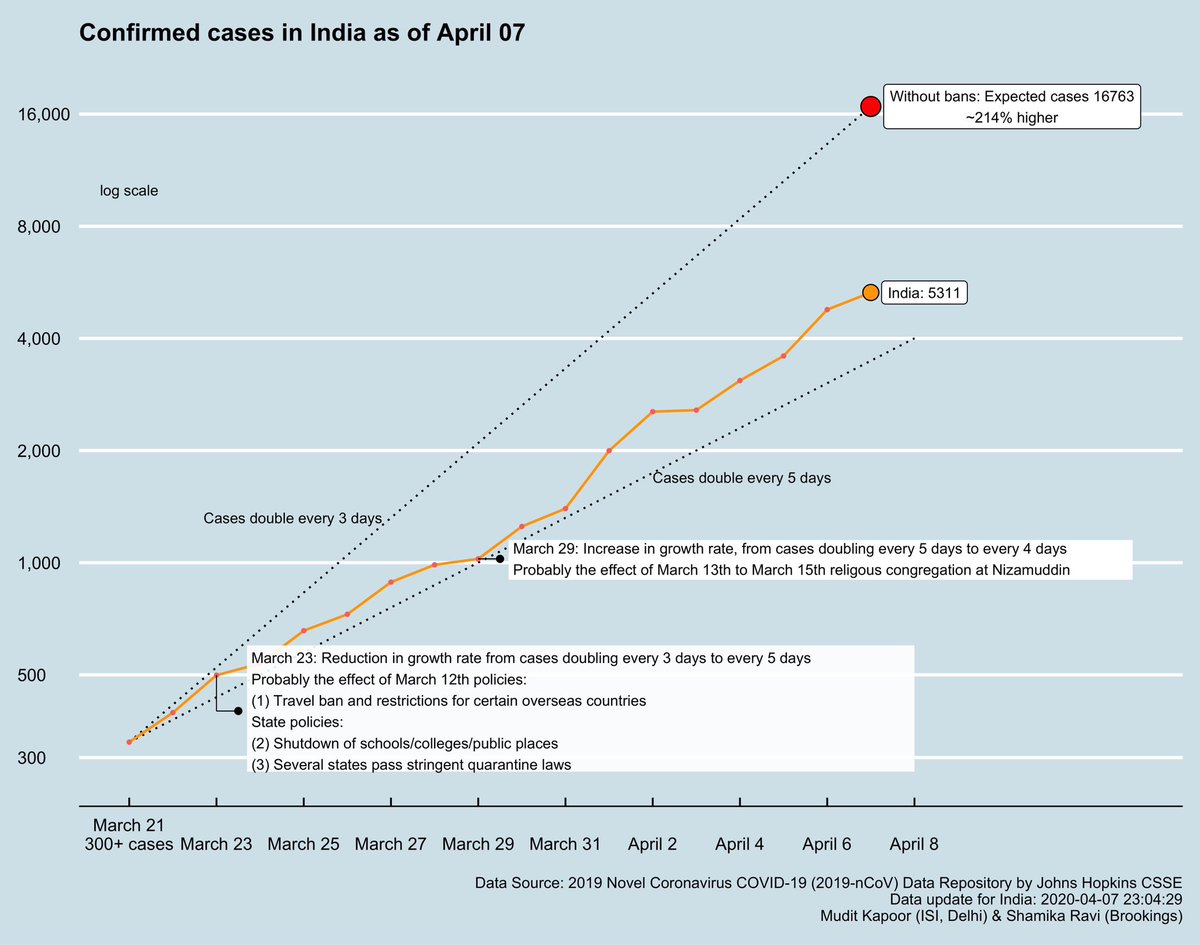
Here’s the trend of total confirmed cases in India. And the trend of active cases in India. Note that without the early advisories, shutdowns and quarantine laws, we would have crossed 16500 yesterday.
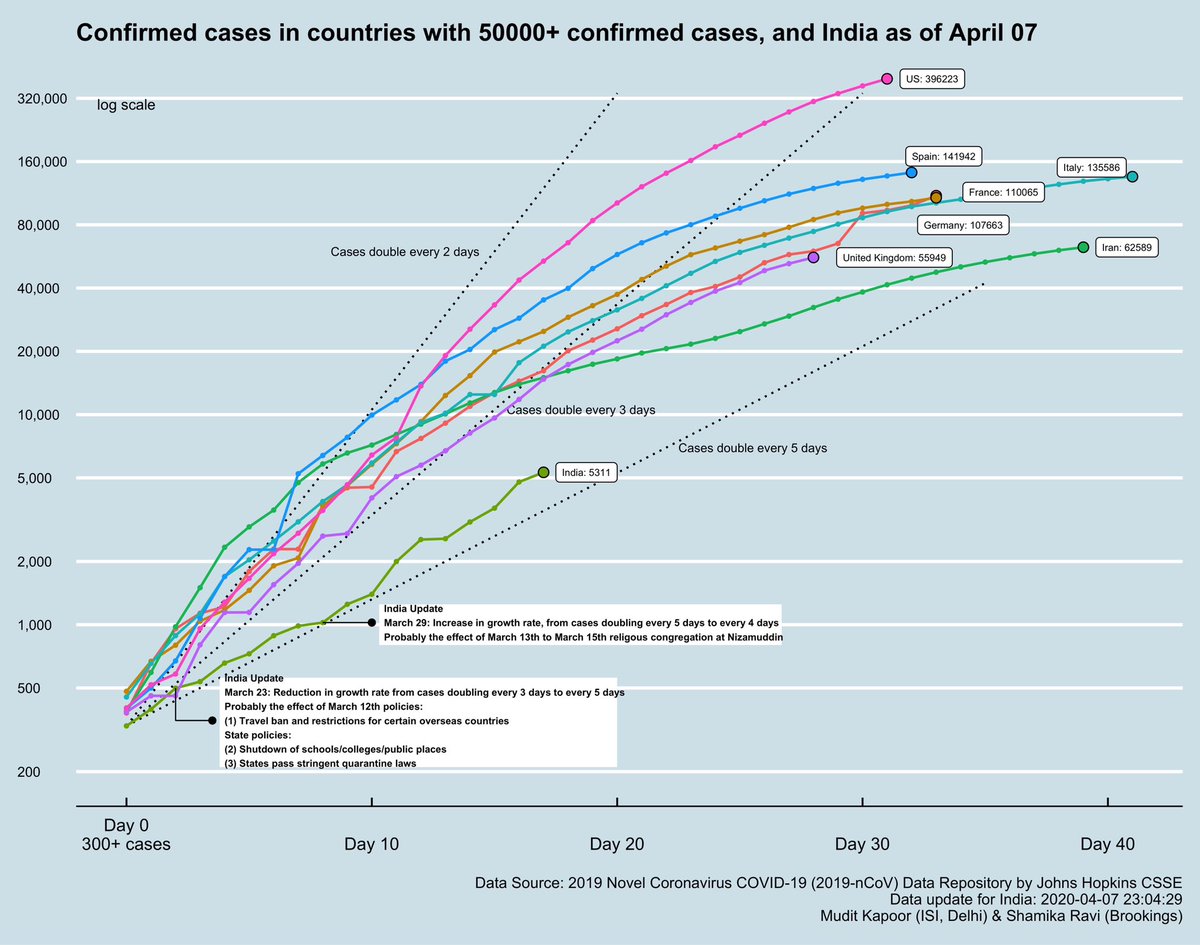
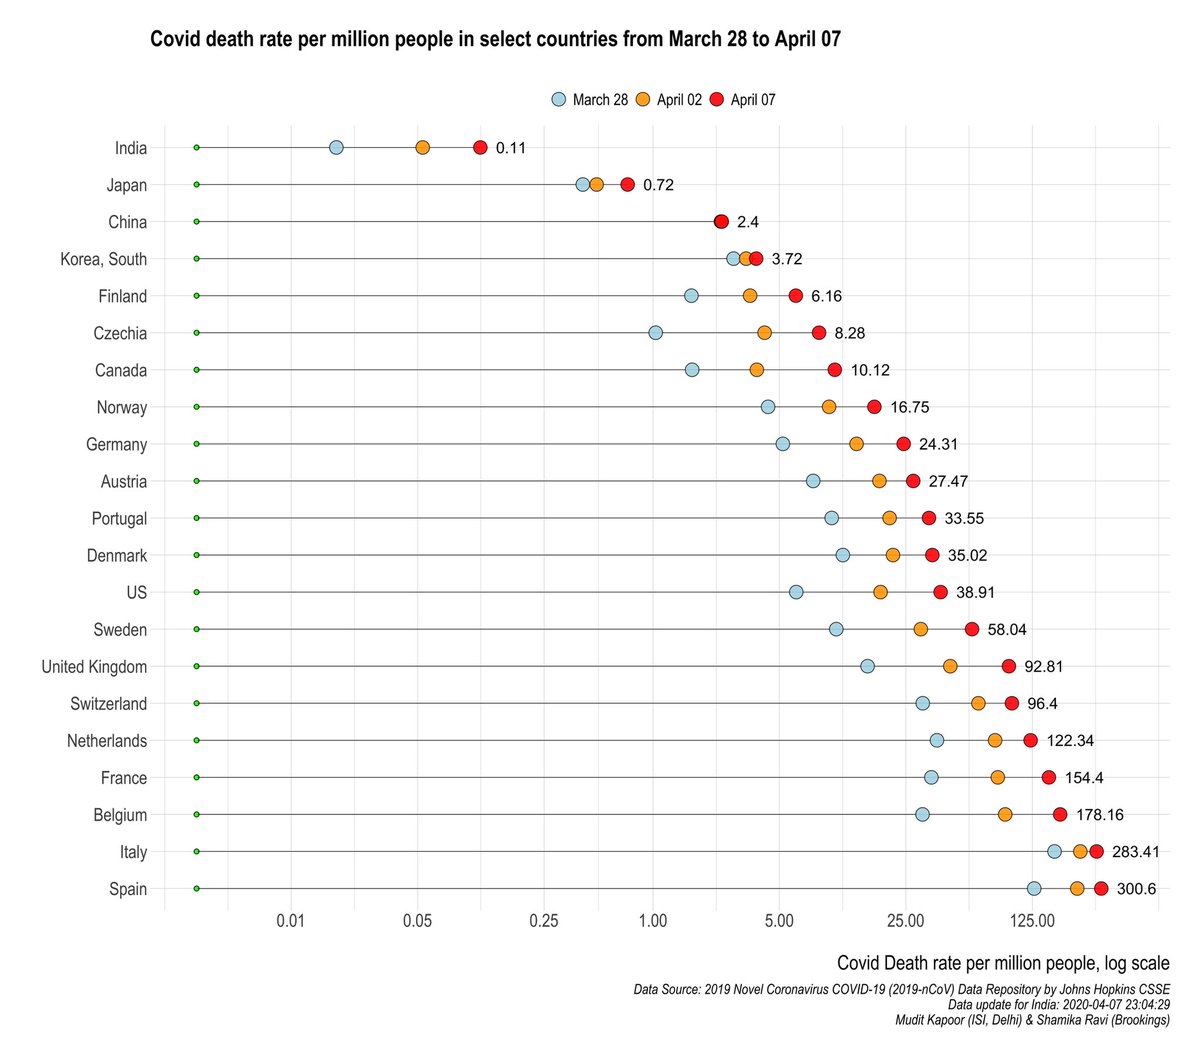
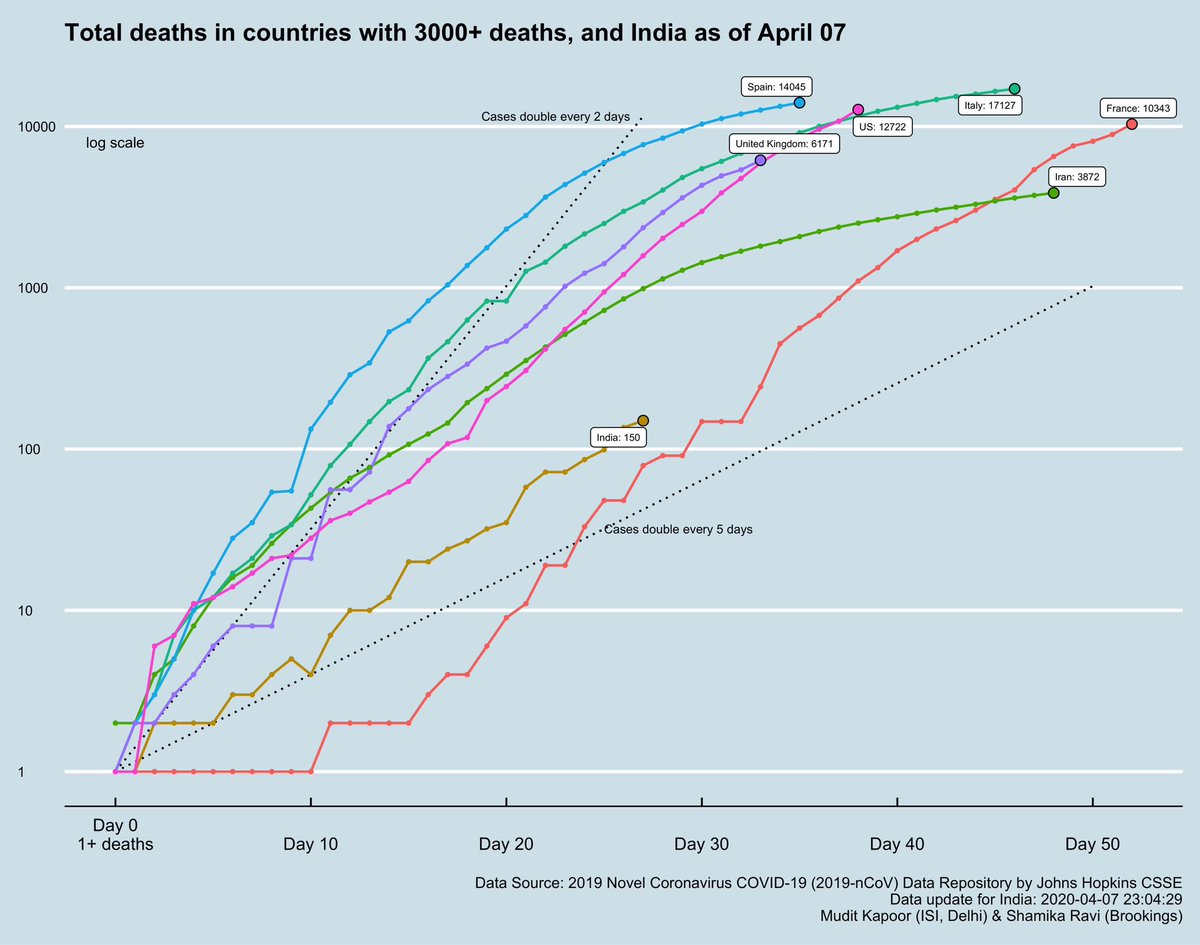
The COVID related death rate per million people ; and the total COVID related deaths in hotspot countries and in India.
The total confirmed cases = total active cases + recovered cases + deaths.
1) UK showing large number of COVID deaths.
2) Japan showing a significant growth in death rate (previous graph) in the last 5 days, after initial stability.
1) UK showing large number of COVID deaths.
2) Japan showing a significant growth in death rate (previous graph) in the last 5 days, after initial stability.
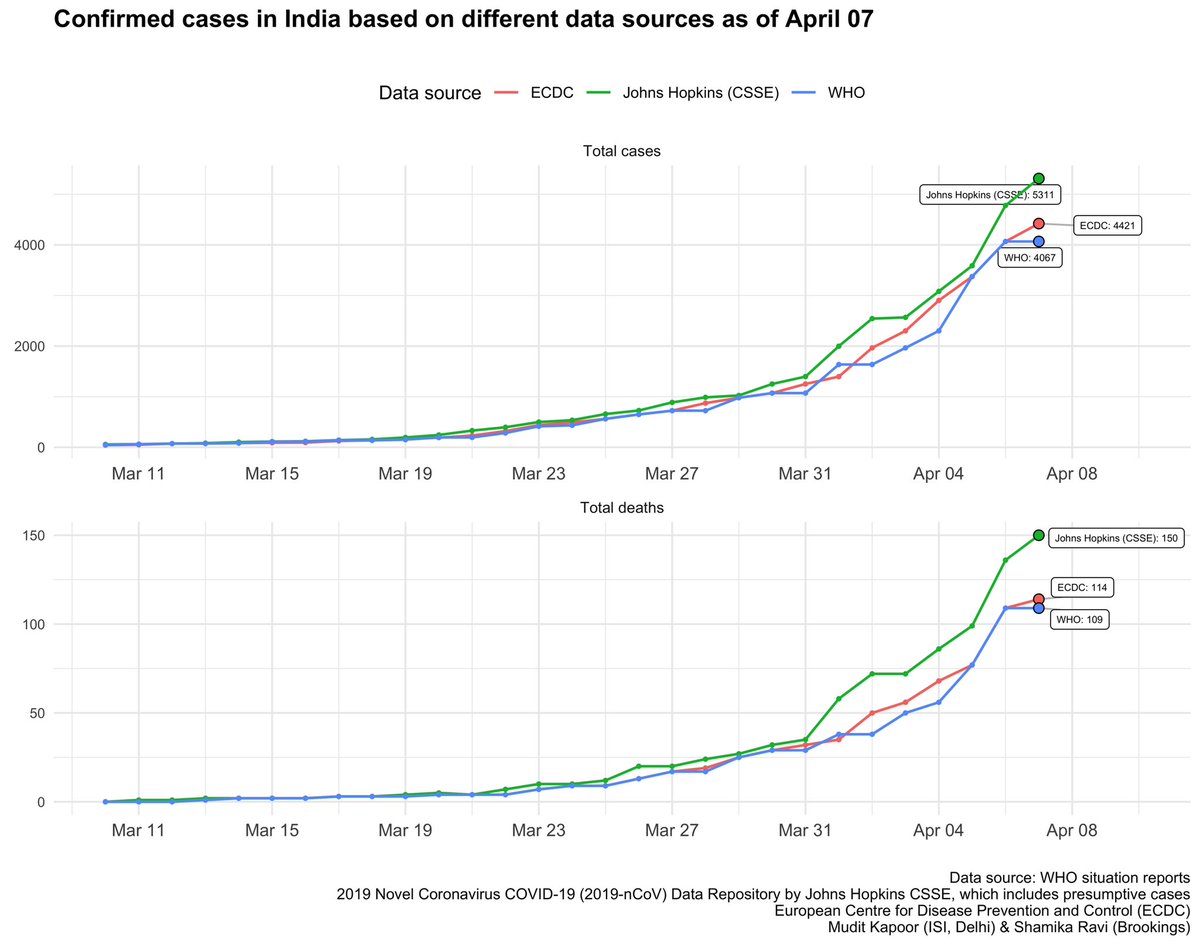
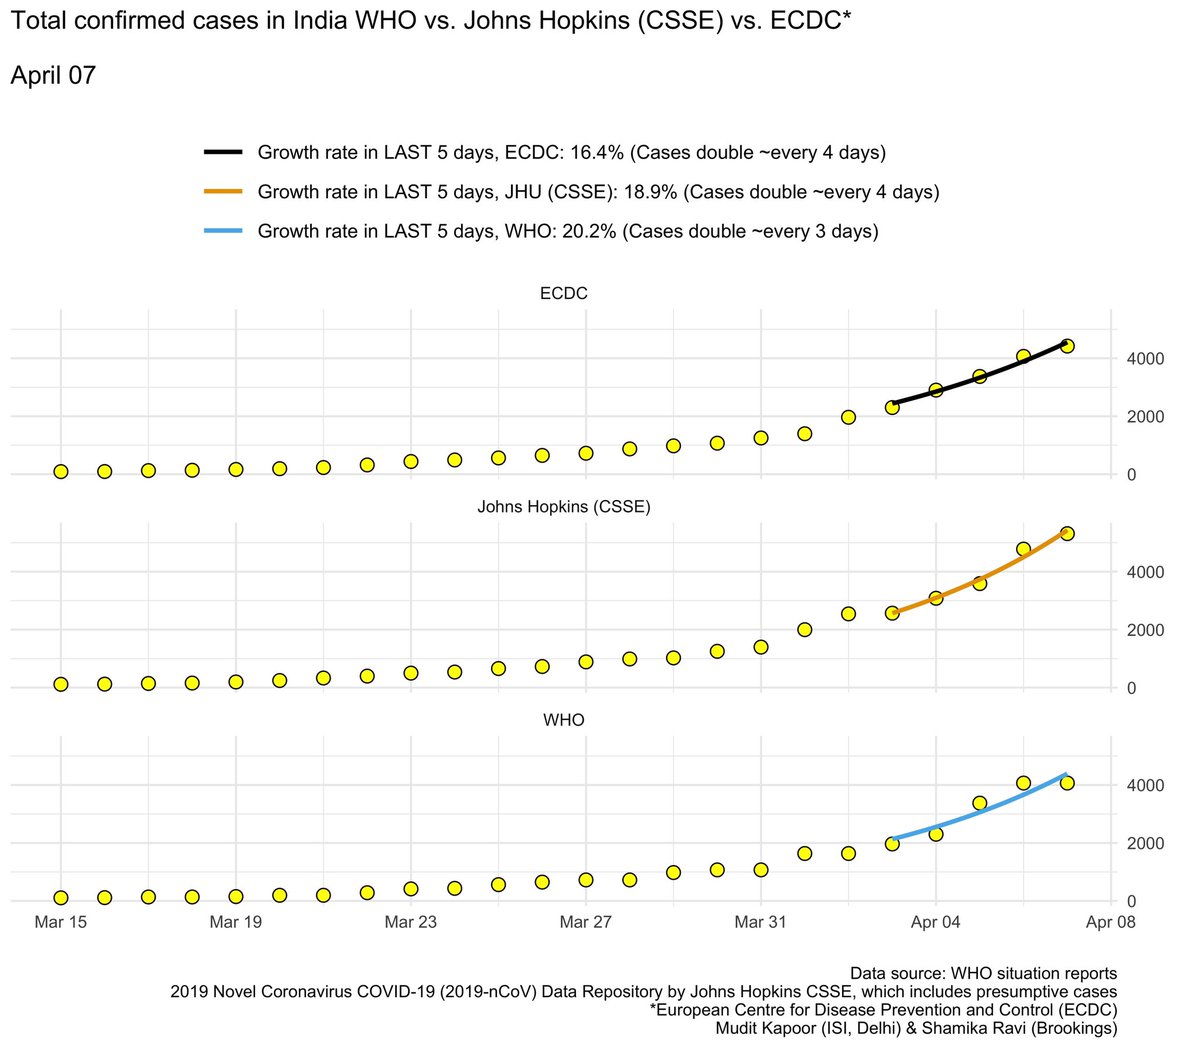
Meanwhile the discrepancies between different data sources continue. @JohnsHopkins @WHO @ECDC_Outbreaks
We should have our own stable/verifiable data sources @PMOIndia .
We should have our own stable/verifiable data sources @PMOIndia .

 Read on Twitter
 " title=" #DailyUpdate #Covid19India This is the statistic that we are monitoring most closely - the 5Day Moving Median (average) of new confirmed cases in India. It is showing a plateauing - and hope this trend continues. https://abs.twimg.com/emoji/v2/... draggable="false" alt="🤞" title="Crossed fingers" aria-label="Emoji: Crossed fingers">" class="img-responsive" style="max-width:100%;"/>
 " title="The 5Day Moving Median (average) of new confirmed COVID deaths in India - shows a sign of plateauing. Hope this continues. https://abs.twimg.com/emoji/v2/... draggable="false" alt="🤞" title="Crossed fingers" aria-label="Emoji: Crossed fingers">" class="img-responsive" style="max-width:100%;"/>
