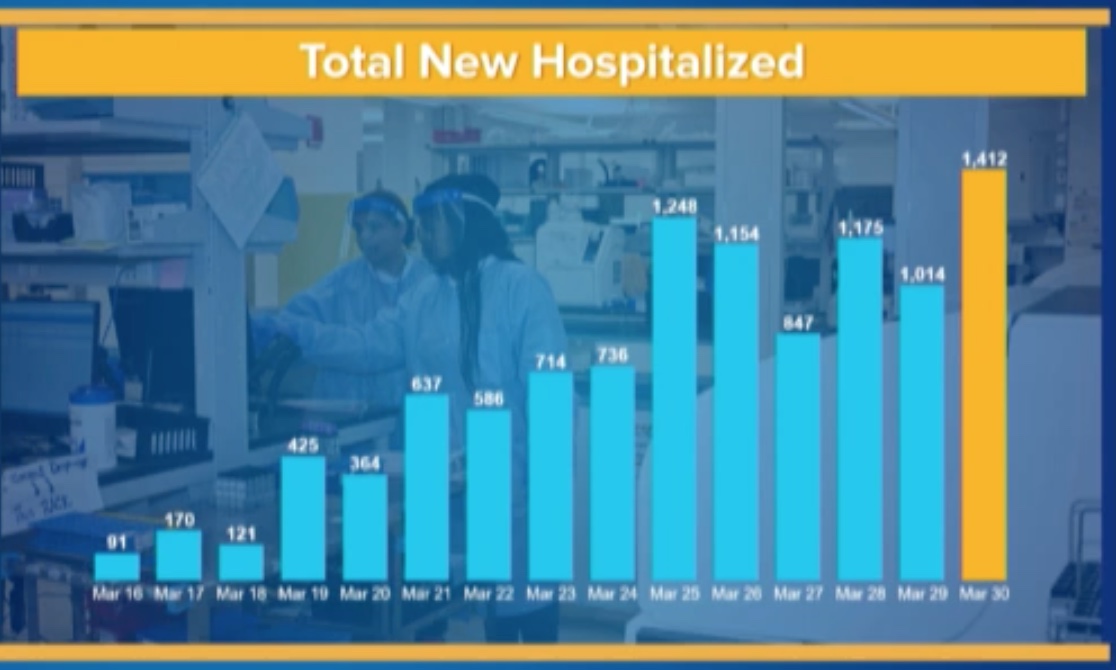
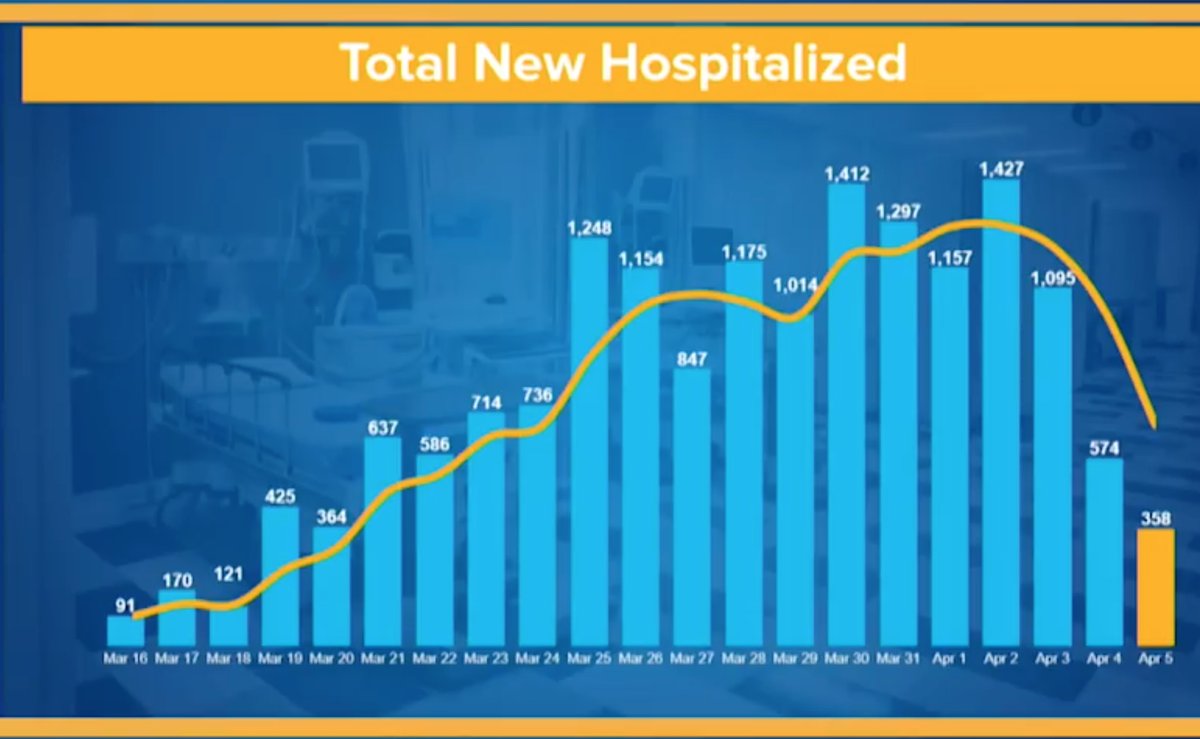
each day, @NYGovCuomo presents data on new #COVID19 hospitalizations across the state. i’ve noticed a couple surprising features in this data which i’d like to mention. here is what was presented on March 31 and April 6, respectively.
each presentation has data right up til the day before. typically, such recent hospital data would be incomplete, so it would update — and hospitalization counts would rise — over time. that doesn’t happen here. the March 30 count doesn’t change from March 31 to April 6.
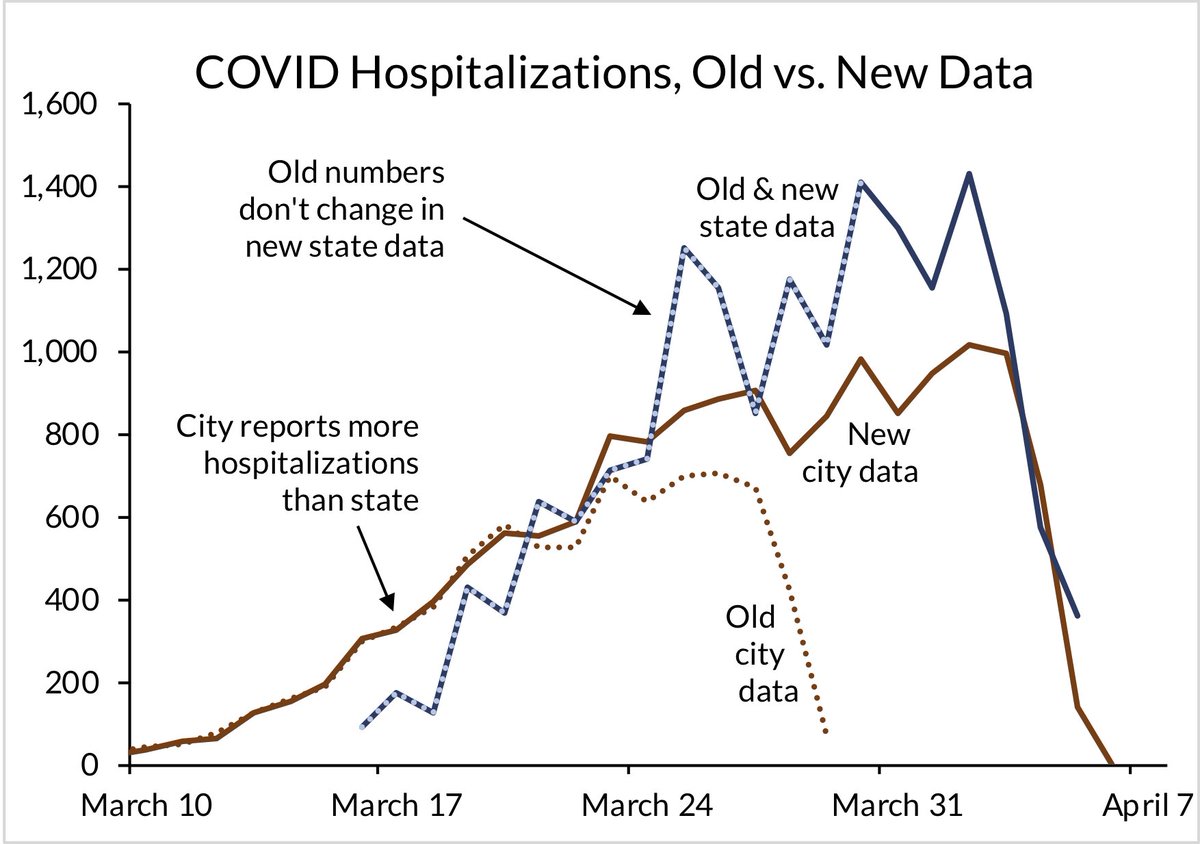
i don’t know why that is, exactly. it’s in contrast to NYC data, for example. the city data on #COVID19 hospitalizations refreshes and updates over time. here’s that data from March 31 and April 6 — data is updated and counts rise in more recent vintages.
so i put the state & city data on the same plot. apparently for much of March, there were more #COVID19 hospitalizations in NY city than NY state. that’s… weird. and the state data never updates.
i don’t know what’s happening here. but someone should figure it out!
i don’t know what’s happening here. but someone should figure it out!
sources:
NY state Mar 31 and Apr 6 briefings: https://www.youtube.com/watch?v=MYAHCAZhSPE">https://www.youtube.com/watch... https://www.youtube.com/watch?v=_KuBr4CgwUA
NY">https://www.youtube.com/watch... city Mar 31 and Apr 6 data: https://github.com/nychealth/coronavirus-data/blob/8460dd7bfdb7b74cf330dc4f260b0e7f6a5e2bb0/case-hosp-death.csv">https://github.com/nychealth... https://github.com/nychealth/coronavirus-data/blob/8cb25d611800b21a703770669606a72daa54e385/case-hosp-death.csv">https://github.com/nychealth...

 Read on Twitter


