#The100DayProject
I’m imagining what a #dataviz designer’s wallpaper would look like throughout the past century. https://abs.twimg.com/emoji/v2/... draggable="false" alt="🤗" title="Hugging face" aria-label="Emoji: Hugging face">
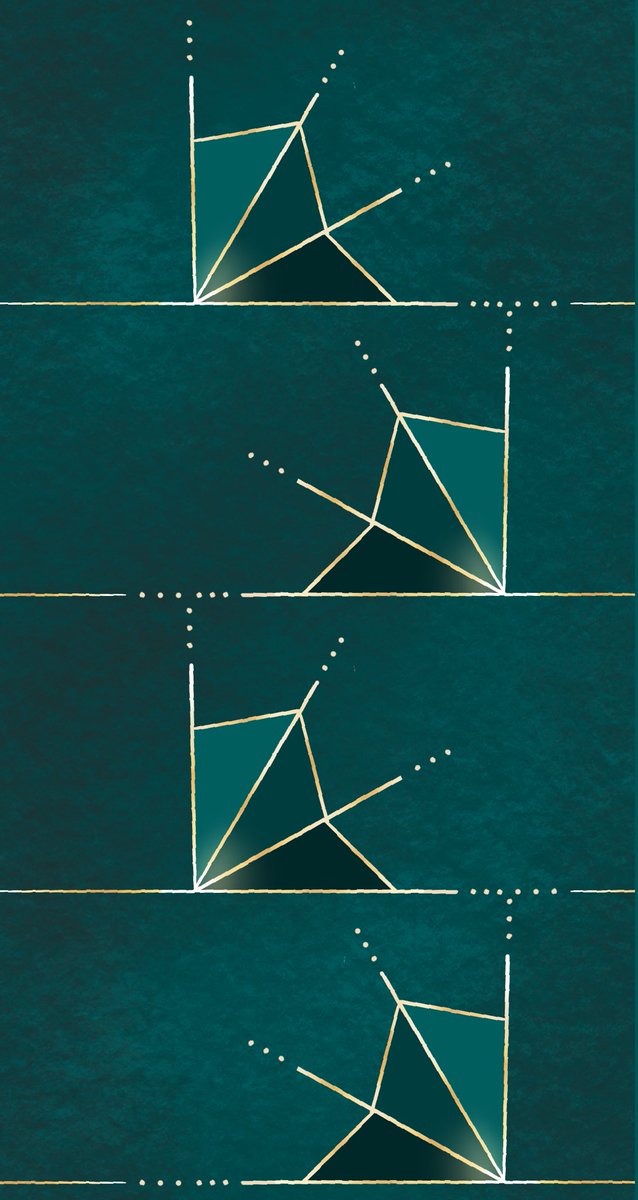
Here’s my #DataVizWallpaper for 1920!
I’m imagining what a #dataviz designer’s wallpaper would look like throughout the past century.
Here’s my #DataVizWallpaper for 1920!
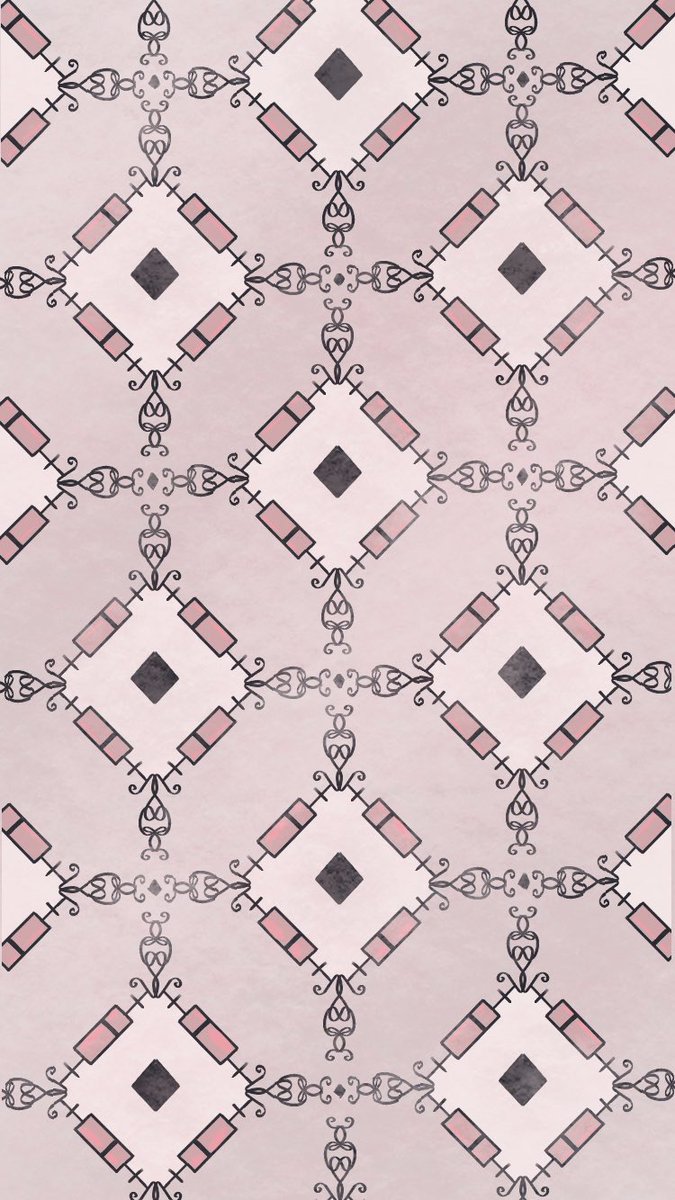
Today we have radar charts wallpaper in 1921  https://abs.twimg.com/emoji/v2/... draggable="false" alt="🕸" title="Spider web" aria-label="Emoji: Spider web">
#dataviz #datavizwallpaper #the100dayproject
#dataviz #datavizwallpaper #the100dayproject
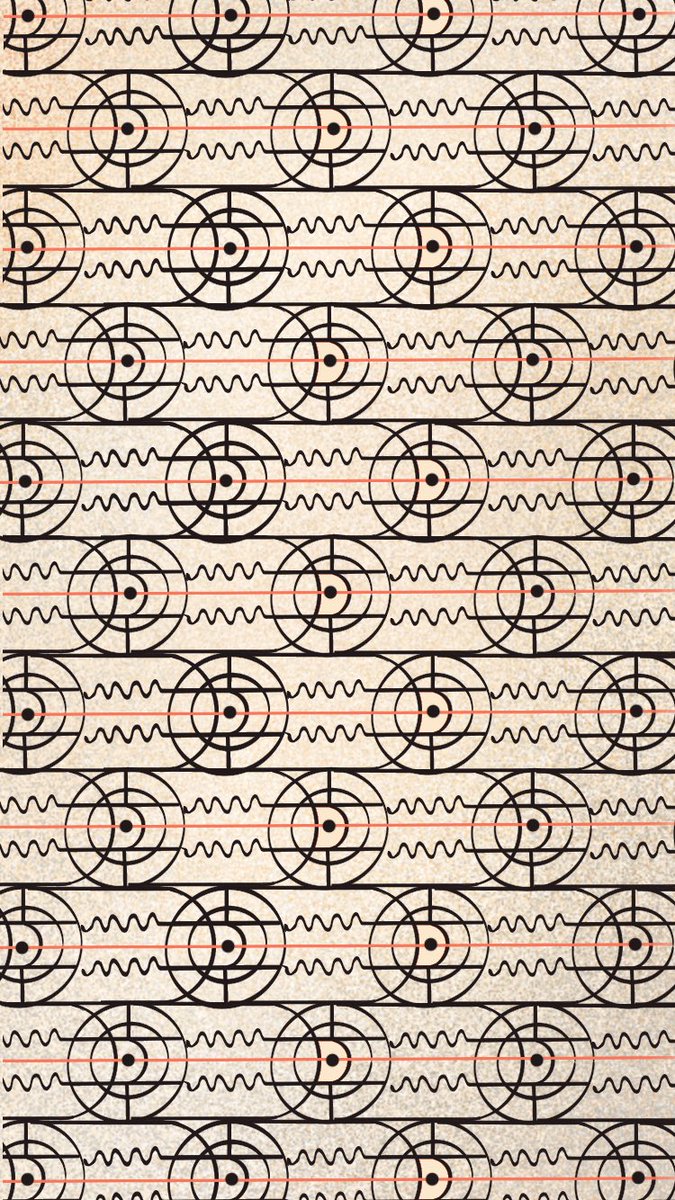
For the box plot lover in 1922 https://abs.twimg.com/emoji/v2/... draggable="false" alt="💕" title="Two hearts" aria-label="Emoji: Two hearts">
#datavizwallpaper #the100dayproject
#datavizwallpaper #the100dayproject
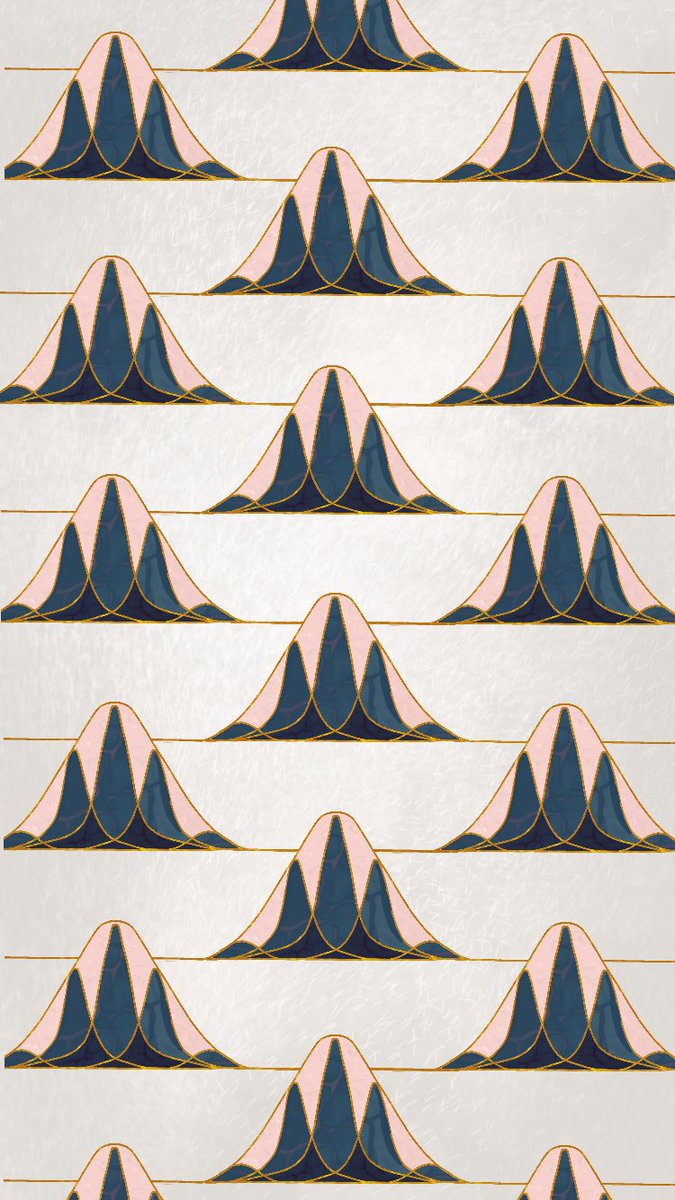
#DataVizWallpaper in 1923
Could have inspired a young Richard Feynman. https://abs.twimg.com/emoji/v2/... draggable="false" alt="🤓" title="Nerd face" aria-label="Emoji: Nerd face">
#the100dayproject #dataviz #physics
Could have inspired a young Richard Feynman.
#the100dayproject #dataviz #physics
#DataVizWallpaper in 1924
My sister sent me some inspiration from an old #physics textbook. Here’s a nod to the Doppler effect. https://abs.twimg.com/emoji/v2/... draggable="false" alt="🔊" title="Speaker with three sound waves" aria-label="Emoji: Speaker with three sound waves">
#the100dayproject #dataviz
My sister sent me some inspiration from an old #physics textbook. Here’s a nod to the Doppler effect.
#the100dayproject #dataviz
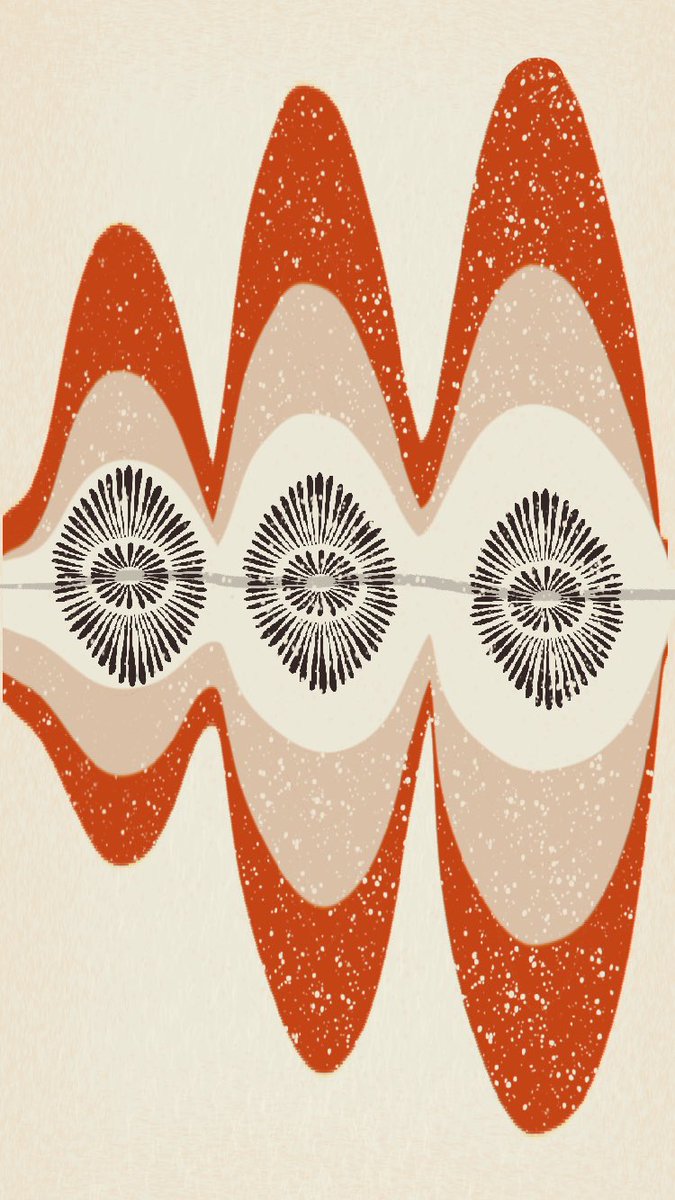
#DataVizWallpaper in 1925
Streamgraph... I struggled with this one, and it needs more work... but that’s the great part about doing this every day. Some days will be uninspired but you push through and share anyway. https://abs.twimg.com/emoji/v2/... draggable="false" alt="😺" title="Smiling cat face with open mouth" aria-label="Emoji: Smiling cat face with open mouth">
#the100dayproject
Streamgraph... I struggled with this one, and it needs more work... but that’s the great part about doing this every day. Some days will be uninspired but you push through and share anyway.
#the100dayproject
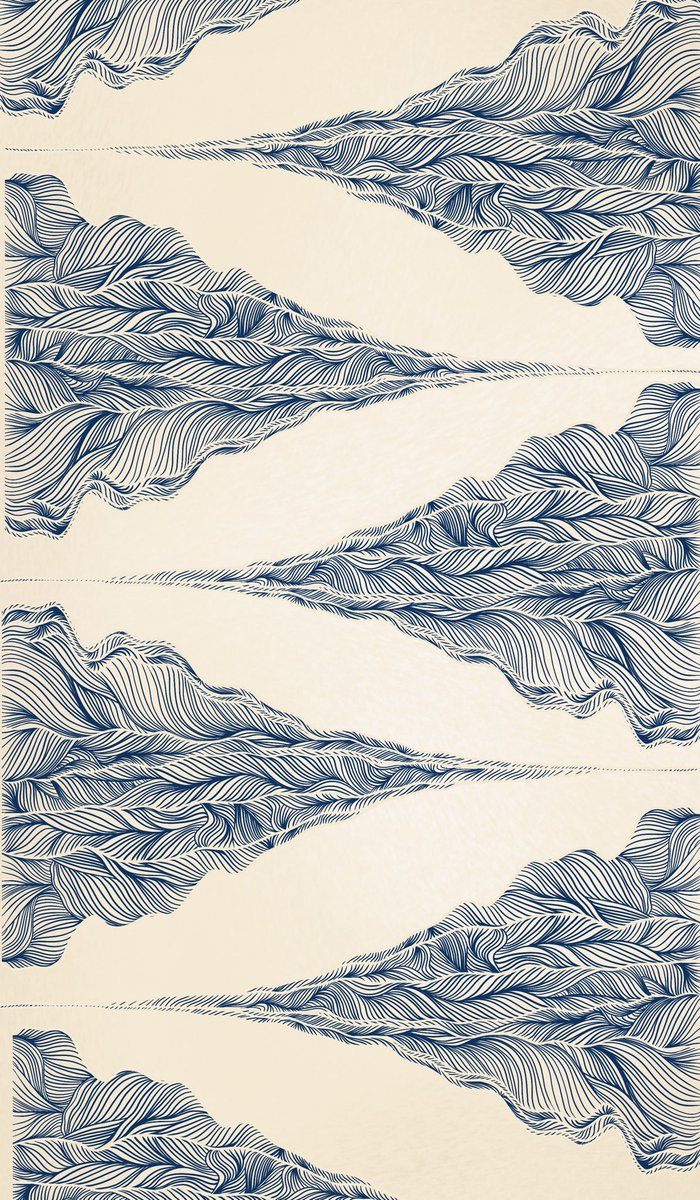
#DataVizWallpaper in 1926
Streamgraph — My muse has returned! I really love how this one turned out.
I riffed off of @sdbernard’s latest streamgraph. It was hours of work but it’s https://abs.twimg.com/emoji/v2/... draggable="false" alt="🤩" title="Star-struck" aria-label="Emoji: Star-struck">
#the100dayproject #dataviz
Streamgraph — My muse has returned! I really love how this one turned out.
I riffed off of @sdbernard’s latest streamgraph. It was hours of work but it’s
#the100dayproject #dataviz
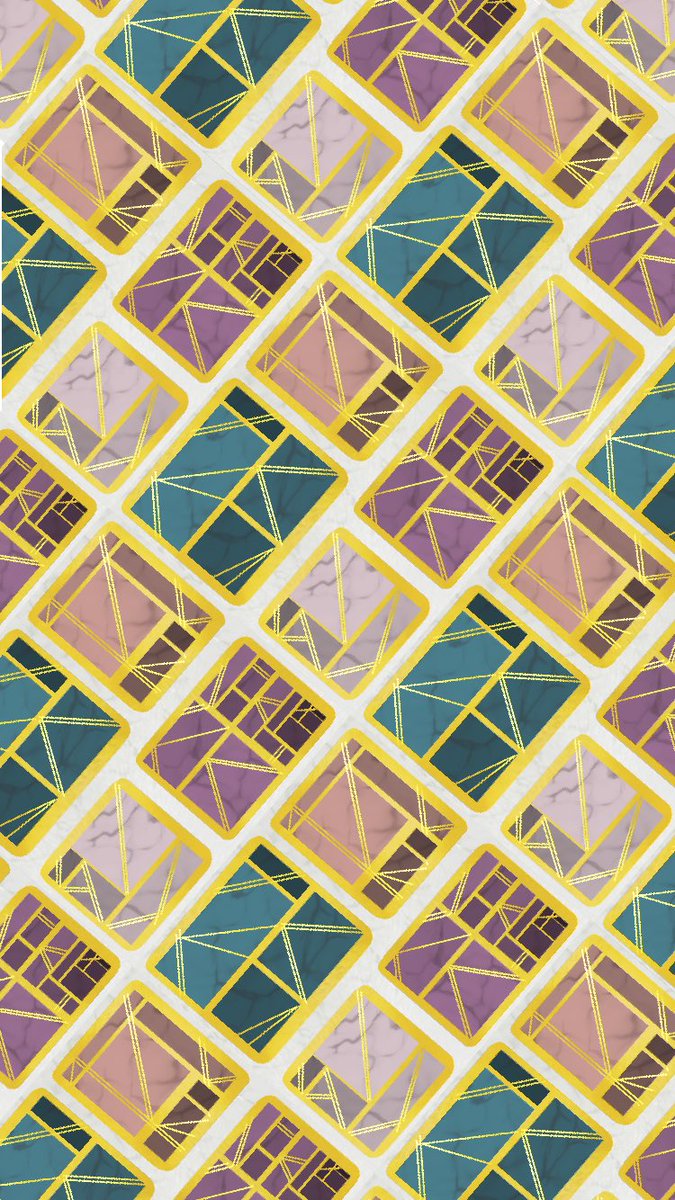
#DataVizWallpaper in 1929
Today we have the classic bar chart https://abs.twimg.com/emoji/v2/... draggable="false" alt="📊" title="Bar chart" aria-label="Emoji: Bar chart">
#the100dayproject #dataviz
Today we have the classic bar chart
#the100dayproject #dataviz
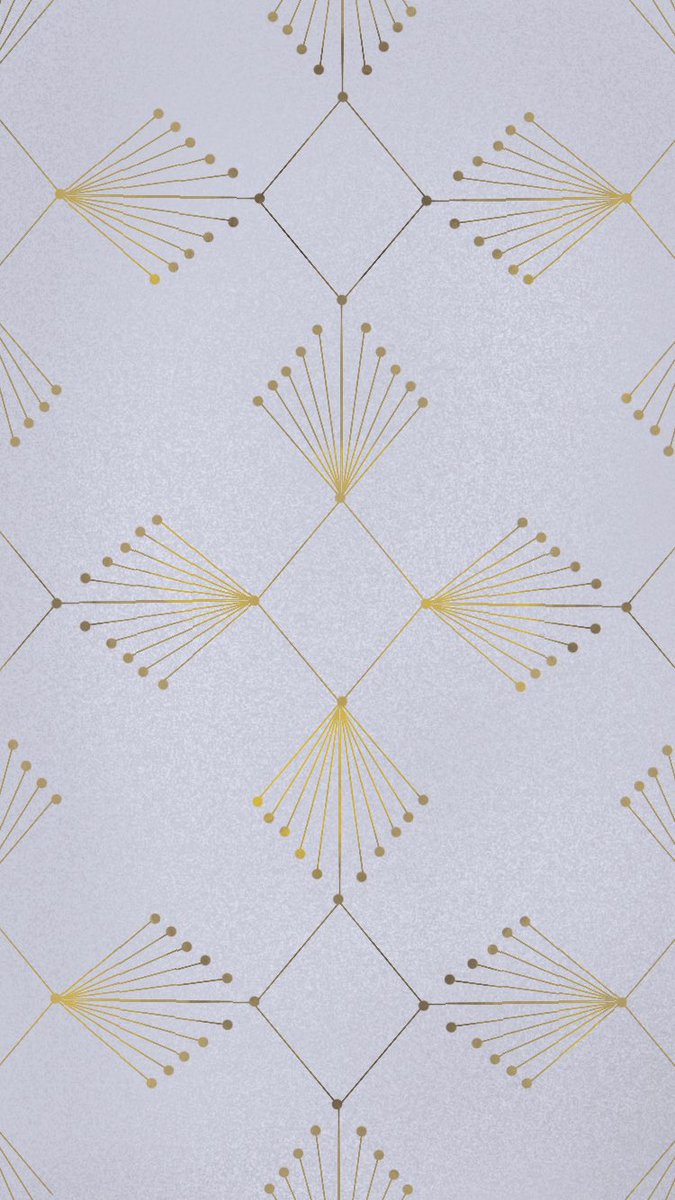
#DataVizWallpaper in 1930
Arc maps! https://abs.twimg.com/emoji/v2/... draggable="false" alt="🌎" title="Earth globe americas" aria-label="Emoji: Earth globe americas">
#the100dayproject #dataviz
Arc maps!
#the100dayproject #dataviz
#DataVizWallpaper in 1931
Bubble chart nod to Hans Rosling https://abs.twimg.com/emoji/v2/... draggable="false" alt="🙌" title="Raising hands" aria-label="Emoji: Raising hands">
#the100dayproject #dataviz
Bubble chart nod to Hans Rosling
#the100dayproject #dataviz
#DataVizWallpaper in 1932
Inspired by plots found in seismology https://abs.twimg.com/emoji/v2/... draggable="false" alt="🌐" title="Globe with meridians" aria-label="Emoji: Globe with meridians">
#the100dayproject #dataviz #earthscience
Inspired by plots found in seismology
#the100dayproject #dataviz #earthscience
#DataVizWallpaper in 1933
The fan chart https://abs.twimg.com/emoji/v2/... draggable="false" alt="🌹" title="Rose" aria-label="Emoji: Rose">
#the100dayproject #dataviz
The fan chart
#the100dayproject #dataviz
#DataVizWallpaper in 1934
Line chart — the future is bright https://abs.twimg.com/emoji/v2/... draggable="false" alt="☀️" title="Sun with rays" aria-label="Emoji: Sun with rays">
#the100dayproject #dataviz
Line chart — the future is bright
#the100dayproject #dataviz
#DataVizWallpaper in 1935
Voronoi treemaps! https://abs.twimg.com/emoji/v2/... draggable="false" alt="🤎" title="Brown heart" aria-label="Emoji: Brown heart">
#the100dayproject #dataviz
Voronoi treemaps!
#the100dayproject #dataviz
#DataVizWallpaper in 1936
Arc diagrams https://abs.twimg.com/emoji/v2/... draggable="false" alt="🌙" title="Crescent moon" aria-label="Emoji: Crescent moon">
#the100dayproject #DataArt
Arc diagrams
#the100dayproject #DataArt
#DataVizWallpaper in 1937
Violin plots! https://abs.twimg.com/emoji/v2/... draggable="false" alt="🎻" title="Violin" aria-label="Emoji: Violin">
#the100dayproject #DataArt
Violin plots!
#the100dayproject #DataArt
#DataVizWallpaper in 1938
Ternary plot https://abs.twimg.com/emoji/v2/... draggable="false" alt="🔺" title="Up-pointing red triangle" aria-label="Emoji: Up-pointing red triangle">
This one is for soil composition — can you see it?! I turned it into a ternary cube https://abs.twimg.com/emoji/v2/... draggable="false" alt="😅" title="Smiling face with open mouth and cold sweat" aria-label="Emoji: Smiling face with open mouth and cold sweat">
#the100dayproject #DataArt
Ternary plot
This one is for soil composition — can you see it?! I turned it into a ternary cube
#the100dayproject #DataArt
#DataVizWallpaper in 1939
My take on the Smith Chart used by electrical engineers https://abs.twimg.com/emoji/v2/... draggable="false" alt="⚡️" title="High voltage sign" aria-label="Emoji: High voltage sign">
#the100dayproject #DataArt
My take on the Smith Chart used by electrical engineers
#the100dayproject #DataArt
#DataVizWallpaper in 1941
Packed bubbles https://abs.twimg.com/emoji/v2/... draggable="false" alt="⚪️" title="White circle" aria-label="Emoji: White circle">
 https://abs.twimg.com/emoji/v2/... draggable="false" alt="⚪️" title="White circle" aria-label="Emoji: White circle">
 https://abs.twimg.com/emoji/v2/... draggable="false" alt="⚪️" title="White circle" aria-label="Emoji: White circle">
#the100dayproject #DataArt
Packed bubbles
#the100dayproject #DataArt
#DataVizWallpaper in 1942
Sankey diagram https://abs.twimg.com/emoji/v2/... draggable="false" alt="🐍" title="Snake" aria-label="Emoji: Snake">
#the100dayproject #DataArt
Sankey diagram
#the100dayproject #DataArt
#DataVizWallpaper in 1943
Nightingale https://abs.twimg.com/emoji/v2/... draggable="false" alt="🌸" title="Cherry blossom" aria-label="Emoji: Cherry blossom">
#the100dayproject #DataArt
Nightingale
#the100dayproject #DataArt
#DataVizWallpaper in 1944
Contour plot https://abs.twimg.com/emoji/v2/... draggable="false" alt="〰️" title="Wavy dash" aria-label="Emoji: Wavy dash">
#the100dayproject #DataArt
Contour plot
#the100dayproject #DataArt
#DataVizWallpaper in 1945
Bar chart race https://abs.twimg.com/emoji/v2/... draggable="false" alt="🏃♀️" title="Woman running" aria-label="Emoji: Woman running">
#the100dayproject #DataArt
Bar chart race
#the100dayproject #DataArt
#DataVizWallpaper in 1946
Venn diagram https://abs.twimg.com/emoji/v2/... draggable="false" alt="⚫️" title="Black circle" aria-label="Emoji: Black circle">
 https://abs.twimg.com/emoji/v2/... draggable="false" alt="🔴" title="Red circle" aria-label="Emoji: Red circle">
#the100dayproject #DataArt
Venn diagram
#the100dayproject #DataArt
#DataVizWallpaper in 1947
Small multiples of isotherms for bee colonies https://abs.twimg.com/emoji/v2/... draggable="false" alt="🐝" title="Honeybee" aria-label="Emoji: Honeybee">
#the100dayproject #DataArt
Small multiples of isotherms for bee colonies
#the100dayproject #DataArt
#DataVizWallpaper in 1948
Different perspectives on a fan chart to show uncertainty https://abs.twimg.com/emoji/v2/... draggable="false" alt="❔" title="White question mark ornament" aria-label="Emoji: White question mark ornament">
#the100dayproject #DataArt
Different perspectives on a fan chart to show uncertainty
#the100dayproject #DataArt
#DataVizWallpaper in 1949
Slope chart — inspired by a Picasso painting during this time. His style is very difficult to emulate (surprise! https://abs.twimg.com/emoji/v2/... draggable="false" alt="😅" title="Smiling face with open mouth and cold sweat" aria-label="Emoji: Smiling face with open mouth and cold sweat">). I love his effortless,somber whimsy ( https://www.moma.org/collection/works/79668).
https://www.moma.org/collectio... href="https://twtext.com//hashtag/the100dayproject"> #the100dayproject #DataArt
Slope chart — inspired by a Picasso painting during this time. His style is very difficult to emulate (surprise!
#DataVizWallpaper in 1950
Starting a new decade with a chord diagram!
I’m sharing more about each day’s inspo + process over on IG if you’re interested https://abs.twimg.com/emoji/v2/... draggable="false" alt="😍" title="Smiling face with heart-shaped eyes" aria-label="Emoji: Smiling face with heart-shaped eyes">
 https://abs.twimg.com/emoji/v2/... draggable="false" alt="👉" title="Right pointing backhand index" aria-label="Emoji: Right pointing backhand index"> https://instagram.com/dataviztoday
https://instagram.com/datavizto... href="https://twtext.com//hashtag/The100DayProject"> #The100DayProject #DataArt
Starting a new decade with a chord diagram!
I’m sharing more about each day’s inspo + process over on IG if you’re interested
#DataVizWallpaper in 1951
Little city heatmaps https://abs.twimg.com/emoji/v2/... draggable="false" alt="🌆" title="Cityscape at dusk" aria-label="Emoji: Cityscape at dusk">
#the100dayproject #DataArt
Little city heatmaps
#the100dayproject #DataArt
#DataVizWallpaper in 1952
Strawberry isotype https://abs.twimg.com/emoji/v2/... draggable="false" alt="🍓" title="Strawberry" aria-label="Emoji: Strawberry">
#The100DayProject #DataArt
Strawberry isotype
#The100DayProject #DataArt
#DataVizWallpaper in 1953
I took @alyssafowers’s zoomwaffles into the 50s! https://abs.twimg.com/emoji/v2/... draggable="false" alt="🧇" title="Waffle" aria-label="Emoji: Waffle">
#the100dayproject #DataArt
I took @alyssafowers’s zoomwaffles into the 50s!
#the100dayproject #DataArt
#DataVizWallpaper in 1954
Waffle chart https://abs.twimg.com/emoji/v2/... draggable="false" alt="🧇" title="Waffle" aria-label="Emoji: Waffle"> — I was inspired by an old matchstick box
 https://abs.twimg.com/emoji/v2/... draggable="false" alt="🔥" title="Fire" aria-label="Emoji: Fire">
#the100dayproject #DataArt
Waffle chart
#the100dayproject #DataArt
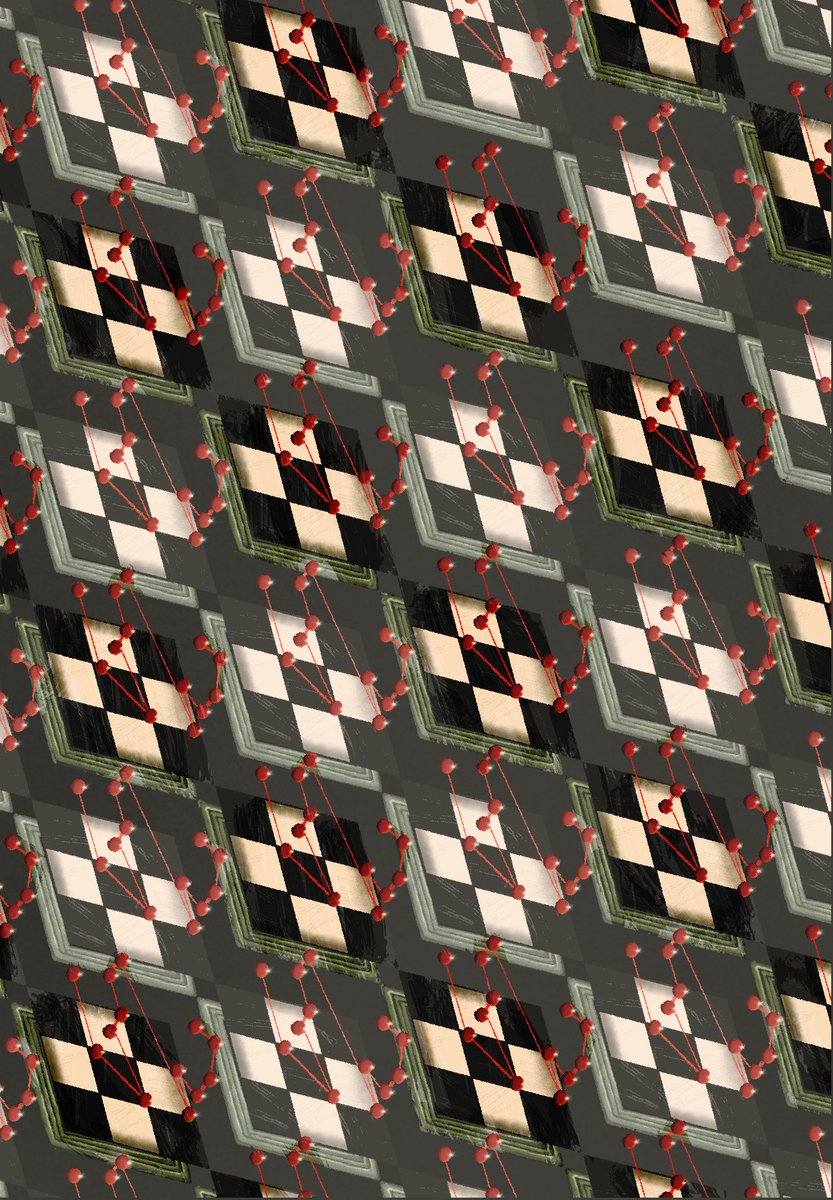
#DataVizWallpaper in 1955
Exploded 50s diner-style connected scatterplot https://abs.twimg.com/emoji/v2/... draggable="false" alt="😳" title="Flushed face" aria-label="Emoji: Flushed face">
#the100dayproject #DataArt
Exploded 50s diner-style connected scatterplot
#the100dayproject #DataArt
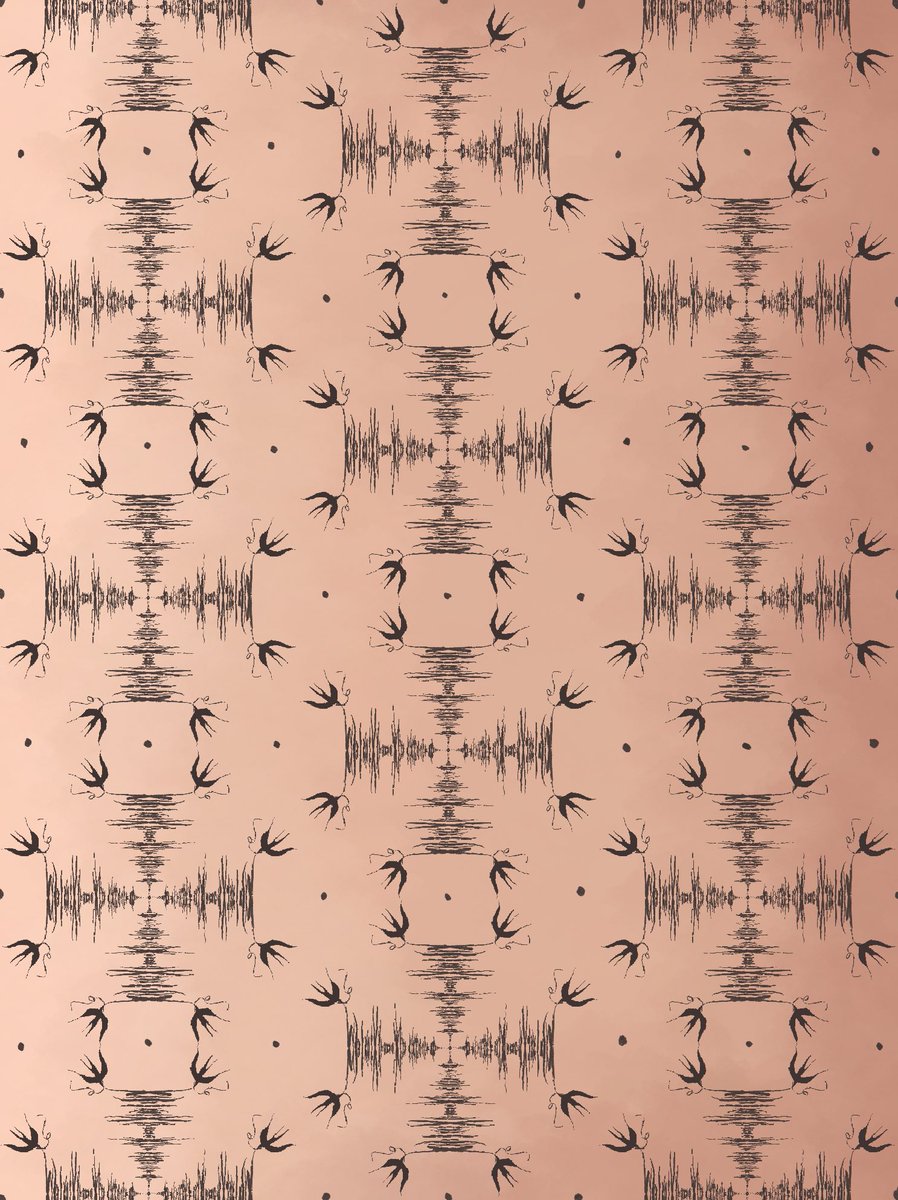
#DataVizWallpaper in 1956
Sound waves + swallows https://abs.twimg.com/emoji/v2/... draggable="false" alt="✨" title="Sparkles" aria-label="Emoji: Sparkles">
#the100dayproject #DataArt
Sound waves + swallows
#the100dayproject #DataArt
#DataVizWallpaper in 1957
Dumbbell plot inspired by a picture of @evergreendata’s desk chair that she shared with me https://abs.twimg.com/emoji/v2/... draggable="false" alt="🥰" title="Smiling face with 3 hearts" aria-label="Emoji: Smiling face with 3 hearts">
 https://abs.twimg.com/emoji/v2/... draggable="false" alt="🏋️♀️" title="Woman lifting weights" aria-label="Emoji: Woman lifting weights">
#the100dayproject #DataArt
Dumbbell plot inspired by a picture of @evergreendata’s desk chair that she shared with me
#the100dayproject #DataArt
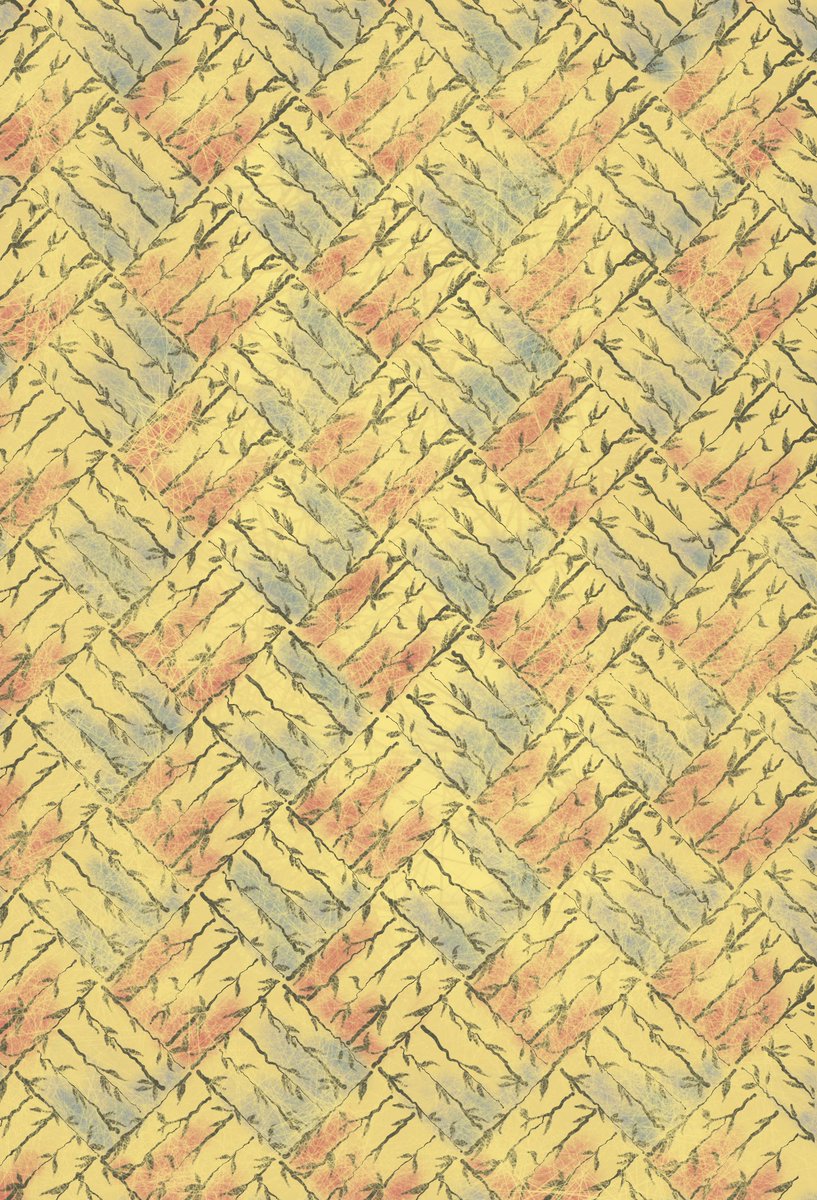
#DataVizWallpaper in 1958
Bar charts in the brush https://abs.twimg.com/emoji/v2/... draggable="false" alt="📊" title="Bar chart" aria-label="Emoji: Bar chart">
 https://abs.twimg.com/emoji/v2/... draggable="false" alt="🌿" title="Herb" aria-label="Emoji: Herb">
 https://abs.twimg.com/emoji/v2/... draggable="false" alt="🌾" title="Ear of rice" aria-label="Emoji: Ear of rice">
#the100dayproject #DataArt
Bar charts in the brush
#the100dayproject #DataArt
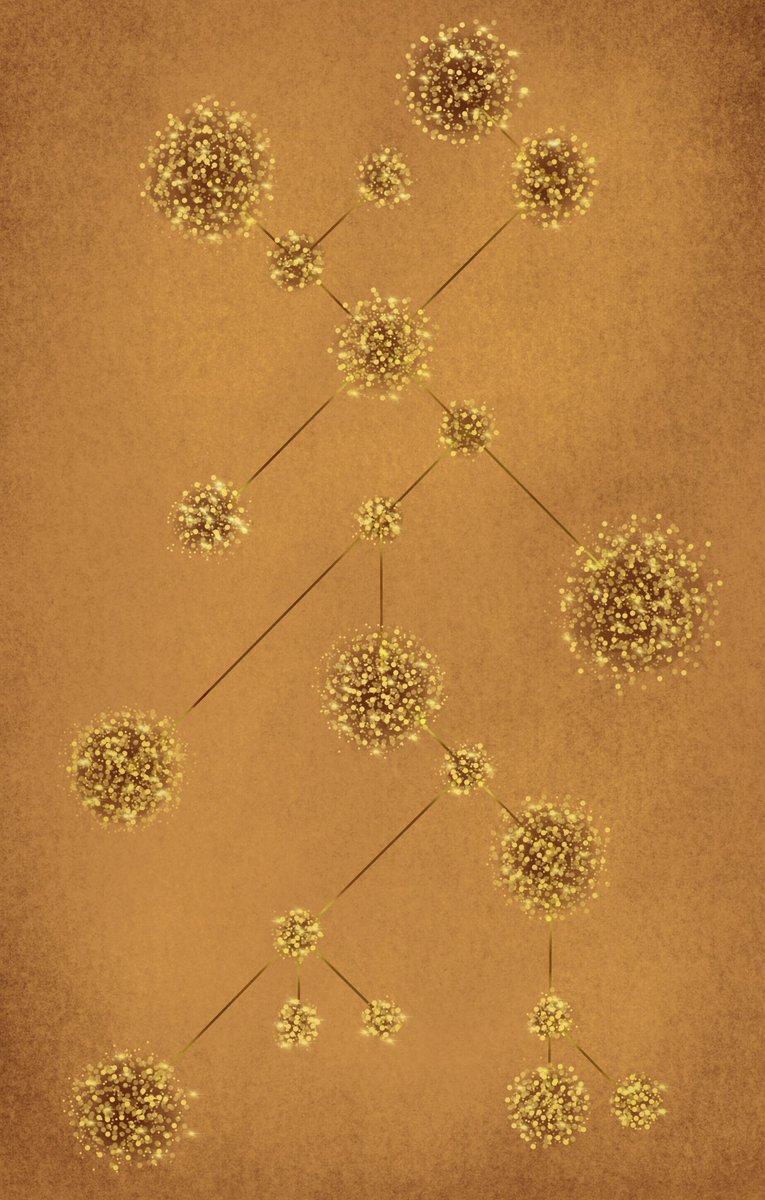
#DataVizWallpaper in 1959
Inspired by @defilippovale’s Me Too Momentum project, I created a 50’s style dandelion network.
#the100dayproject #DataArt
Inspired by @defilippovale’s Me Too Momentum project, I created a 50’s style dandelion network.
#the100dayproject #DataArt
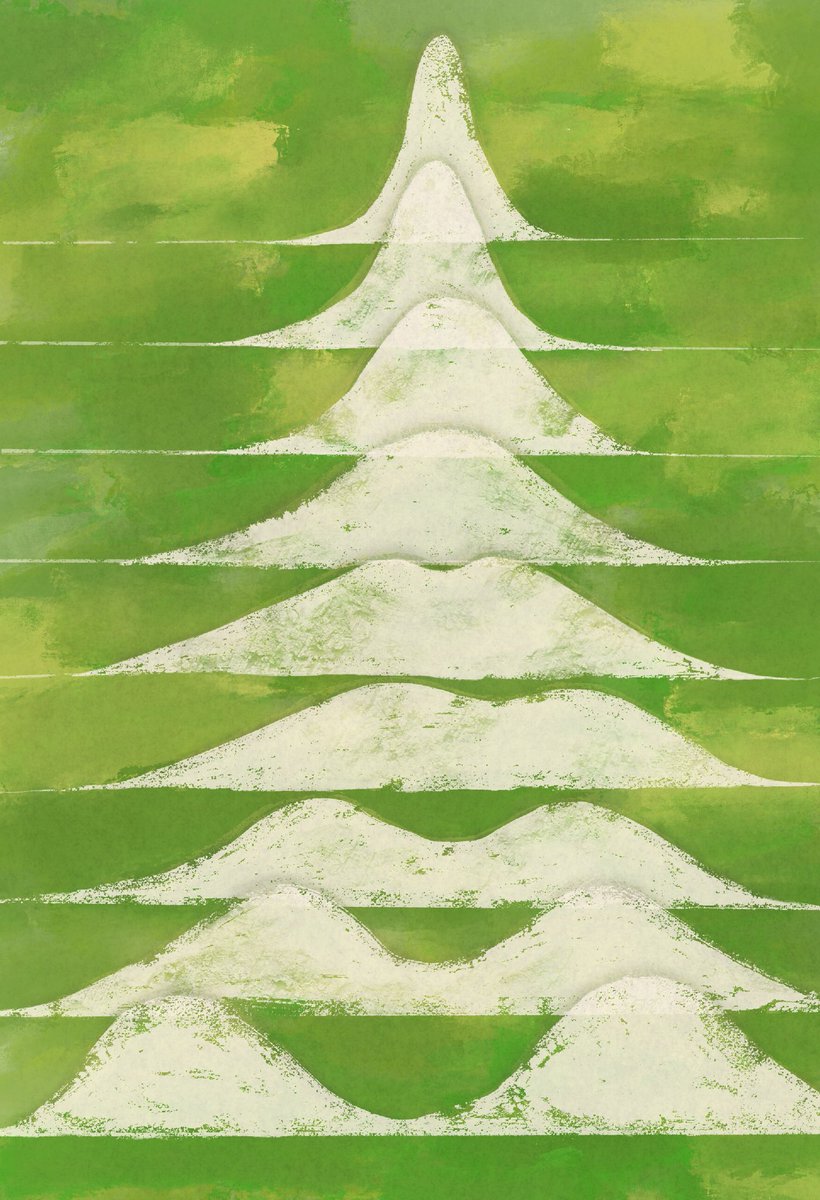
#DataVizWallpaper in 1960
Frequency trails + tennis https://abs.twimg.com/emoji/v2/... draggable="false" alt="🎾" title="Tennis ball" aria-label="Emoji: Tennis ball">
#the100dayproject #DataArt
Frequency trails + tennis
#the100dayproject #DataArt
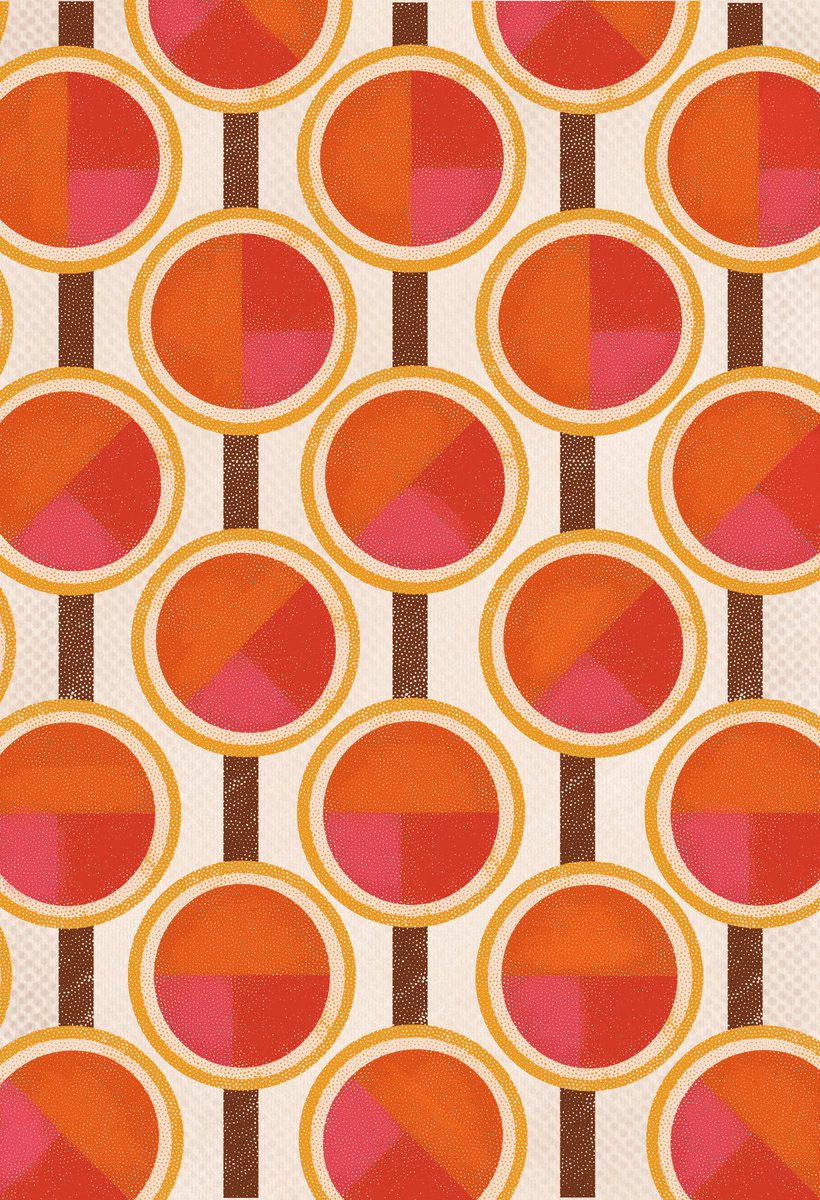
#DataVizWallpaper in 1961
Citrusy pie charts https://abs.twimg.com/emoji/v2/... draggable="false" alt="🍊" title="Tangerine" aria-label="Emoji: Tangerine">
 https://abs.twimg.com/emoji/v2/... draggable="false" alt="🍋" title="Lemon" aria-label="Emoji: Lemon">
#the100dayproject #DataArt
Citrusy pie charts
#the100dayproject #DataArt
#DataVizWallpaper in 1962
A corduroy chart party https://abs.twimg.com/emoji/v2/... draggable="false" alt="👖" title="Jeans" aria-label="Emoji: Jeans">
 https://abs.twimg.com/emoji/v2/... draggable="false" alt="📊" title="Bar chart" aria-label="Emoji: Bar chart">
 https://abs.twimg.com/emoji/v2/... draggable="false" alt="🥳" title="Partying face" aria-label="Emoji: Partying face">
#the100dayproject #DataArt
A corduroy chart party
#the100dayproject #DataArt
#DataVizWallpaper in 1963
Isochrone! https://abs.twimg.com/emoji/v2/... draggable="false" alt="🗺" title="World map" aria-label="Emoji: World map">
#the100dayproject #DataArt
Isochrone!
#the100dayproject #DataArt
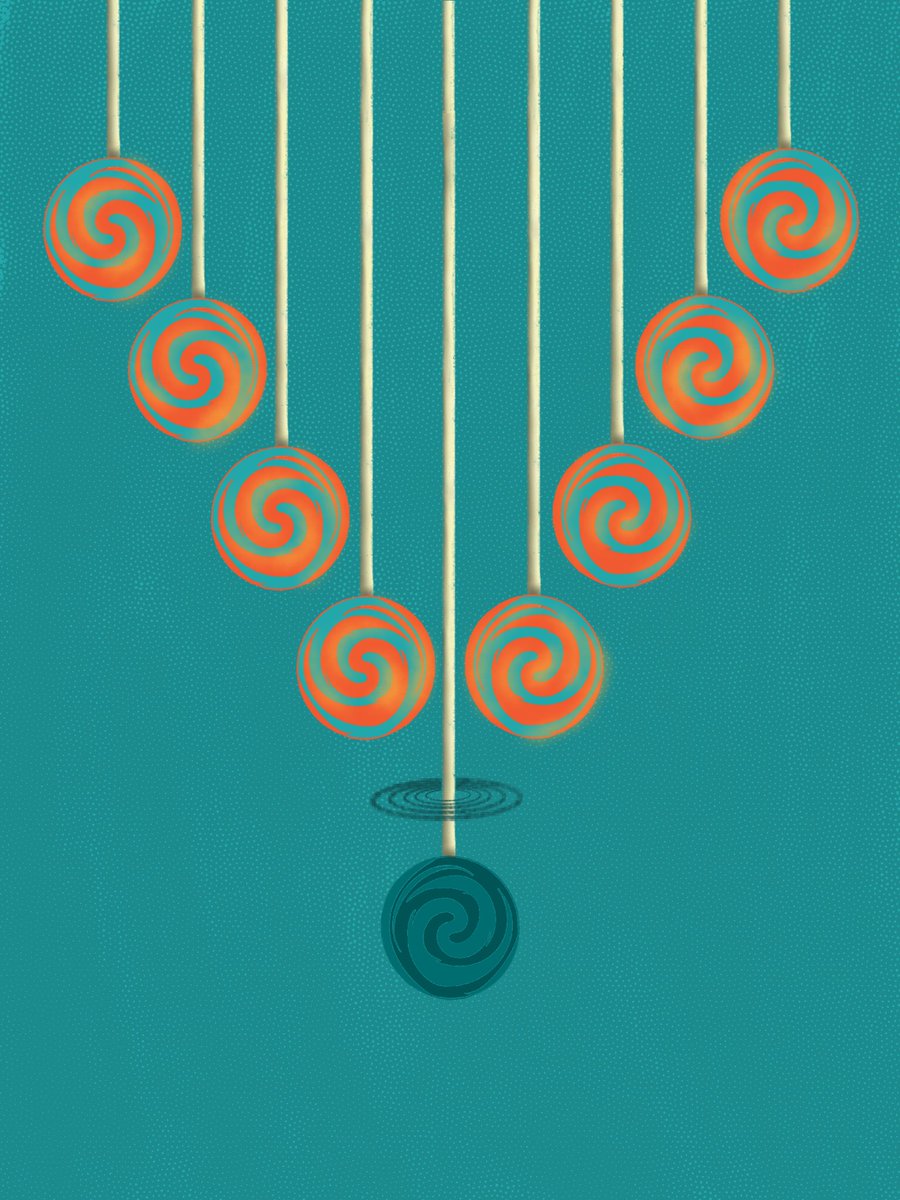
#DataVizWallpaper in 1964
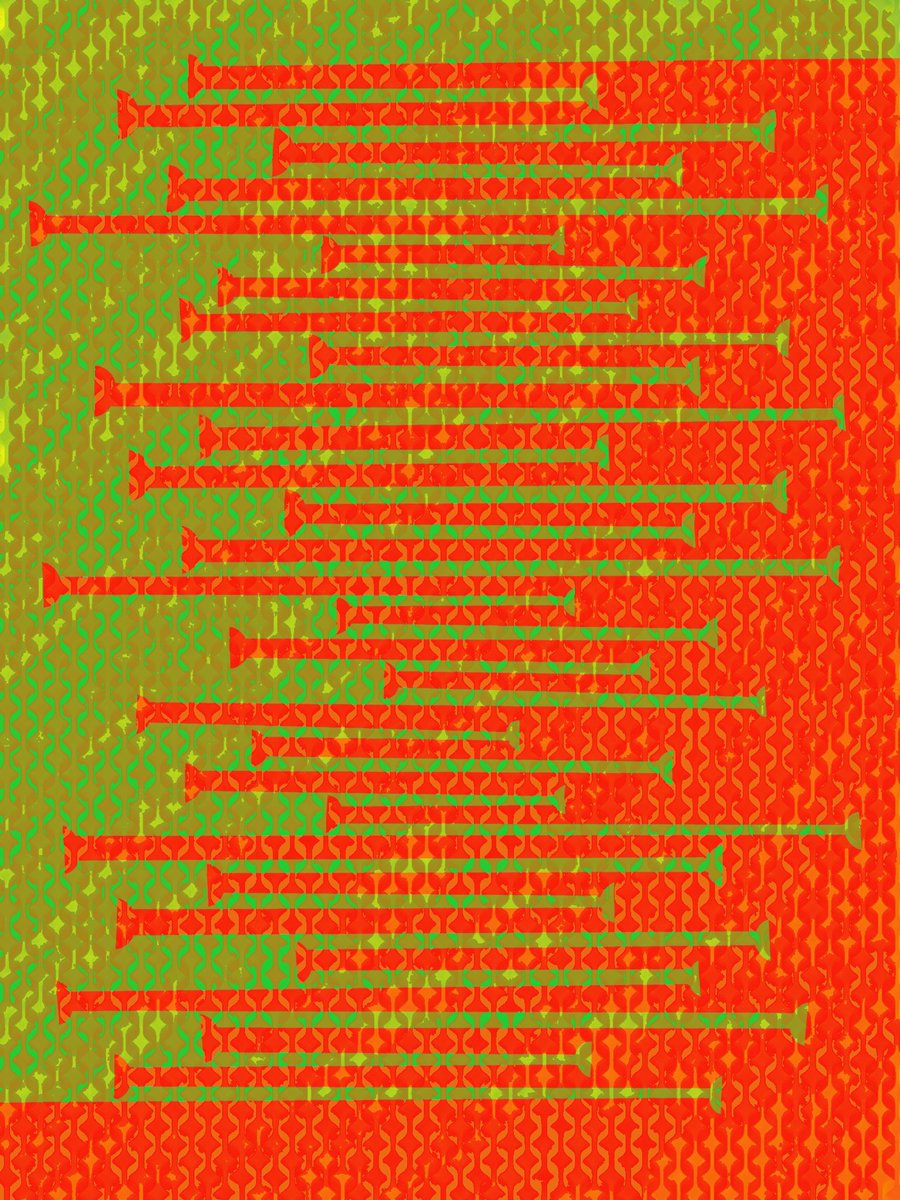
Lollipop chart https://abs.twimg.com/emoji/v2/... draggable="false" alt="🍭" title="Lollipop" aria-label="Emoji: Lollipop">
#the100dayproject #DataArt
Lollipop chart
#the100dayproject #DataArt
#DataVizWallpaper in 1966
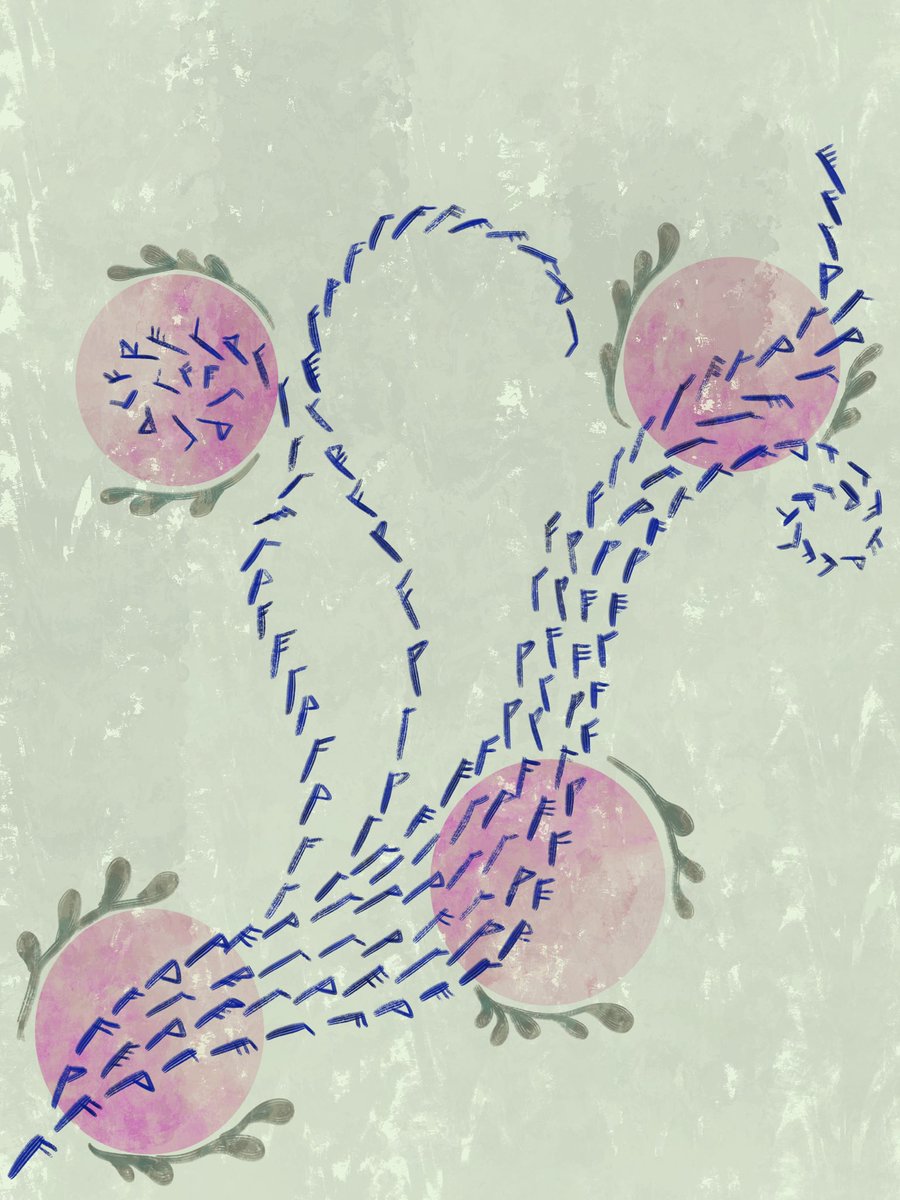
Wind barbs https://abs.twimg.com/emoji/v2/... draggable="false" alt="🌬" title="Wind blowing face" aria-label="Emoji: Wind blowing face"> I learned that these are used to represent wind speed & direction in graphical form.
Design inspo & time lapse in thread https://abs.twimg.com/emoji/v2/... draggable="false" alt="🤗" title="Hugging face" aria-label="Emoji: Hugging face">
 https://abs.twimg.com/emoji/v2/... draggable="false" alt="👇" title="Down pointing backhand index" aria-label="Emoji: Down pointing backhand index">
#the100dayproject #dataart
Wind barbs
Design inspo & time lapse in thread
#the100dayproject #dataart
#DataVizWallpaper in 1967
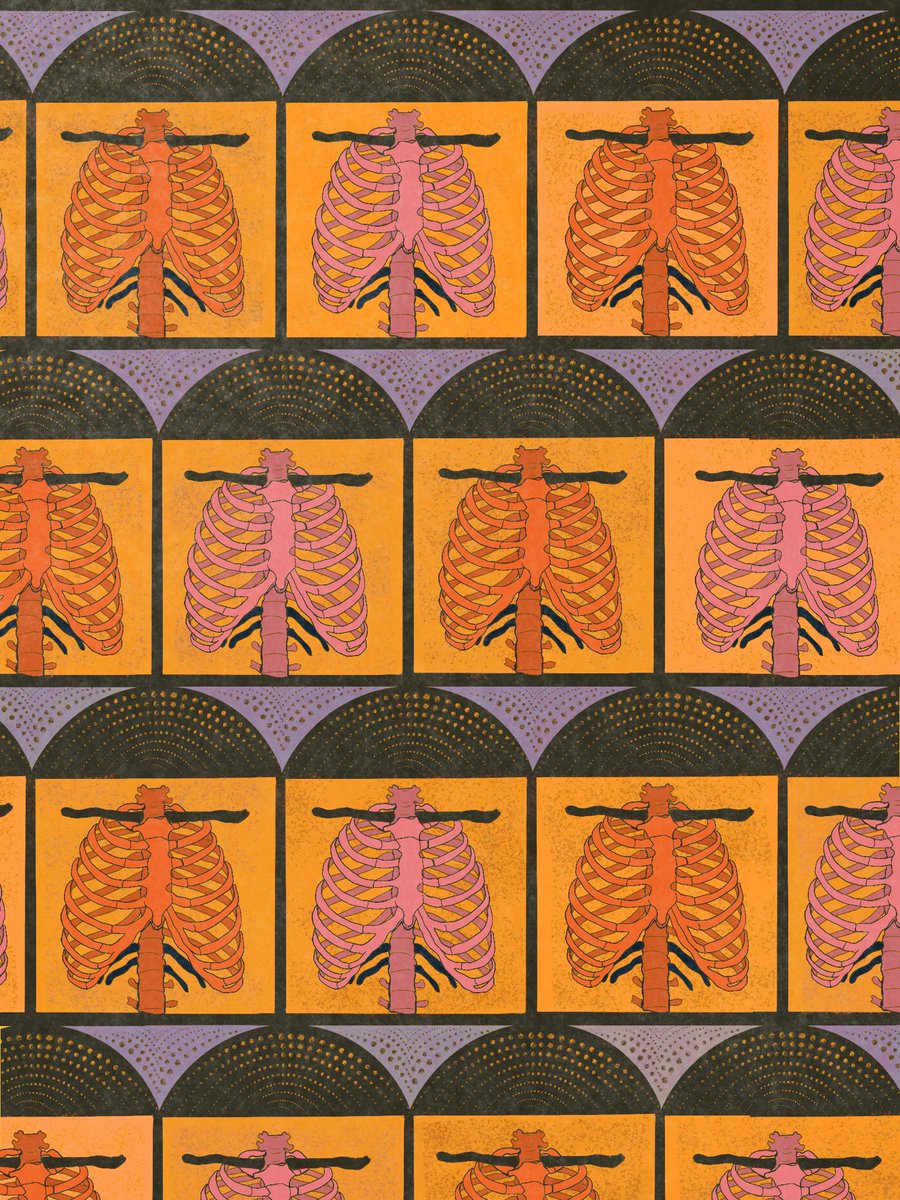
I can see this as studio wallpaper for a band called “Clavicle and the Floating Ribs” https://abs.twimg.com/emoji/v2/... draggable="false" alt="😂" title="Face with tears of joy" aria-label="Emoji: Face with tears of joy">
 https://abs.twimg.com/emoji/v2/... draggable="false" alt="🦴" title="Bone" aria-label="Emoji: Bone">
#the100dayproject #dataart
I can see this as studio wallpaper for a band called “Clavicle and the Floating Ribs”
#the100dayproject #dataart
#DataVizWallpaper in 1968
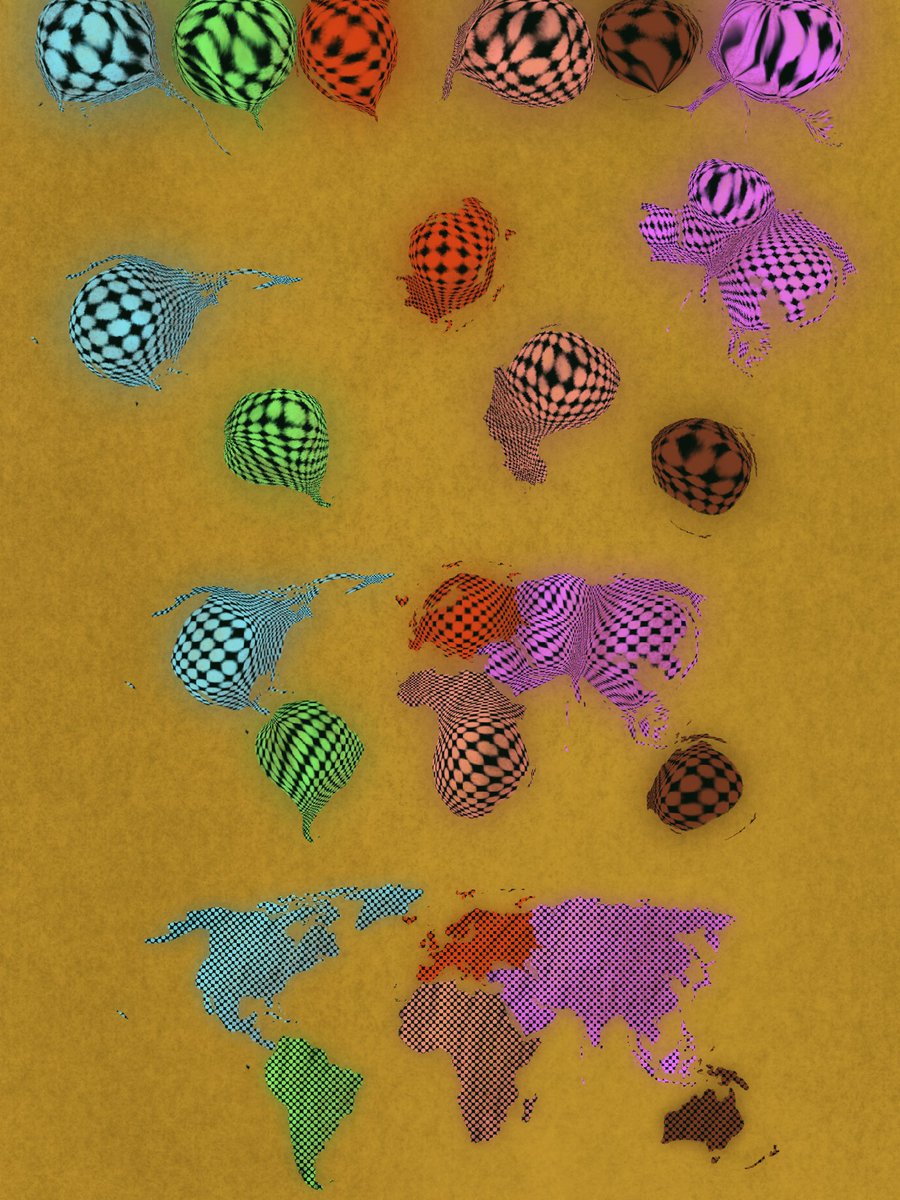
Cartogram balloons https://abs.twimg.com/emoji/v2/... draggable="false" alt="🎈" title="Balloon" aria-label="Emoji: Balloon">
#the100dayproject #DataArt
Cartogram balloons
#the100dayproject #DataArt
#DataVizWallpaper in 1969
Trippy Chernoff faces https://abs.twimg.com/emoji/v2/... draggable="false" alt="👹" title="Japanese ogre" aria-label="Emoji: Japanese ogre"> my 6 yro laughed so hard watching me draw this
  https://abs.twimg.com/emoji/v2/... draggable="false" alt="🤣" title="Rolling on the floor laughing" aria-label="Emoji: Rolling on the floor laughing">
#the100dayproject #DataArt
Trippy Chernoff faces
#the100dayproject #DataArt
#DataVizWallpaper in 1970
Sparklines https://abs.twimg.com/emoji/v2/... draggable="false" alt="〽️" title="Part alternation mark" aria-label="Emoji: Part alternation mark">
#the100dayproject #dataart
Sparklines
#the100dayproject #dataart
WHEW!!! https://abs.twimg.com/emoji/v2/... draggable="false" alt="🥳" title="Partying face" aria-label="Emoji: Partying face">My project was mentioned in @Washingtonian Magazine! So much beautiful quarantine art: https://www.washingtonian.com/2020/05/27/washingtonians-poignant-quarantine-art/
https://www.washingtonian.com/2020/05/2... href="https://twtext.com//hashtag/WashMagQuarArt"> #WashMagQuarArt

 Read on Twitter
 Here’s my #DataVizWallpaper for 1920!" title=" #The100DayProjectI’m imagining what a #dataviz designer’s wallpaper would look like throughout the past century. https://abs.twimg.com/emoji/v2/... draggable="false" alt="🤗" title="Hugging face" aria-label="Emoji: Hugging face">Here’s my #DataVizWallpaper for 1920!" class="img-responsive" style="max-width:100%;"/>
 #dataviz #datavizwallpaper #the100dayproject" title="Today we have radar charts wallpaper in 1921 https://abs.twimg.com/emoji/v2/... draggable="false" alt="🕸" title="Spider web" aria-label="Emoji: Spider web"> #dataviz #datavizwallpaper #the100dayproject" class="img-responsive" style="max-width:100%;"/>
 #datavizwallpaper #the100dayproject" title="For the box plot lover in 1922https://abs.twimg.com/emoji/v2/... draggable="false" alt="💕" title="Two hearts" aria-label="Emoji: Two hearts"> #datavizwallpaper #the100dayproject" class="img-responsive" style="max-width:100%;"/>
 #the100dayproject #dataviz #physics" title=" #DataVizWallpaper in 1923Could have inspired a young Richard Feynman.https://abs.twimg.com/emoji/v2/... draggable="false" alt="🤓" title="Nerd face" aria-label="Emoji: Nerd face"> #the100dayproject #dataviz #physics" class="img-responsive" style="max-width:100%;"/>
 #the100dayproject #dataviz" title=" #DataVizWallpaper in 1924My sister sent me some inspiration from an old #physics textbook. Here’s a nod to the Doppler effect. https://abs.twimg.com/emoji/v2/... draggable="false" alt="🔊" title="Speaker with three sound waves" aria-label="Emoji: Speaker with three sound waves"> #the100dayproject #dataviz" class="img-responsive" style="max-width:100%;"/>
 #the100dayproject" title=" #DataVizWallpaper in 1925Streamgraph... I struggled with this one, and it needs more work... but that’s the great part about doing this every day. Some days will be uninspired but you push through and share anyway. https://abs.twimg.com/emoji/v2/... draggable="false" alt="😺" title="Smiling cat face with open mouth" aria-label="Emoji: Smiling cat face with open mouth"> #the100dayproject" class="img-responsive" style="max-width:100%;"/>
 #the100dayproject #dataviz" title=" #DataVizWallpaper in 1926Streamgraph — My muse has returned! I really love how this one turned out.I riffed off of @sdbernard’s latest streamgraph. It was hours of work but it’s https://abs.twimg.com/emoji/v2/... draggable="false" alt="🤩" title="Star-struck" aria-label="Emoji: Star-struck"> #the100dayproject #dataviz" class="img-responsive" style="max-width:100%;"/>
 #the100dayproject #dataviz" title=" #DataVizWallpaper in 1929Today we have the classic bar charthttps://abs.twimg.com/emoji/v2/... draggable="false" alt="📊" title="Bar chart" aria-label="Emoji: Bar chart"> #the100dayproject #dataviz" class="img-responsive" style="max-width:100%;"/>
 #the100dayproject #dataviz" title=" #DataVizWallpaper in 1930Arc maps! https://abs.twimg.com/emoji/v2/... draggable="false" alt="🌎" title="Earth globe americas" aria-label="Emoji: Earth globe americas"> #the100dayproject #dataviz" class="img-responsive" style="max-width:100%;"/>
 #the100dayproject #dataviz" title=" #DataVizWallpaper in 1931Bubble chart nod to Hans Rosling https://abs.twimg.com/emoji/v2/... draggable="false" alt="🙌" title="Raising hands" aria-label="Emoji: Raising hands"> #the100dayproject #dataviz" class="img-responsive" style="max-width:100%;"/>
 #the100dayproject #dataviz #earthscience" title=" #DataVizWallpaper in 1932Inspired by plots found in seismology https://abs.twimg.com/emoji/v2/... draggable="false" alt="🌐" title="Globe with meridians" aria-label="Emoji: Globe with meridians"> #the100dayproject #dataviz #earthscience" class="img-responsive" style="max-width:100%;"/>
 #the100dayproject #dataviz" title=" #DataVizWallpaper in 1933The fan charthttps://abs.twimg.com/emoji/v2/... draggable="false" alt="🌹" title="Rose" aria-label="Emoji: Rose"> #the100dayproject #dataviz" class="img-responsive" style="max-width:100%;"/>
 #the100dayproject #dataviz" title=" #DataVizWallpaper in 1934Line chart — the future is brighthttps://abs.twimg.com/emoji/v2/... draggable="false" alt="☀️" title="Sun with rays" aria-label="Emoji: Sun with rays"> #the100dayproject #dataviz" class="img-responsive" style="max-width:100%;"/>
 #the100dayproject #dataviz" title=" #DataVizWallpaper in 1935Voronoi treemaps! https://abs.twimg.com/emoji/v2/... draggable="false" alt="🤎" title="Brown heart" aria-label="Emoji: Brown heart"> #the100dayproject #dataviz" class="img-responsive" style="max-width:100%;"/>
 #the100dayproject #DataArt" title=" #DataVizWallpaper in 1936Arc diagrams https://abs.twimg.com/emoji/v2/... draggable="false" alt="🌙" title="Crescent moon" aria-label="Emoji: Crescent moon"> #the100dayproject #DataArt" class="img-responsive" style="max-width:100%;"/>
 #the100dayproject #DataArt" title=" #DataVizWallpaper in 1937Violin plots!https://abs.twimg.com/emoji/v2/... draggable="false" alt="🎻" title="Violin" aria-label="Emoji: Violin"> #the100dayproject #DataArt" class="img-responsive" style="max-width:100%;"/>
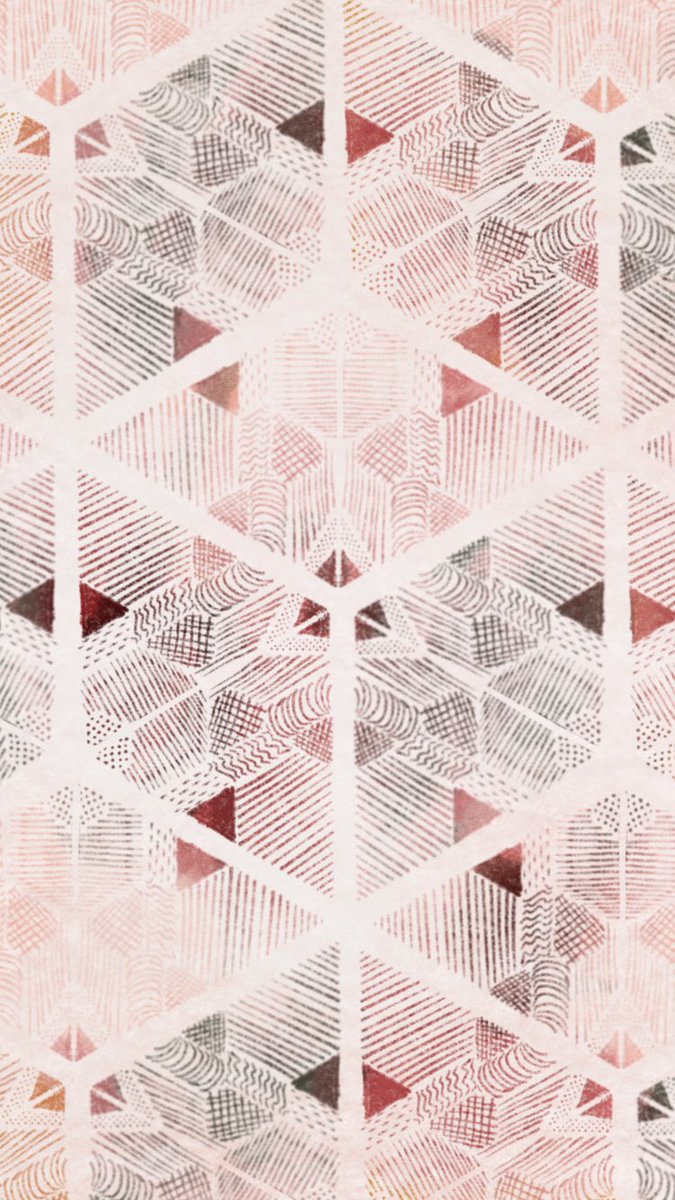 This one is for soil composition — can you see it?! I turned it into a ternary cube https://abs.twimg.com/emoji/v2/... draggable="false" alt="😅" title="Smiling face with open mouth and cold sweat" aria-label="Emoji: Smiling face with open mouth and cold sweat"> #the100dayproject #DataArt" title=" #DataVizWallpaper in 1938Ternary plothttps://abs.twimg.com/emoji/v2/... draggable="false" alt="🔺" title="Up-pointing red triangle" aria-label="Emoji: Up-pointing red triangle"> This one is for soil composition — can you see it?! I turned it into a ternary cube https://abs.twimg.com/emoji/v2/... draggable="false" alt="😅" title="Smiling face with open mouth and cold sweat" aria-label="Emoji: Smiling face with open mouth and cold sweat"> #the100dayproject #DataArt" class="img-responsive" style="max-width:100%;"/>
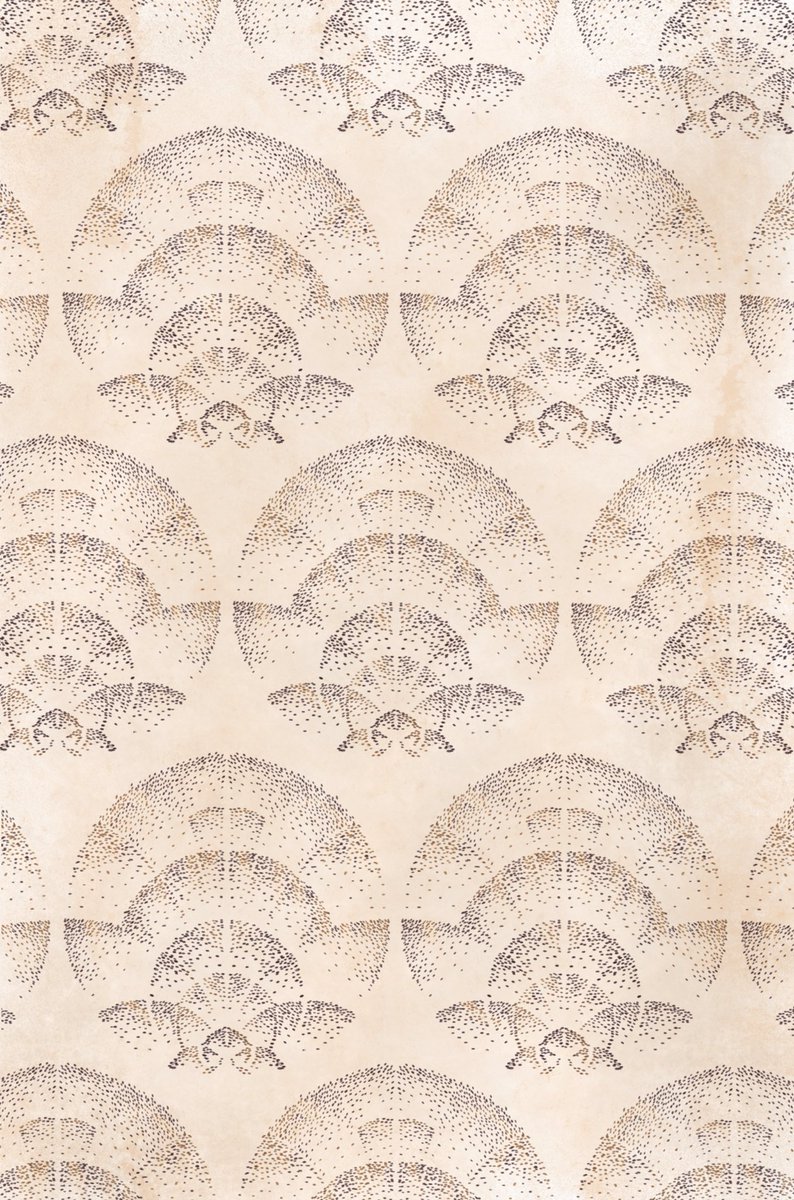 #the100dayproject #DataArt" title=" #DataVizWallpaper in 1939My take on the Smith Chart used by electrical engineers https://abs.twimg.com/emoji/v2/... draggable="false" alt="⚡️" title="High voltage sign" aria-label="Emoji: High voltage sign"> #the100dayproject #DataArt" class="img-responsive" style="max-width:100%;"/>

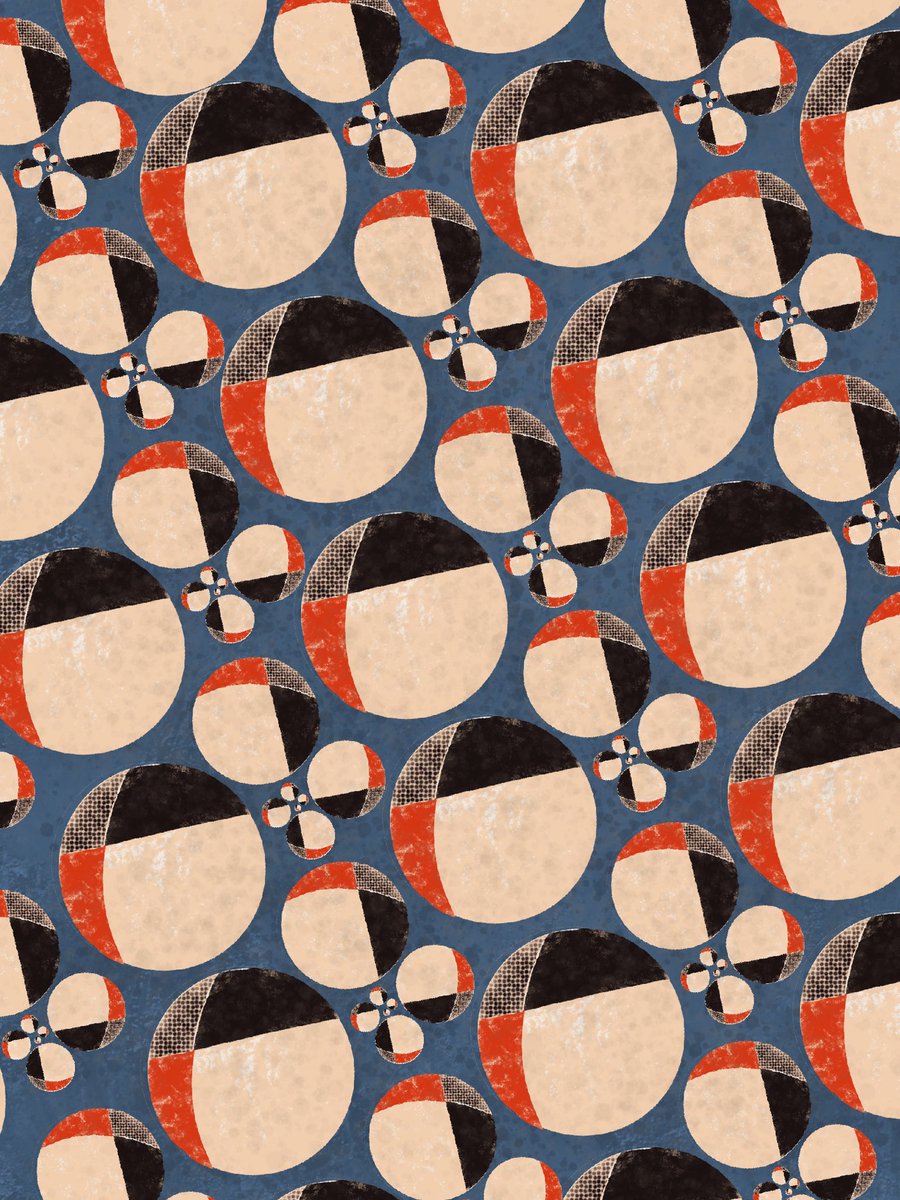 https://abs.twimg.com/emoji/v2/... draggable="false" alt="⚪️" title="White circle" aria-label="Emoji: White circle">https://abs.twimg.com/emoji/v2/... draggable="false" alt="⚪️" title="White circle" aria-label="Emoji: White circle"> #the100dayproject #DataArt" title=" #DataVizWallpaper in 1941Packed bubbleshttps://abs.twimg.com/emoji/v2/... draggable="false" alt="⚪️" title="White circle" aria-label="Emoji: White circle">https://abs.twimg.com/emoji/v2/... draggable="false" alt="⚪️" title="White circle" aria-label="Emoji: White circle">https://abs.twimg.com/emoji/v2/... draggable="false" alt="⚪️" title="White circle" aria-label="Emoji: White circle"> #the100dayproject #DataArt" class="img-responsive" style="max-width:100%;"/>
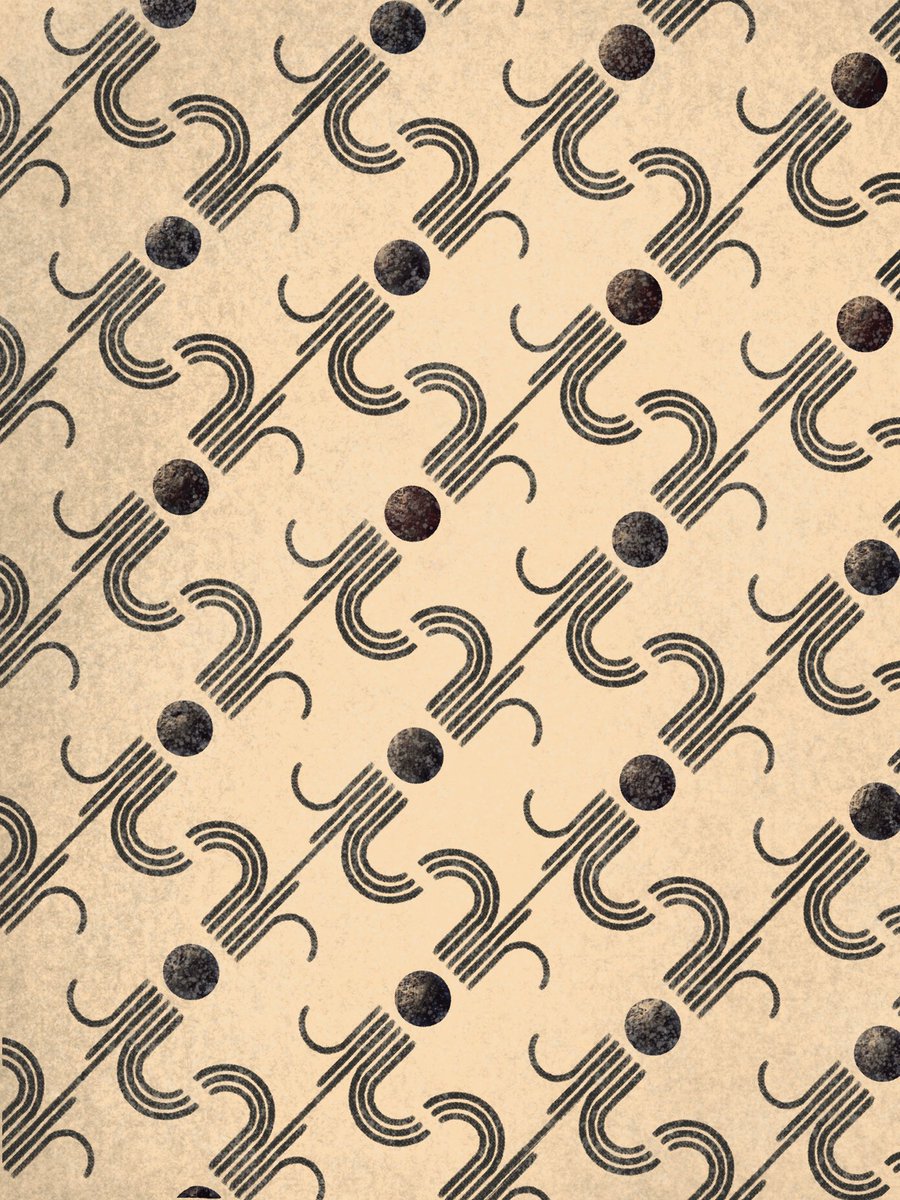 #the100dayproject #DataArt" title=" #DataVizWallpaper in 1942Sankey diagram https://abs.twimg.com/emoji/v2/... draggable="false" alt="🐍" title="Snake" aria-label="Emoji: Snake"> #the100dayproject #DataArt" class="img-responsive" style="max-width:100%;"/>
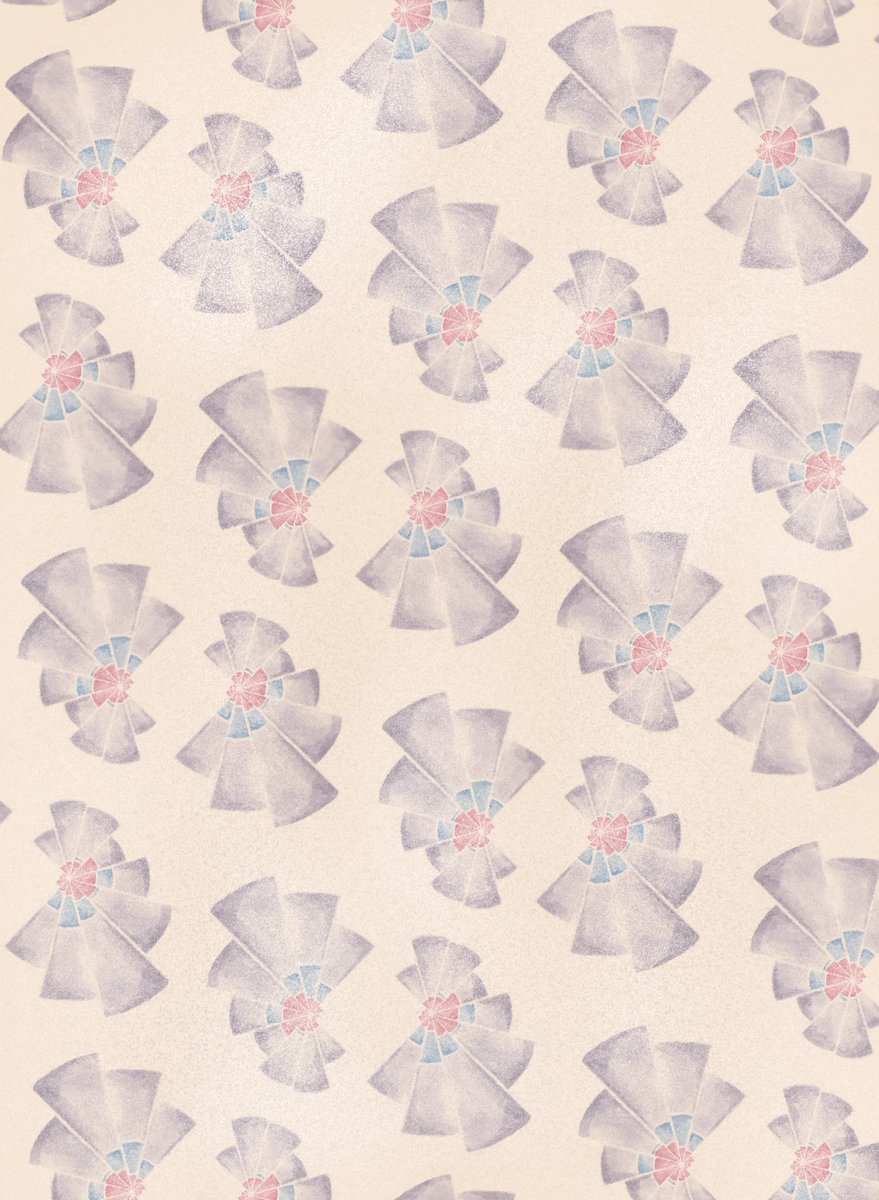 #the100dayproject #DataArt" title=" #DataVizWallpaper in 1943Nightingalehttps://abs.twimg.com/emoji/v2/... draggable="false" alt="🌸" title="Cherry blossom" aria-label="Emoji: Cherry blossom"> #the100dayproject #DataArt" class="img-responsive" style="max-width:100%;"/>
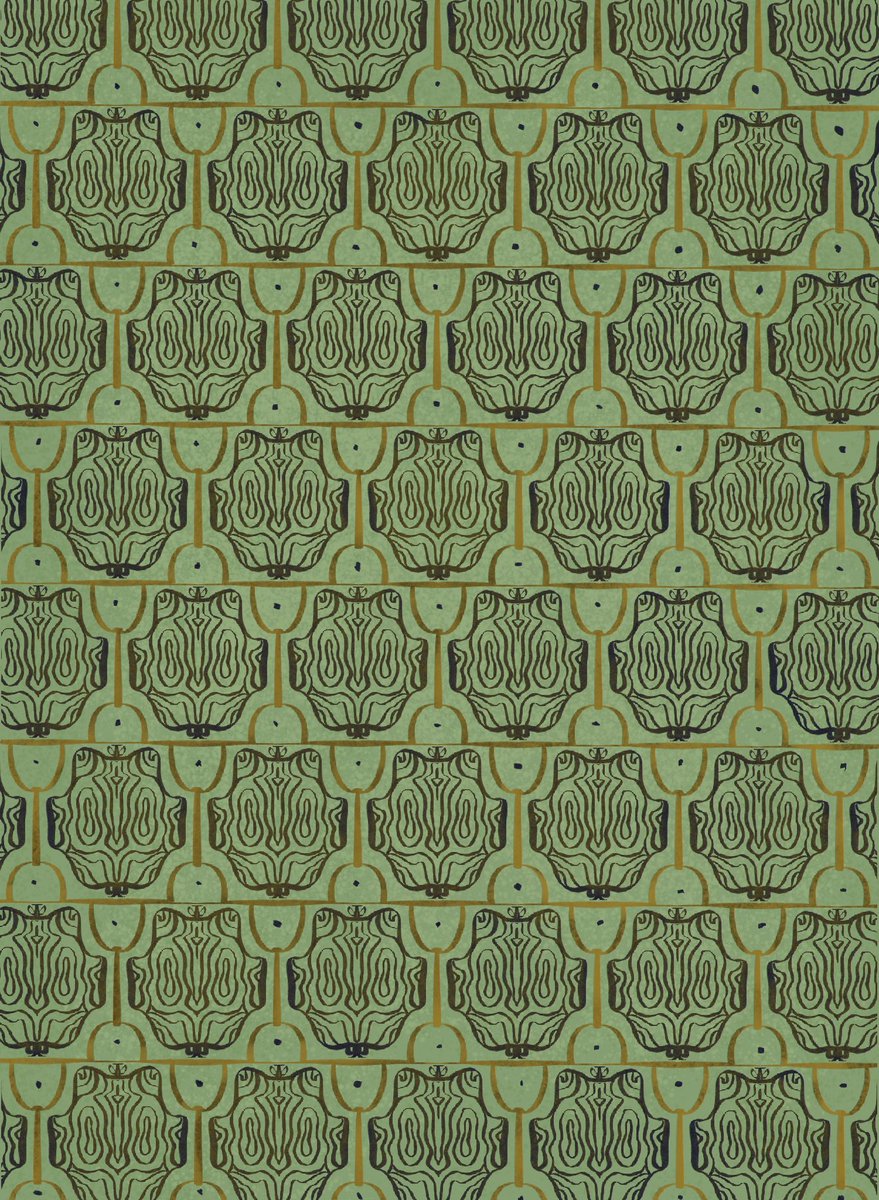 #the100dayproject #DataArt" title=" #DataVizWallpaper in 1944Contour plothttps://abs.twimg.com/emoji/v2/... draggable="false" alt="〰️" title="Wavy dash" aria-label="Emoji: Wavy dash"> #the100dayproject #DataArt" class="img-responsive" style="max-width:100%;"/>
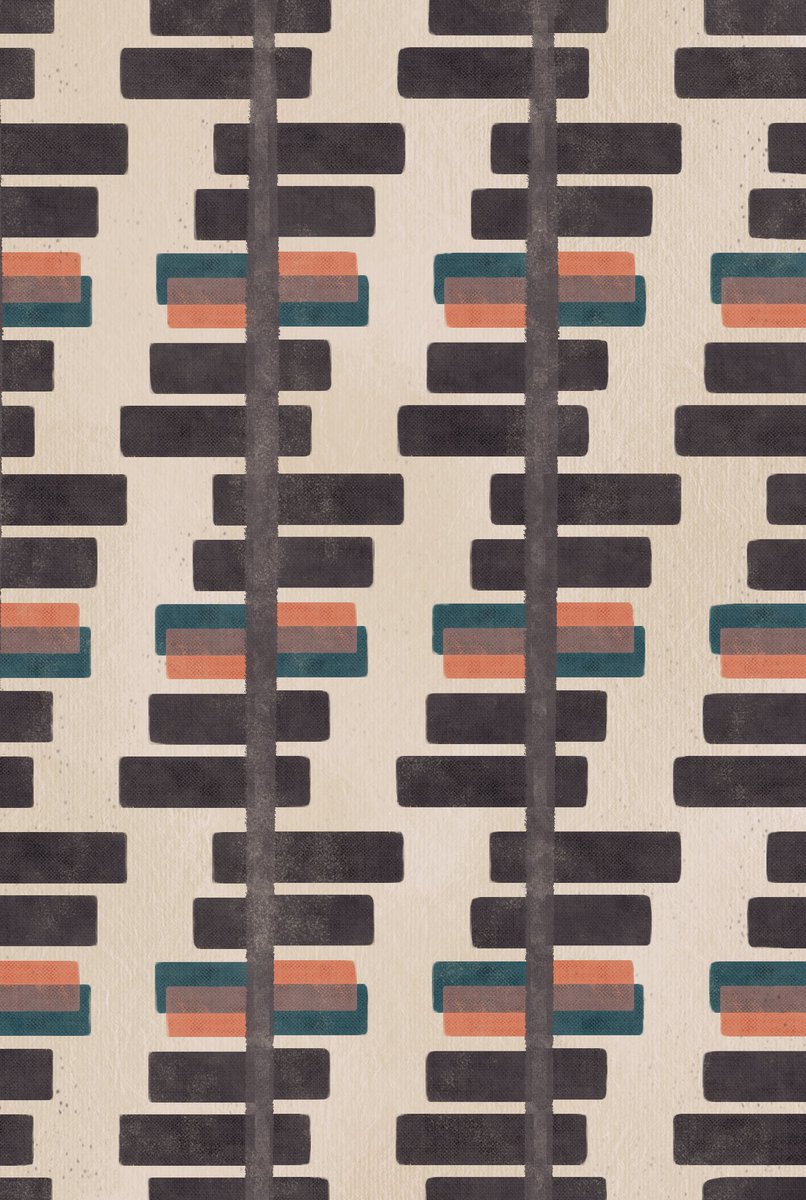 #the100dayproject #DataArt" title=" #DataVizWallpaper in 1945Bar chart race https://abs.twimg.com/emoji/v2/... draggable="false" alt="🏃♀️" title="Woman running" aria-label="Emoji: Woman running"> #the100dayproject #DataArt" class="img-responsive" style="max-width:100%;"/>
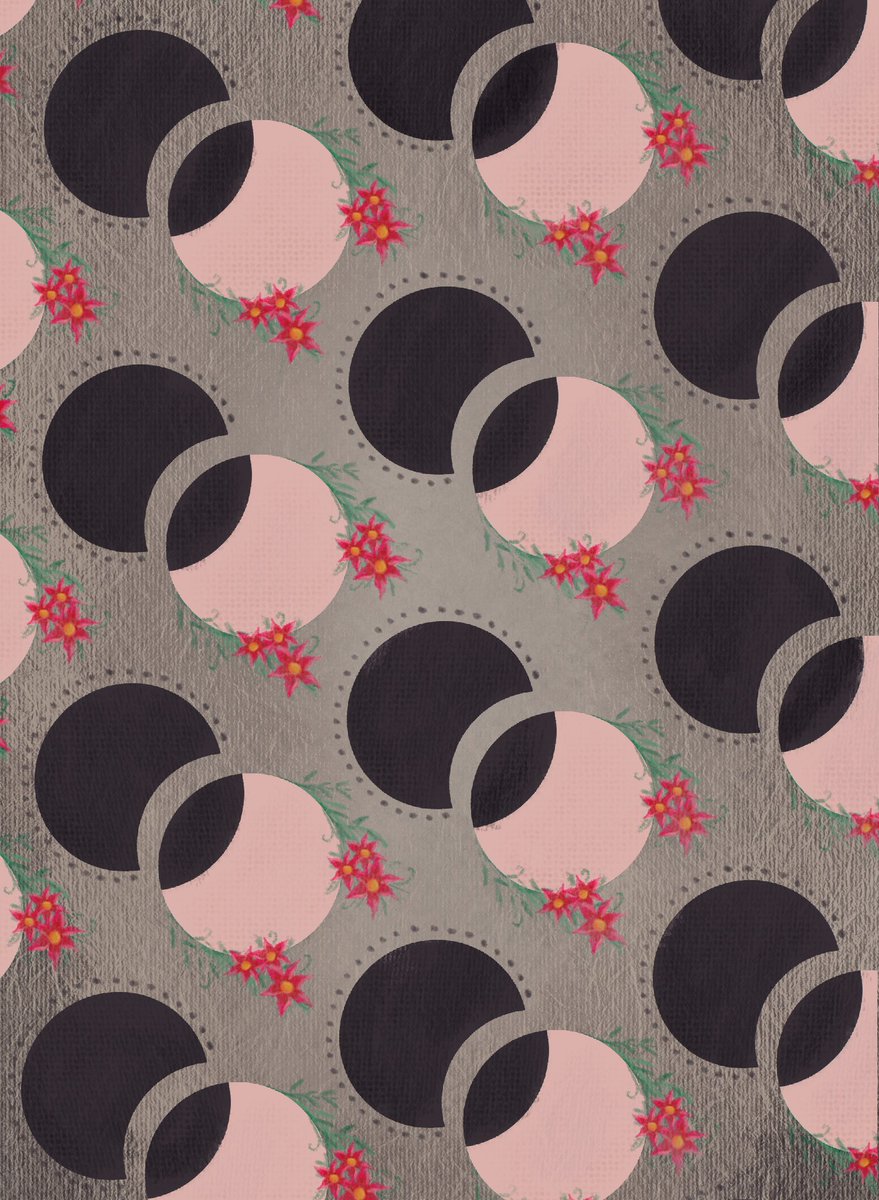 https://abs.twimg.com/emoji/v2/... draggable="false" alt="🔴" title="Red circle" aria-label="Emoji: Red circle"> #the100dayproject #DataArt" title=" #DataVizWallpaper in 1946Venn diagram https://abs.twimg.com/emoji/v2/... draggable="false" alt="⚫️" title="Black circle" aria-label="Emoji: Black circle">https://abs.twimg.com/emoji/v2/... draggable="false" alt="🔴" title="Red circle" aria-label="Emoji: Red circle"> #the100dayproject #DataArt" class="img-responsive" style="max-width:100%;"/>
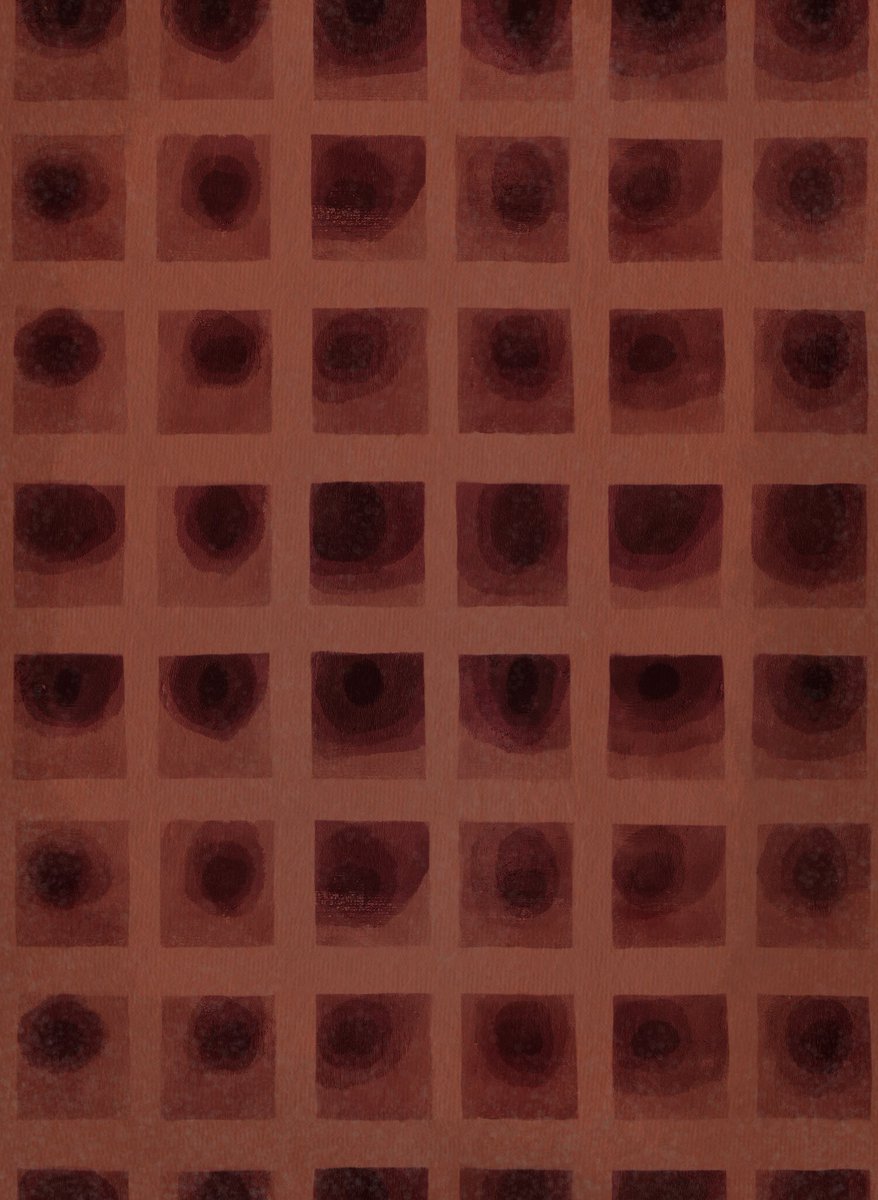 #the100dayproject #DataArt" title=" #DataVizWallpaper in 1947Small multiples of isotherms for bee colonieshttps://abs.twimg.com/emoji/v2/... draggable="false" alt="🐝" title="Honeybee" aria-label="Emoji: Honeybee"> #the100dayproject #DataArt" class="img-responsive" style="max-width:100%;"/>
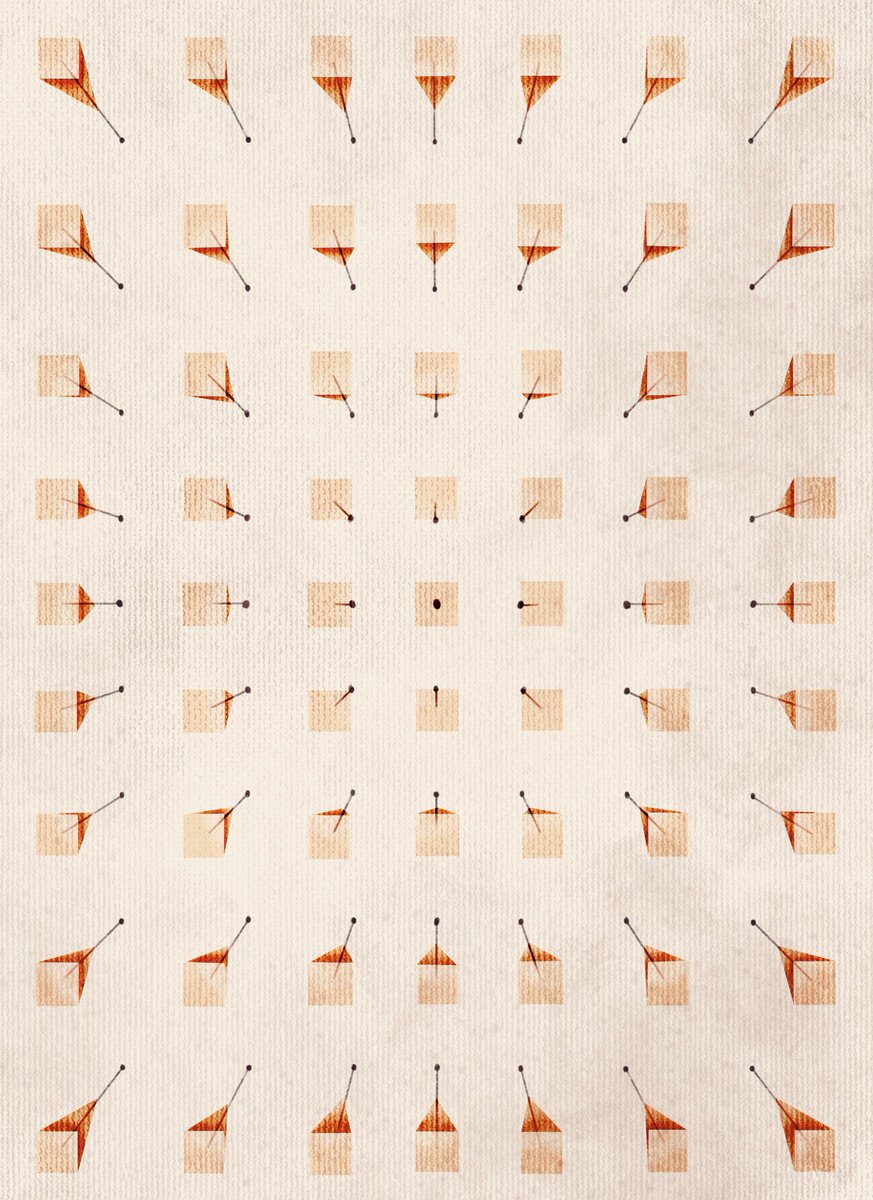 #the100dayproject #DataArt" title=" #DataVizWallpaper in 1948Different perspectives on a fan chart to show uncertainty https://abs.twimg.com/emoji/v2/... draggable="false" alt="❔" title="White question mark ornament" aria-label="Emoji: White question mark ornament"> #the100dayproject #DataArt" class="img-responsive" style="max-width:100%;"/>
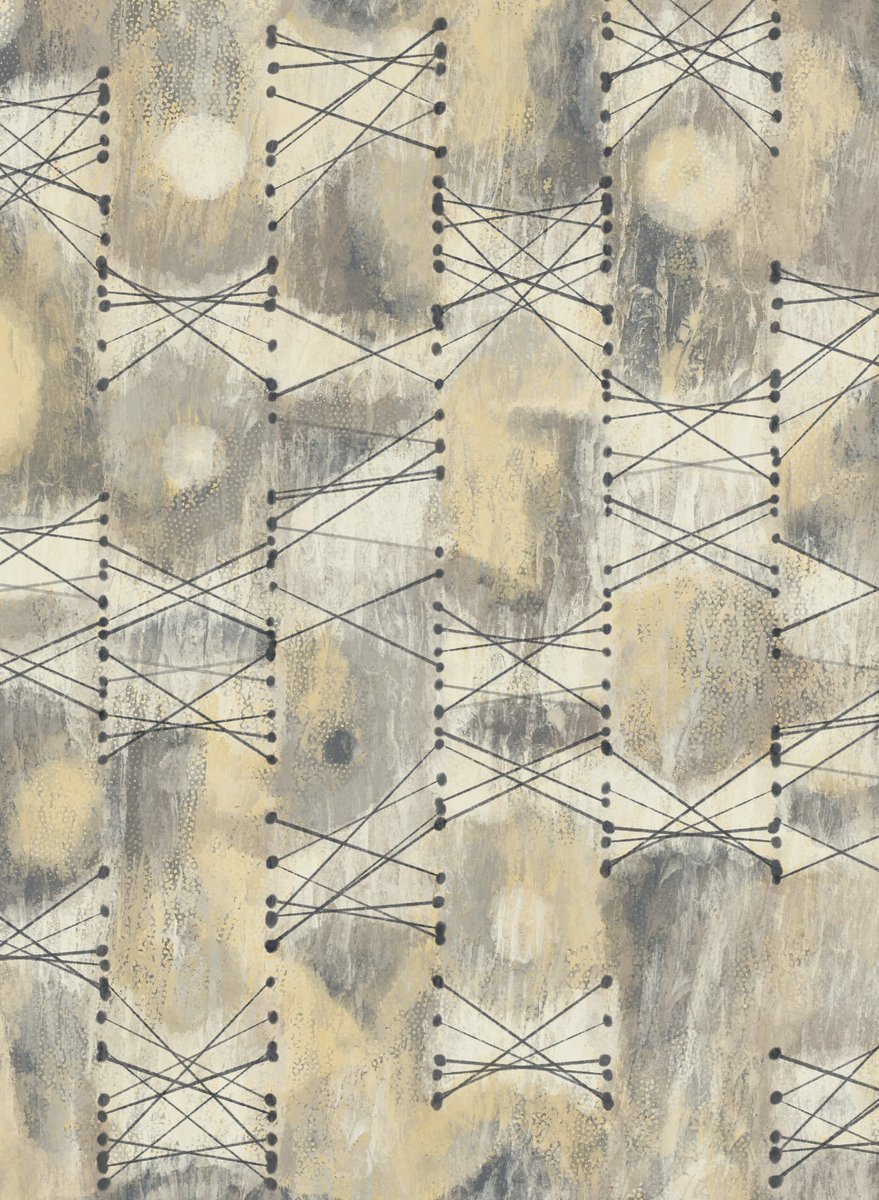 ). I love his effortless,somber whimsy ( https://www.moma.org/collectio... href="https://twtext.com//hashtag/the100dayproject"> #the100dayproject #DataArt" title=" #DataVizWallpaper in 1949Slope chart — inspired by a Picasso painting during this time. His style is very difficult to emulate (surprise!https://abs.twimg.com/emoji/v2/... draggable="false" alt="😅" title="Smiling face with open mouth and cold sweat" aria-label="Emoji: Smiling face with open mouth and cold sweat">). I love his effortless,somber whimsy ( https://www.moma.org/collectio... href="https://twtext.com//hashtag/the100dayproject"> #the100dayproject #DataArt" class="img-responsive" style="max-width:100%;"/>
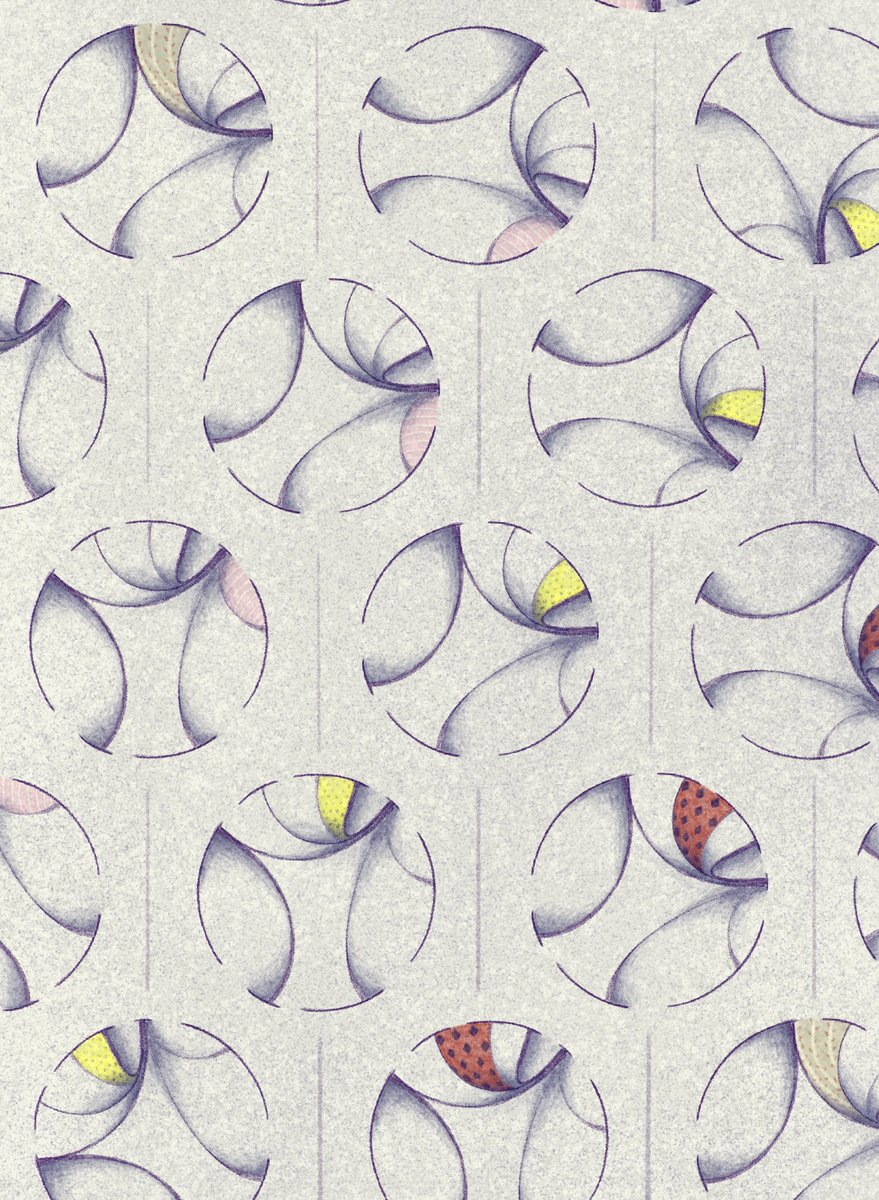 https://abs.twimg.com/emoji/v2/... draggable="false" alt="👉" title="Right pointing backhand index" aria-label="Emoji: Right pointing backhand index"> https://instagram.com/datavizto... href="https://twtext.com//hashtag/The100DayProject"> #The100DayProject #DataArt" title=" #DataVizWallpaper in 1950Starting a new decade with a chord diagram! I’m sharing more about each day’s inspo + process over on IG if you’re interested https://abs.twimg.com/emoji/v2/... draggable="false" alt="😍" title="Smiling face with heart-shaped eyes" aria-label="Emoji: Smiling face with heart-shaped eyes">https://abs.twimg.com/emoji/v2/... draggable="false" alt="👉" title="Right pointing backhand index" aria-label="Emoji: Right pointing backhand index"> https://instagram.com/datavizto... href="https://twtext.com//hashtag/The100DayProject"> #The100DayProject #DataArt" class="img-responsive" style="max-width:100%;"/>
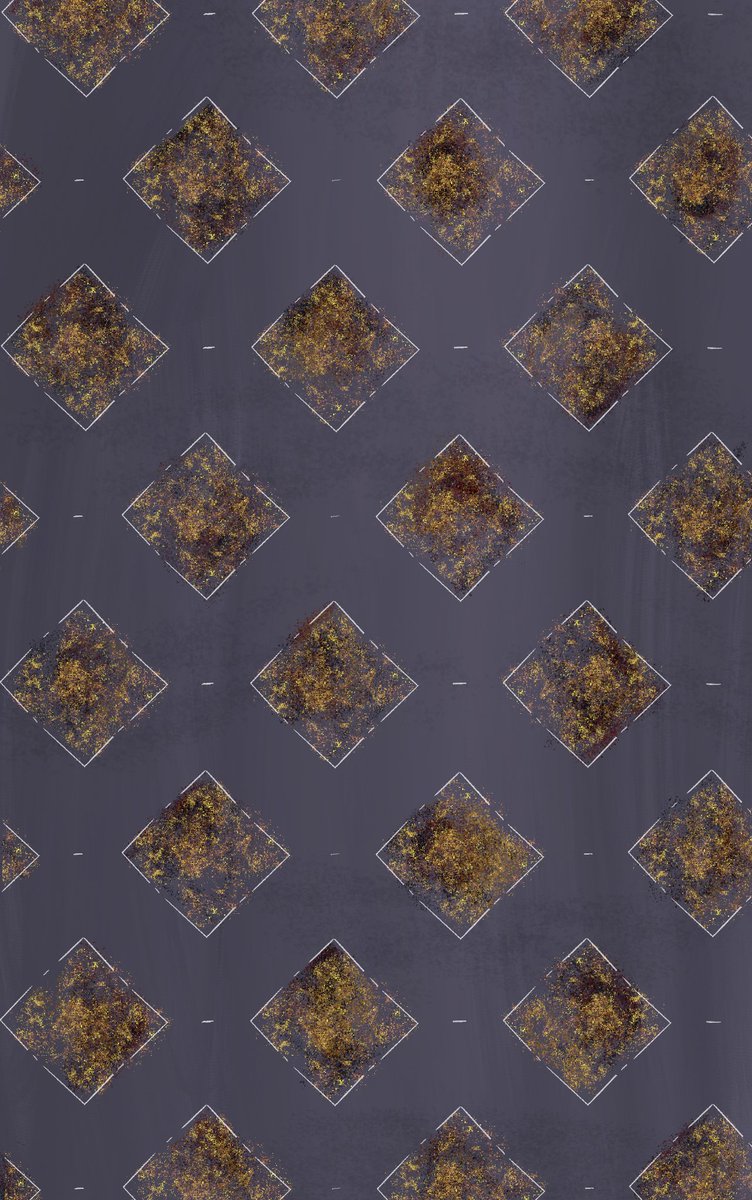 #the100dayproject #DataArt" title=" #DataVizWallpaper in 1951Little city heatmaps https://abs.twimg.com/emoji/v2/... draggable="false" alt="🌆" title="Cityscape at dusk" aria-label="Emoji: Cityscape at dusk"> #the100dayproject #DataArt" class="img-responsive" style="max-width:100%;"/>
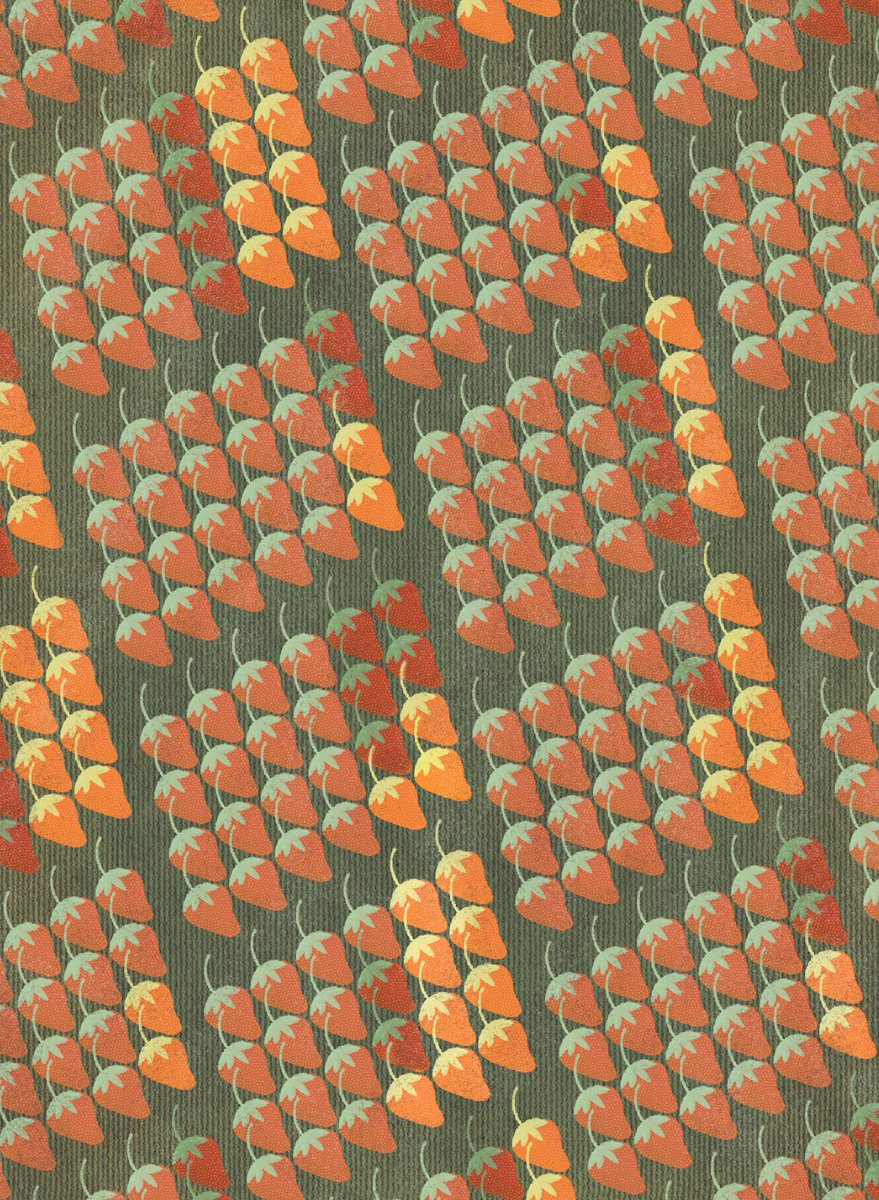 #The100DayProject #DataArt" title=" #DataVizWallpaper in 1952Strawberry isotype https://abs.twimg.com/emoji/v2/... draggable="false" alt="🍓" title="Strawberry" aria-label="Emoji: Strawberry"> #The100DayProject #DataArt" class="img-responsive" style="max-width:100%;"/>
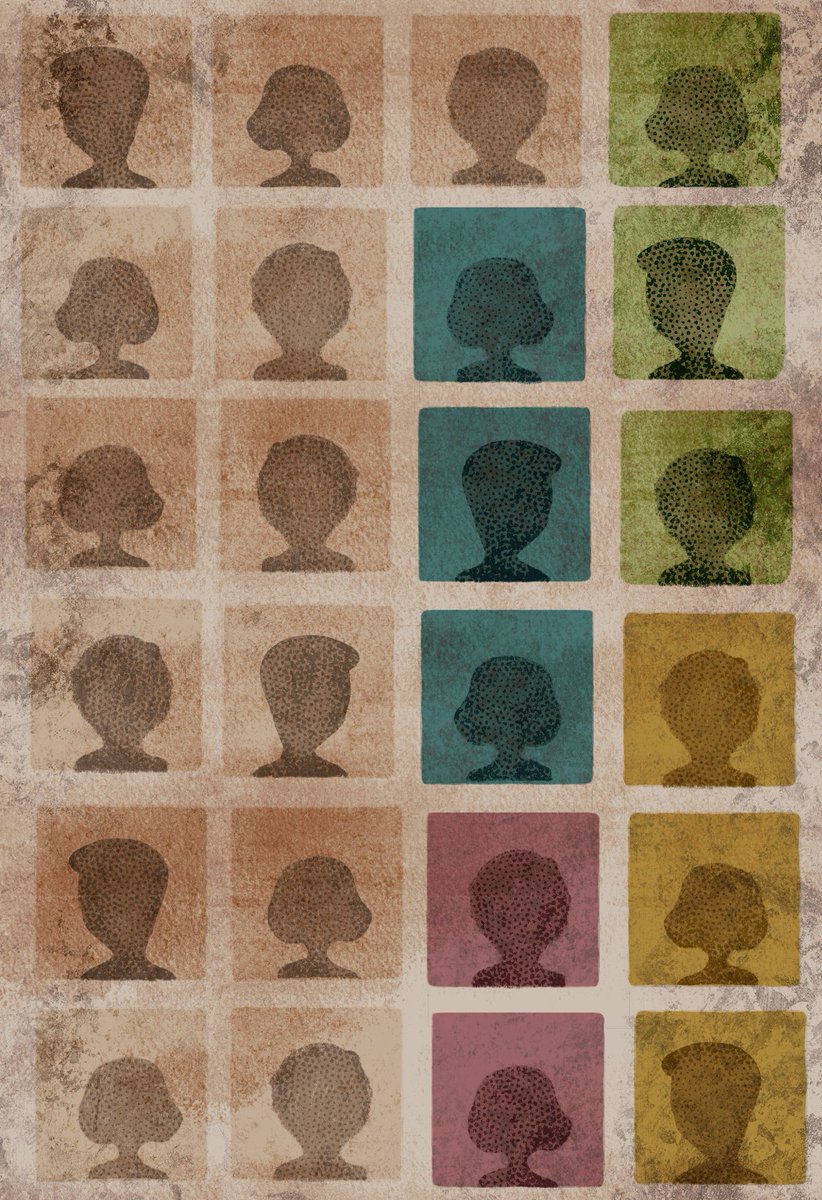 #the100dayproject #DataArt" title=" #DataVizWallpaper in 1953I took @alyssafowers’s zoomwaffles into the 50s!https://abs.twimg.com/emoji/v2/... draggable="false" alt="🧇" title="Waffle" aria-label="Emoji: Waffle"> #the100dayproject #DataArt" class="img-responsive" style="max-width:100%;"/>
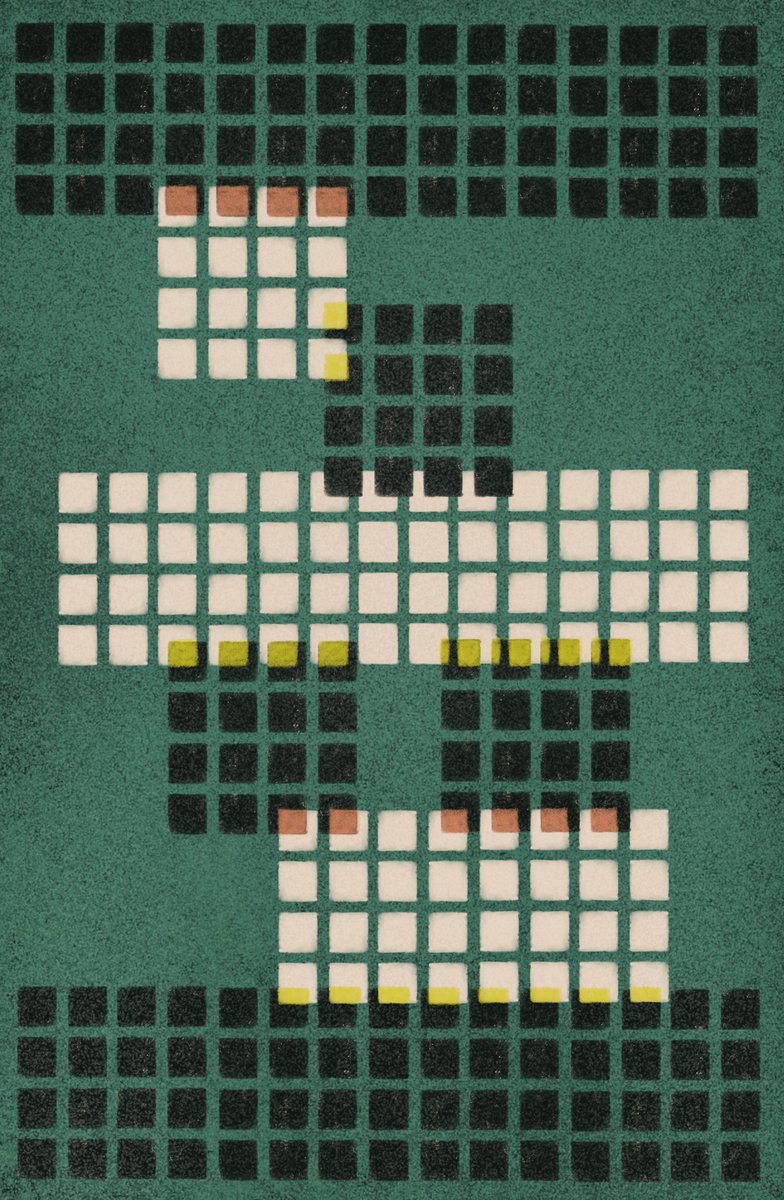 — I was inspired by an old matchstick boxhttps://abs.twimg.com/emoji/v2/... draggable="false" alt="🔥" title="Fire" aria-label="Emoji: Fire"> #the100dayproject #DataArt" title=" #DataVizWallpaper in 1954Waffle charthttps://abs.twimg.com/emoji/v2/... draggable="false" alt="🧇" title="Waffle" aria-label="Emoji: Waffle"> — I was inspired by an old matchstick boxhttps://abs.twimg.com/emoji/v2/... draggable="false" alt="🔥" title="Fire" aria-label="Emoji: Fire"> #the100dayproject #DataArt" class="img-responsive" style="max-width:100%;"/>
 #the100dayproject #DataArt" title=" #DataVizWallpaper in 1955Exploded 50s diner-style connected scatterplot https://abs.twimg.com/emoji/v2/... draggable="false" alt="😳" title="Flushed face" aria-label="Emoji: Flushed face"> #the100dayproject #DataArt" class="img-responsive" style="max-width:100%;"/>
 #the100dayproject #DataArt" title=" #DataVizWallpaper in 1956Sound waves + swallowshttps://abs.twimg.com/emoji/v2/... draggable="false" alt="✨" title="Sparkles" aria-label="Emoji: Sparkles"> #the100dayproject #DataArt" class="img-responsive" style="max-width:100%;"/>
 https://abs.twimg.com/emoji/v2/... draggable="false" alt="🏋️♀️" title="Woman lifting weights" aria-label="Emoji: Woman lifting weights"> #the100dayproject #DataArt" title=" #DataVizWallpaper in 1957Dumbbell plot inspired by a picture of @evergreendata’s desk chair that she shared with me https://abs.twimg.com/emoji/v2/... draggable="false" alt="🥰" title="Smiling face with 3 hearts" aria-label="Emoji: Smiling face with 3 hearts">https://abs.twimg.com/emoji/v2/... draggable="false" alt="🏋️♀️" title="Woman lifting weights" aria-label="Emoji: Woman lifting weights"> #the100dayproject #DataArt" class="img-responsive" style="max-width:100%;"/>
 https://abs.twimg.com/emoji/v2/... draggable="false" alt="🌿" title="Herb" aria-label="Emoji: Herb">https://abs.twimg.com/emoji/v2/... draggable="false" alt="🌾" title="Ear of rice" aria-label="Emoji: Ear of rice"> #the100dayproject #DataArt" title=" #DataVizWallpaper in 1958Bar charts in the brush https://abs.twimg.com/emoji/v2/... draggable="false" alt="📊" title="Bar chart" aria-label="Emoji: Bar chart">https://abs.twimg.com/emoji/v2/... draggable="false" alt="🌿" title="Herb" aria-label="Emoji: Herb">https://abs.twimg.com/emoji/v2/... draggable="false" alt="🌾" title="Ear of rice" aria-label="Emoji: Ear of rice"> #the100dayproject #DataArt" class="img-responsive" style="max-width:100%;"/>
 #the100dayproject #DataArt" title=" #DataVizWallpaper in 1960Frequency trails + tennis https://abs.twimg.com/emoji/v2/... draggable="false" alt="🎾" title="Tennis ball" aria-label="Emoji: Tennis ball"> #the100dayproject #DataArt" class="img-responsive" style="max-width:100%;"/>
 https://abs.twimg.com/emoji/v2/... draggable="false" alt="🍋" title="Lemon" aria-label="Emoji: Lemon"> #the100dayproject #DataArt" title=" #DataVizWallpaper in 1961Citrusy pie charts https://abs.twimg.com/emoji/v2/... draggable="false" alt="🍊" title="Tangerine" aria-label="Emoji: Tangerine">https://abs.twimg.com/emoji/v2/... draggable="false" alt="🍋" title="Lemon" aria-label="Emoji: Lemon"> #the100dayproject #DataArt" class="img-responsive" style="max-width:100%;"/>
 https://abs.twimg.com/emoji/v2/... draggable="false" alt="📊" title="Bar chart" aria-label="Emoji: Bar chart">https://abs.twimg.com/emoji/v2/... draggable="false" alt="🥳" title="Partying face" aria-label="Emoji: Partying face"> #the100dayproject #DataArt" title=" #DataVizWallpaper in 1962A corduroy chart party https://abs.twimg.com/emoji/v2/... draggable="false" alt="👖" title="Jeans" aria-label="Emoji: Jeans">https://abs.twimg.com/emoji/v2/... draggable="false" alt="📊" title="Bar chart" aria-label="Emoji: Bar chart">https://abs.twimg.com/emoji/v2/... draggable="false" alt="🥳" title="Partying face" aria-label="Emoji: Partying face"> #the100dayproject #DataArt" class="img-responsive" style="max-width:100%;"/>
 #the100dayproject #DataArt" title=" #DataVizWallpaper in 1963Isochrone! https://abs.twimg.com/emoji/v2/... draggable="false" alt="🗺" title="World map" aria-label="Emoji: World map"> #the100dayproject #DataArt" class="img-responsive" style="max-width:100%;"/>
 #the100dayproject #DataArt" title=" #DataVizWallpaper in 1964Lollipop chart https://abs.twimg.com/emoji/v2/... draggable="false" alt="🍭" title="Lollipop" aria-label="Emoji: Lollipop"> #the100dayproject #DataArt" class="img-responsive" style="max-width:100%;"/>
 I learned that these are used to represent wind speed & direction in graphical form. Design inspo & time lapse in threadhttps://abs.twimg.com/emoji/v2/... draggable="false" alt="🤗" title="Hugging face" aria-label="Emoji: Hugging face">https://abs.twimg.com/emoji/v2/... draggable="false" alt="👇" title="Down pointing backhand index" aria-label="Emoji: Down pointing backhand index"> #the100dayproject #dataart" title=" #DataVizWallpaper in 1966Wind barbs https://abs.twimg.com/emoji/v2/... draggable="false" alt="🌬" title="Wind blowing face" aria-label="Emoji: Wind blowing face"> I learned that these are used to represent wind speed & direction in graphical form. Design inspo & time lapse in threadhttps://abs.twimg.com/emoji/v2/... draggable="false" alt="🤗" title="Hugging face" aria-label="Emoji: Hugging face">https://abs.twimg.com/emoji/v2/... draggable="false" alt="👇" title="Down pointing backhand index" aria-label="Emoji: Down pointing backhand index"> #the100dayproject #dataart" class="img-responsive" style="max-width:100%;"/>
 https://abs.twimg.com/emoji/v2/... draggable="false" alt="🦴" title="Bone" aria-label="Emoji: Bone"> #the100dayproject #dataart" title=" #DataVizWallpaper in 1967I can see this as studio wallpaper for a band called “Clavicle and the Floating Ribs” https://abs.twimg.com/emoji/v2/... draggable="false" alt="😂" title="Face with tears of joy" aria-label="Emoji: Face with tears of joy">https://abs.twimg.com/emoji/v2/... draggable="false" alt="🦴" title="Bone" aria-label="Emoji: Bone"> #the100dayproject #dataart" class="img-responsive" style="max-width:100%;"/>
 #the100dayproject #DataArt" title=" #DataVizWallpaper in 1968Cartogram balloons https://abs.twimg.com/emoji/v2/... draggable="false" alt="🎈" title="Balloon" aria-label="Emoji: Balloon"> #the100dayproject #DataArt" class="img-responsive" style="max-width:100%;"/>
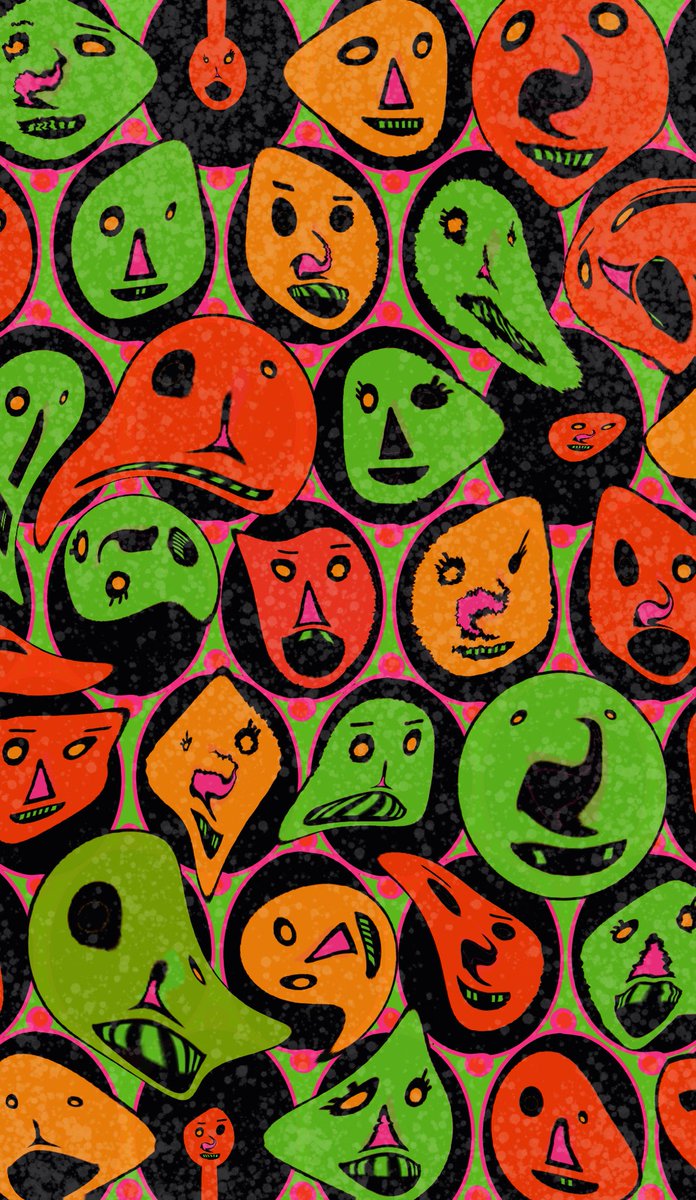 my 6 yro laughed so hard watching me draw this https://abs.twimg.com/emoji/v2/... draggable="false" alt="🤣" title="Rolling on the floor laughing" aria-label="Emoji: Rolling on the floor laughing"> #the100dayproject #DataArt" title=" #DataVizWallpaper in 1969Trippy Chernoff faces https://abs.twimg.com/emoji/v2/... draggable="false" alt="👹" title="Japanese ogre" aria-label="Emoji: Japanese ogre"> my 6 yro laughed so hard watching me draw this https://abs.twimg.com/emoji/v2/... draggable="false" alt="🤣" title="Rolling on the floor laughing" aria-label="Emoji: Rolling on the floor laughing"> #the100dayproject #DataArt" class="img-responsive" style="max-width:100%;"/>
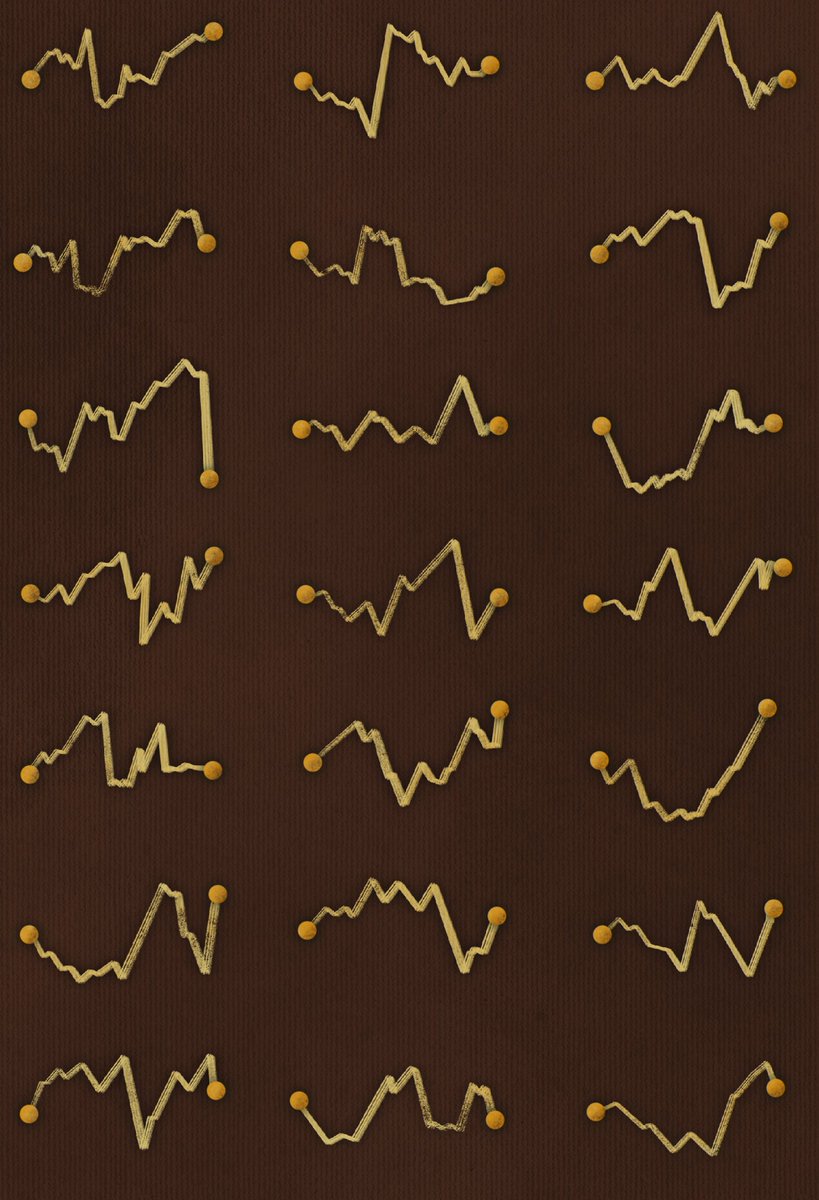 #the100dayproject #dataart" title=" #DataVizWallpaper in 1970Sparklines https://abs.twimg.com/emoji/v2/... draggable="false" alt="〽️" title="Part alternation mark" aria-label="Emoji: Part alternation mark"> #the100dayproject #dataart" class="img-responsive" style="max-width:100%;"/>


