Today we released a brief on how North Carolina’s healthcare system can handle a surge from COVID-19 under various conditions through June 1. One link is here: https://www.shepscenter.unc.edu/2020/04/06/covid-19-north-carolina-collaborative/">https://www.shepscenter.unc.edu/2020/04/0...
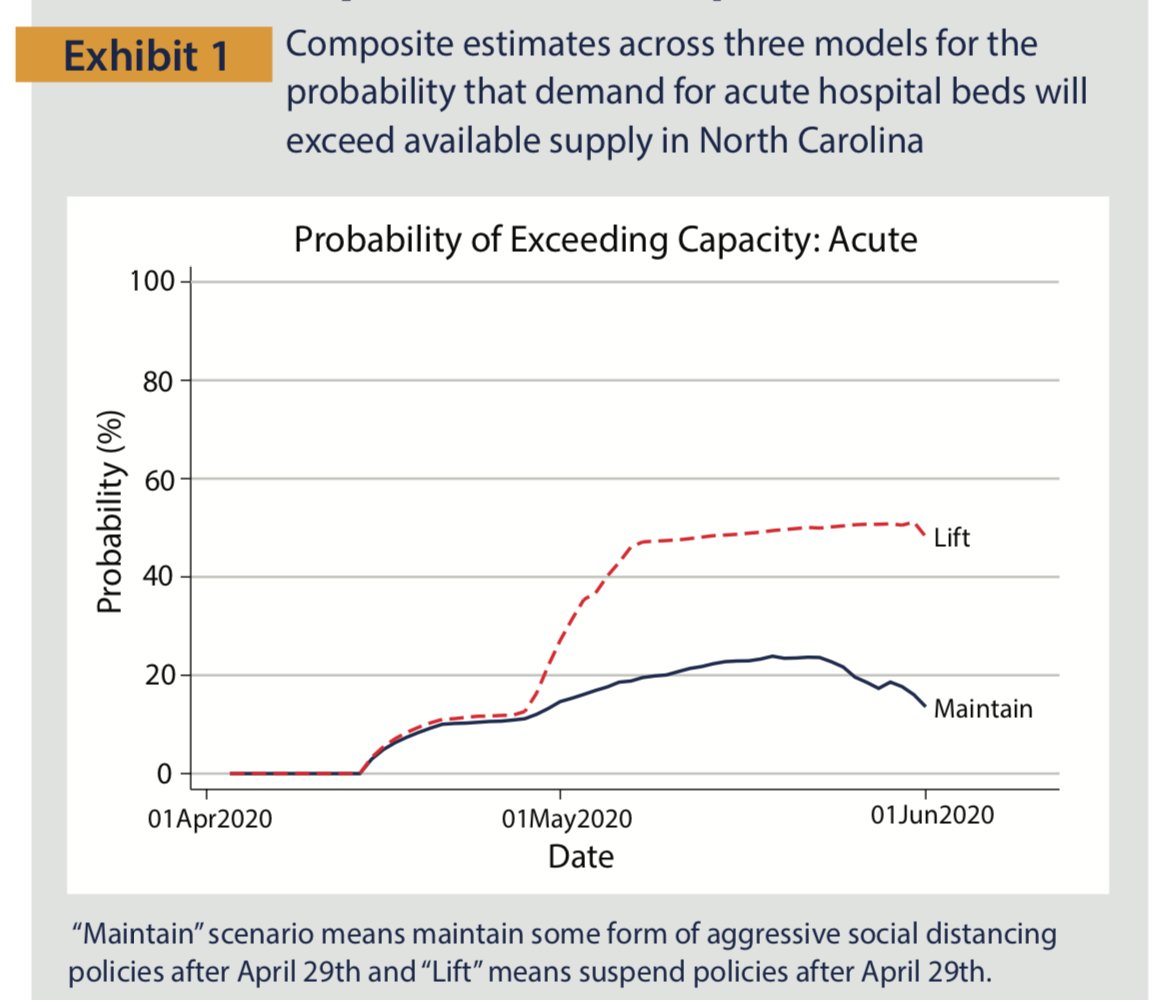
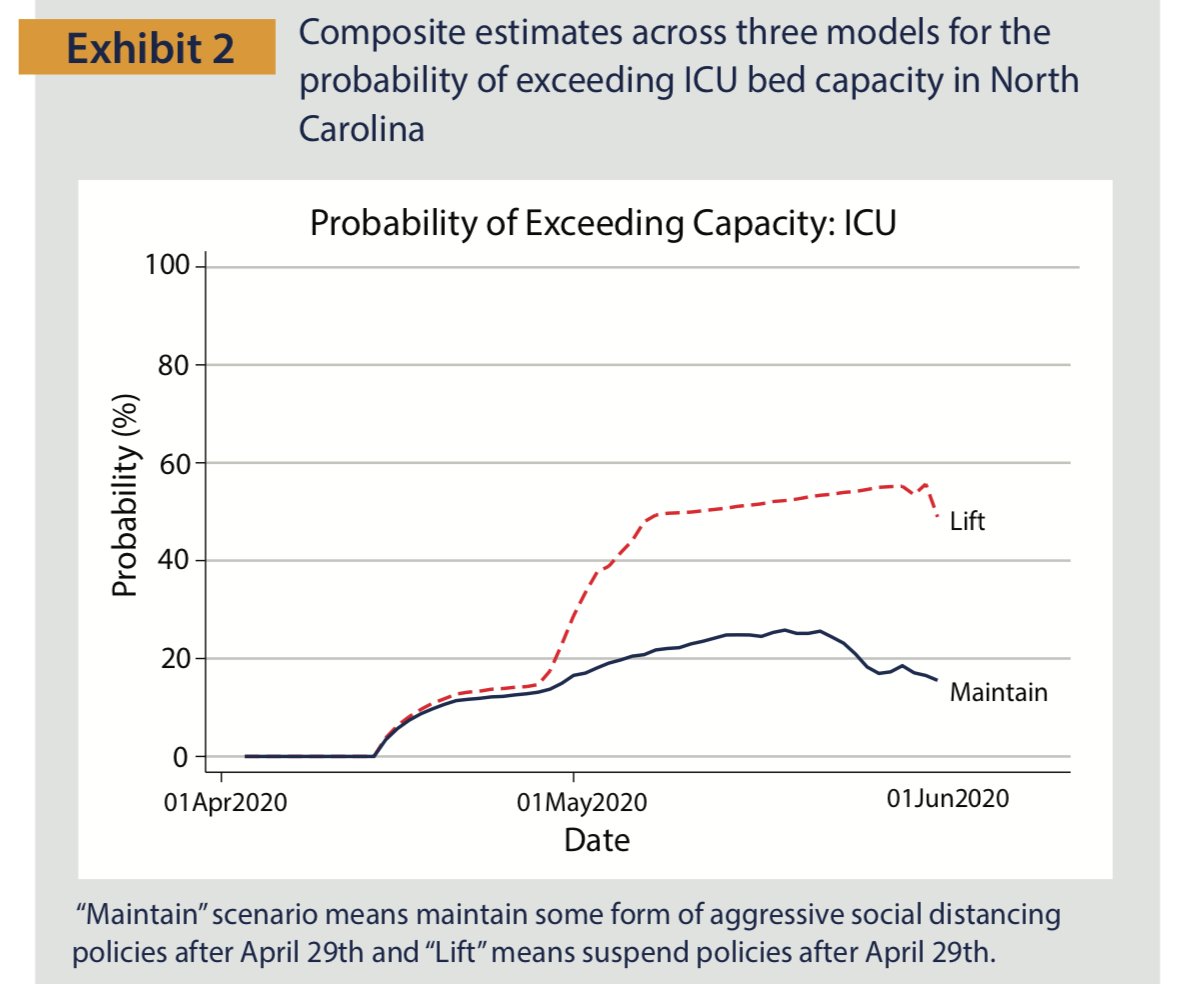
We modeled two social distancing policies: 1) maintain policies that has transmission rates similar to current stay at home order 2) lift all social distancing policies. (“Maintain” and “Lift”, respectively)
We also modeled a surge for both acute and ICU beds of 20 percent and 50 percent. These represent substantial increases (current stock = 20K and 3K, respectively); finding the healthy, qualified medical staff necessary to support these increases may be a challenge.
Our primary outcome was the probability that the healthcare system is unable to meet the necessary healthcare services – that there is a shortage. We felt this best capture the uncertain nature of what we are facing.
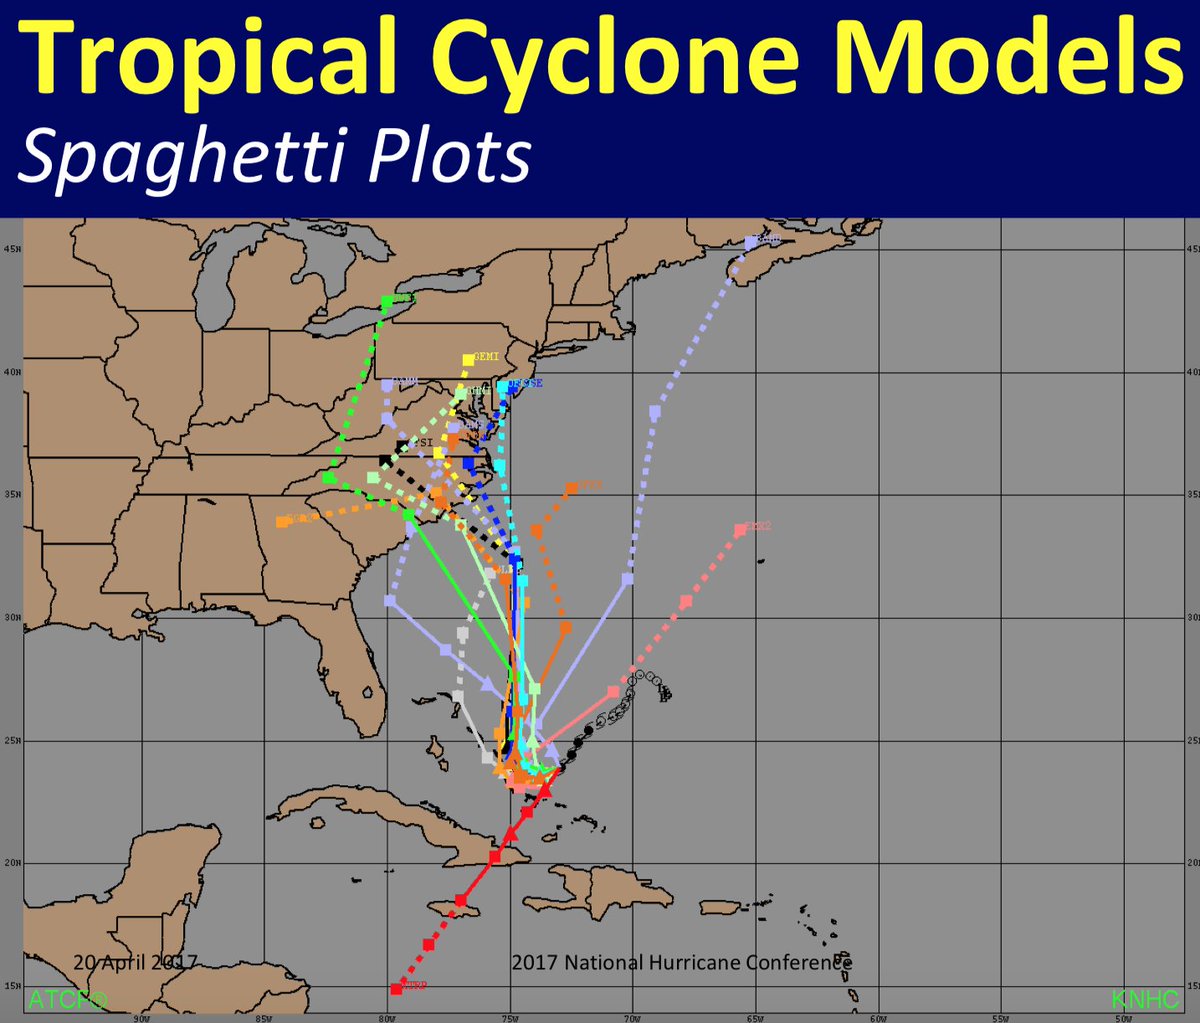
We blended results from three different models developed by three different teams. The paradigm is that of the “spaghetti plots” with which those in the Southeastern United States are likely familiar – assessing the spread of various models to look for consensus.
We draw a lot from the hurricane analogy. It works pretty well in North Carolina, but one key difference is that with COVID-19, we have the ability to alter the path of the hurricane through policy and response.
Key Findings: 1) If we Maintain, there is a 20 percent chance that we face a shortage of acute beds in May. If we Lift, there is over a 50 percent chance. Thus, if we Lift policies on April 29, we may face pressure on our healthcare system’s ability to meet acute bed needs.
Key Findings: 2) If we Maintain, there is a 30 percent chance that we face a shortage of acute beds in May. If we Lift, there is over a 60 percent chance. Thus, if we Lift policies on April 29, we may face pressure on our healthcare system’s ability to meet acute bed needs.
Key Findings: 3) Surges in capacity help, but are not sufficient to guarantee we can meet our system’s demands. A twenty percent surge, for example, reduces the probability of a shortage by 2-4 percentage points.
One thing that is not evident in our analysis is that all three models predict that, given what we know now, a relaxed social distancing policy (allowing the virus to spread at its natural transmission rate) would very likely stress the system, they just differ in timing.
In other words, one model thinks a big “hurricane” will hit in May but not in June. Another thinks it will hit in June but not May. On avg, they predict 50% chance of hitting in May and a 50% in June. But both think it will hit if we relax social distancing. But when?
We project 250K (Maintain) and 750K (Lift) cumulative infected by the end of May. These numbers may seem high given our confirmed case count of ~2500, but a) we know some cases are asymptomatic/untested and b) power of doubling is difficult to really comprehend.
Caveats: 1) All modeling is conditional on what we know about the transmission of SARS-Cov-2. Lots of uncertainty and knowledge grows every day. 2) we strictly have a public health lens and are not considering the tradeoffs in response policy; that is for policymakers to decide.
About us: we (epidemiologists, health services and policy researchers) formed a loose collaborative three weeks ago. Team shown in image. Tweeps (in no order): @a_mckethan @PharmDJD @BreskinEpi @alanbrookh @SaraLevintow @gmarkholmes
@kim_powers @sk_rhea @scottheiser
\fin
@kim_powers @sk_rhea @scottheiser
\fin

 Read on Twitter


