Use of care/mortality due to corona in Finland, Sweden, Norway, Denmark, Iceland and Estonia; data from yesterday 5.4 reports.
Read through the thread. (English version)
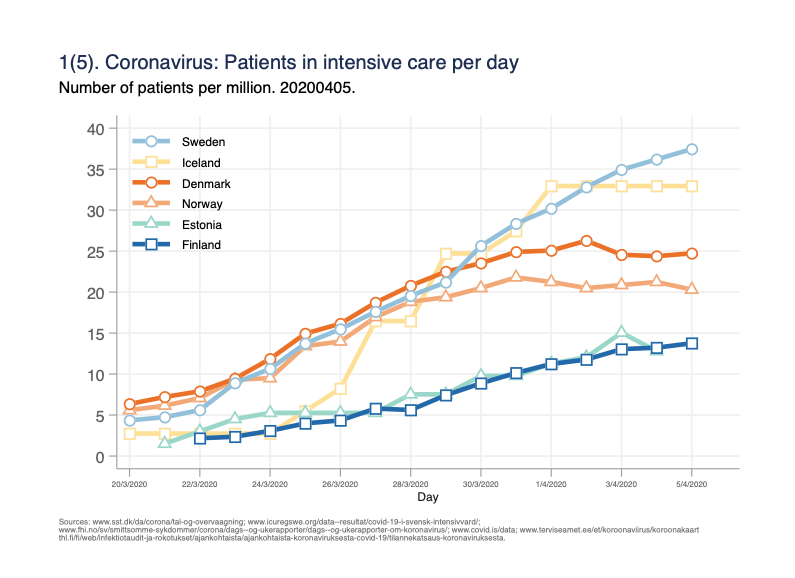
Fig 1. Number of persons in intensive care per day. Measures the burden on intensive care capacity. 1/x
Read through the thread. (English version)
Fig 1. Number of persons in intensive care per day. Measures the burden on intensive care capacity. 1/x
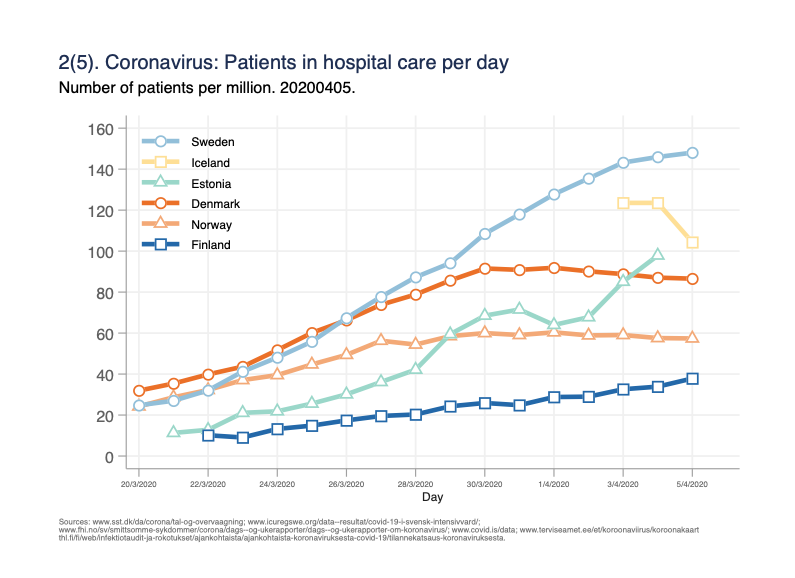
Fig 2. Number of persons in hospital care per day. One person can be counted for several days. A measurement on the burden on hospital capacity. 2/
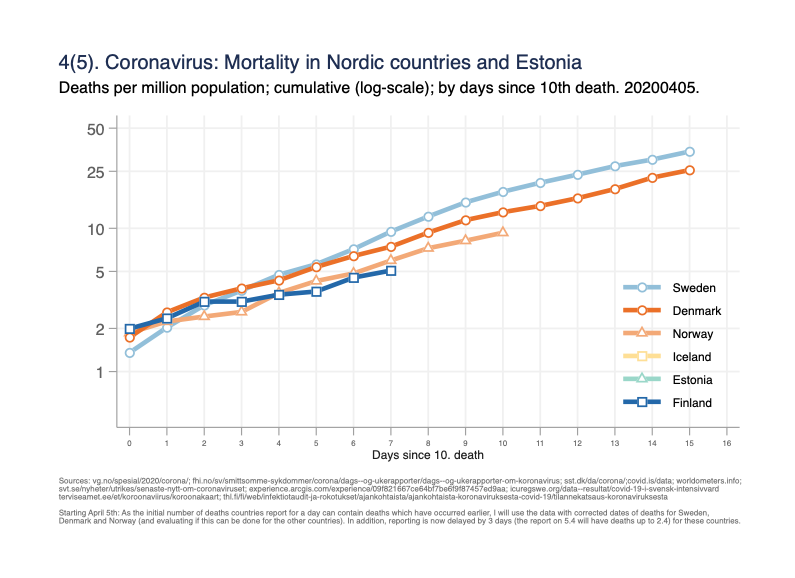
Fig 4. Mortality per million population on log-scale, by days since 10th death.
Same data as fig 3, but y-axis helps to understand rate of change, and time-scale unified. 4/
Same data as fig 3, but y-axis helps to understand rate of change, and time-scale unified. 4/
Fig 5(5). Absolute number of deaths by days since 10th death in the country.
(Attempts to get same starting point/phase of the epidemic for all countries. 5/x
(Attempts to get same starting point/phase of the epidemic for all countries. 5/x
Figs 1 and 2; number of persons in care per day; Norway and Denmark (and Iceland?) are still levelling off. 6/
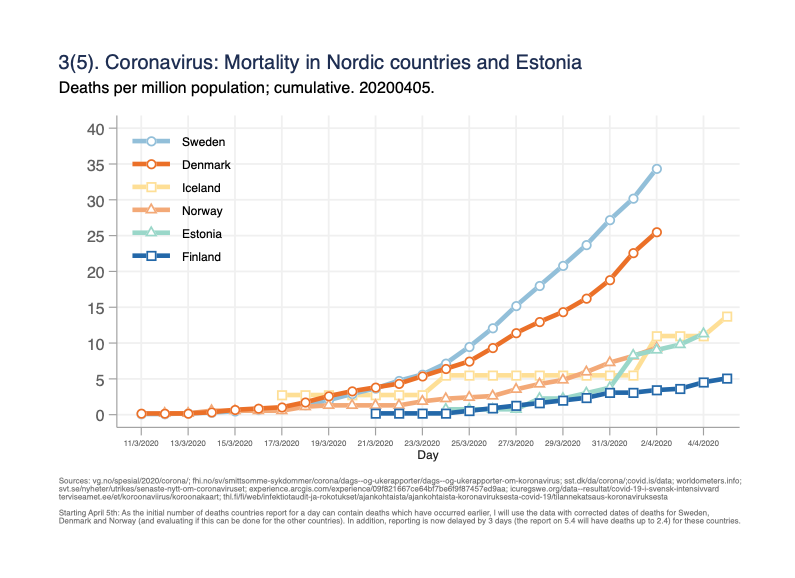
Mortality data: The initial number of deaths countries report for a day can contain deaths which occurred much earlier, and on the other hand lack some recent deaths.
Starting now, I will use the official corrected dates of deaths for Swe, Nor, Den; and 7/
Starting now, I will use the official corrected dates of deaths for Swe, Nor, Den; and 7/
my reporting is now delayed for 3 days (the report on 5.4 will have deaths up to 2.4) for these countries. Otherwise there will be bias and it is difficult to evaluate how large that is.
Note that all(?) international databases use uncorrected data, and this will I think 8/
Note that all(?) international databases use uncorrected data, and this will I think 8/
exaggerate the estimates of rate of increase for later time points for countries with this issue in reporting. (Maybe all countries have this problem?) 9/9

 Read on Twitter


