Another day, another round of COVID data.
But let& #39;s start with all-cause weekly mortality. There& #39;s been some hubbub around this data because it shows deaths WAY DOWN in the latest week for the nation on the whole.
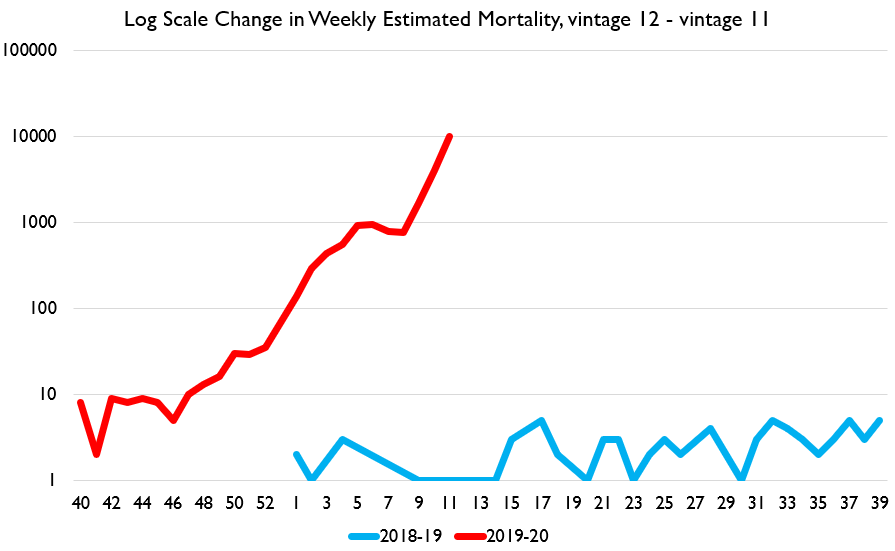
So here& #39;s the *revision size* of deaths for each week.
But let& #39;s start with all-cause weekly mortality. There& #39;s been some hubbub around this data because it shows deaths WAY DOWN in the latest week for the nation on the whole.
So here& #39;s the *revision size* of deaths for each week.
What I want you to notice is that there are still revisions reaching back to the *first week of 2019*.
This revision pattern is entirely normal. It& #39;s very typical for early release data to undershoot the final number by 15,000 deaths or more. Given that an average month is just 45-60k, that& #39;s a very large undershoot!
What is also clear here is that it takes about 8-16 weeks for nationwide data to become a reliable metric of total deaths.
Some states report very quickly. New York has very rapid death-reporting, which is very helpful. But you simply cannot take CDC& #39;s "100% complete" indicator to indicate that reporting is over. It just means normal mortality levels have been reached.
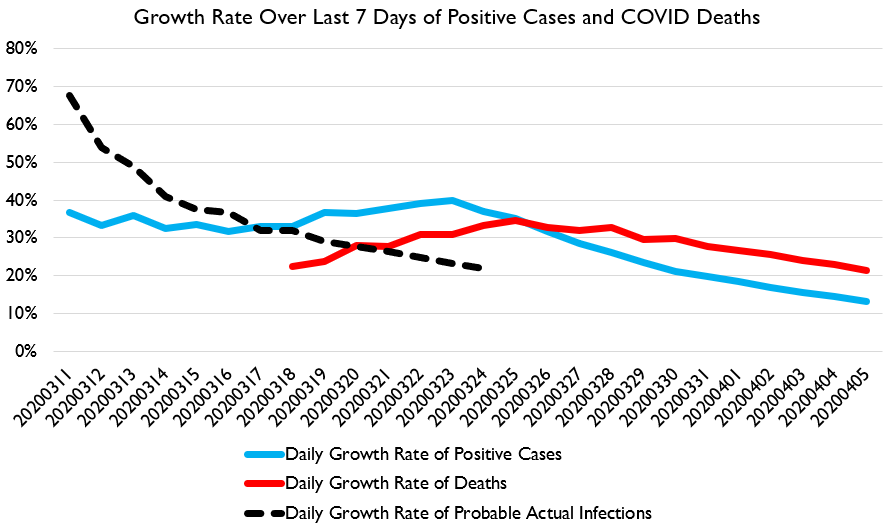
Next up, my preferred chart for the US: lagged daily growth in confirmed cases, confirmed deaths, and retrospective likely positives continues to decline. Yay!
Now, another hubbub recently has been about how many people will die.
There are a lot of ways to calculate this. The expert-preferred way is to use what& #39;s called a SEIR or SIR model. These are very nice workhorse models of how epidemics spread.
There are a lot of ways to calculate this. The expert-preferred way is to use what& #39;s called a SEIR or SIR model. These are very nice workhorse models of how epidemics spread.
HOWEVER, SEIR models don& #39;t *actually* have fantastic predictive accuracy, because, well.... they& #39;re models. Not forecasts. You have to feed in a very large number of assumptions about spread rate, hospitalization rate, etc. A typical SEIR has 5-15 different parameters.
Which is great for modeling! You can model stuff very precisely!
But the experience of these models is that getting all of those parameters "right" is hard, and so getting a correct forecast is hard.
But the experience of these models is that getting all of those parameters "right" is hard, and so getting a correct forecast is hard.
Sometimes, simpler is better. My preferred way to "think about" how to forecast deaths is to look at recent changes in deaths, and assume future changes are some function of past changes.
So here& #39;s the "rate of increase in total deaths" graph, associating rates with total deaths.
Because the latest weekend data came in quite low (yay!), we are now on course for something like 50-100k confirmed COVID deaths.
Because the latest weekend data came in quite low (yay!), we are now on course for something like 50-100k confirmed COVID deaths.
However, a caution!
Weekend deaths came in really optimistic last weekend too, and then spiked again during the weekdays. Data is generated by humans and humans don& #39;t work as much on weekends.
Weekend deaths came in really optimistic last weekend too, and then spiked again during the weekdays. Data is generated by humans and humans don& #39;t work as much on weekends.
And what& #39;s striking is that we could have deaths increase at ***lower*** than the present rate through May, and then rapidly decline to zero after that, and we would *still* end up with 2 million deaths.
The only path to low deaths is continue the recent and fairly break-neck pace of declining growth rates in mortality. Which means we need the absolute numbers of deaths per day to not rise above 1500 or so.
I hope the US will achieve that! But we& #39;ll see how this week goes.
In the meantime, early indications are, if anything, a bit pessimistic. We got (relatively complete) New York data for week 12. Reported COVID deaths in week 14 in New York amounted to almost 100% of seasonally normal deaths in that week.
Even assuming 20% of COVID deaths would have happened anyways, and making modest accountings for likely revisions to latest weeks, New York (city + state) is going to experience an extraordinary spike in deaths.
The red dashed line is more-or-less guaranteed unless the COVID numbers are WILDLY overstated, or if baseline deaths fell by some astonishing amount.
Speaking of falling baseline: I don& #39;t think we need to worry about avoidance. If avoidance successfullyr educed other deaths, then that "counts." What matters is "how much damage did a disease do." https://twitter.com/JDVance1/status/1247002955536097280">https://twitter.com/JDVance1/...
Saying, "well ACTUALLY this disease would have killed millions but we have modern medicine" is silly: the point is the disease was less disruptive than it might have been because we have medicine.
Likewise, if social distancing reduces deaths, then it was a less severe issue!
Likewise, if social distancing reduces deaths, then it was a less severe issue!
I would say that the sufficient criterion for assessing the impact of COVID is change in all-cause mortality + spike in unemployment.
In many historic epidemics, the leading killer was famine or murder, not disease. In Ecuador, India, and the Philippines, that may happen again in some places. The effect of COVID simply "is" the spike in all-cause mortality.
After Hurricane Maria, there was dithering and quibbling over how many people should be counted as killed by the hurricane. This is idiotic. We know how many people died in a window of time, and about how many people would have died based on seasonality and population traits.
The delta between those two is how many people the crisis killed. It just is. However you want to label it you can& #39;t escape the basic facts of excess mortality.
(Sidenote: I QT& #39;d @JDVance1 here because he& #39;s a friend presenting this question honestly and in good faith, not as a criticism of him)
Any government that fully normalizes before May is committing crimes against humanity. https://twitter.com/JDVance1/status/1247013098592112641">https://twitter.com/JDVance1/...
Cannot state this clearly enough.
I STRONGLY oppose strict lockdowns.
But folks, it will ***never*** be normal again until either an effective treatment or vaccine is developing, or we achieve herd immunity.
I STRONGLY oppose strict lockdowns.
But folks, it will ***never*** be normal again until either an effective treatment or vaccine is developing, or we achieve herd immunity.
We absolutely have enough data now to say with near-total confidence that pursuing herd immunity will lead to millions of deaths, even as treatment options are improving extremely rapidly. So I think pseudo-normalcy by July is plausible.
But we really should not be talking as if normalcy is nearby. It is not. China is still far away from normal and they got hit much earlier. There& #39;s no speedy return to normal. This is a fatal fantasy and must be wrung from our brains.
Anyways.
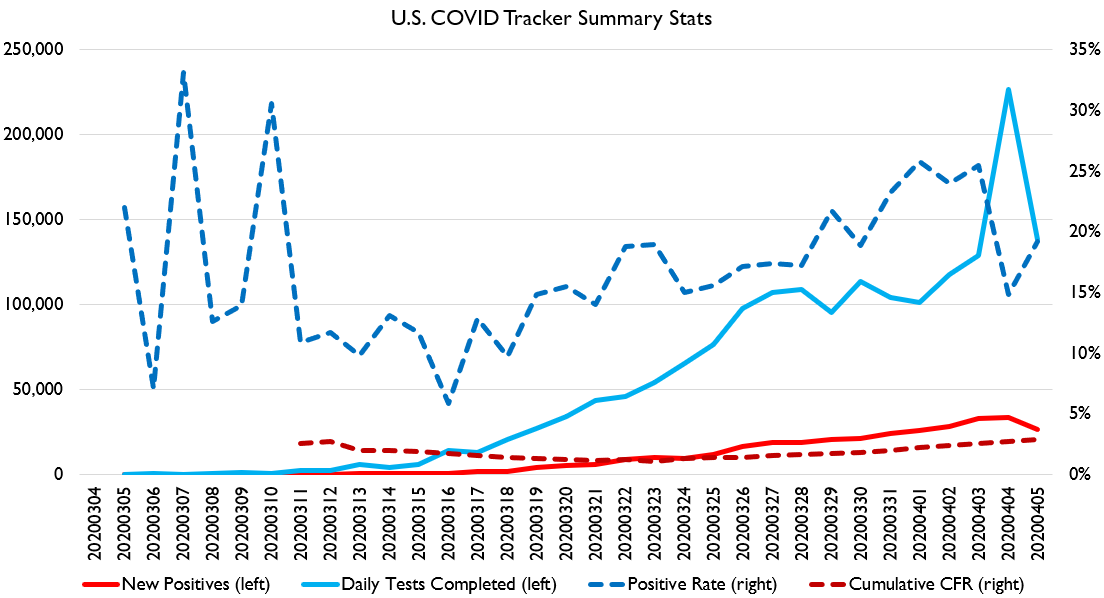
Here& #39;s our regular US graph. TEsts made a huge spike then dropped again. That spike is California. Amazing how journalists asking questions about tests got Quest to actually process some tests!
Here& #39;s our regular US graph. TEsts made a huge spike then dropped again. That spike is California. Amazing how journalists asking questions about tests got Quest to actually process some tests!
That big spike in tests, however, did lower the positive rate considerably, and the growth in new positives was lower. This suggests the tests Quest was sitting on were disproportionately negatives.... or their test has a higher false negative rate.
Anyways, the death rate keeps rising. About 2.8% now.
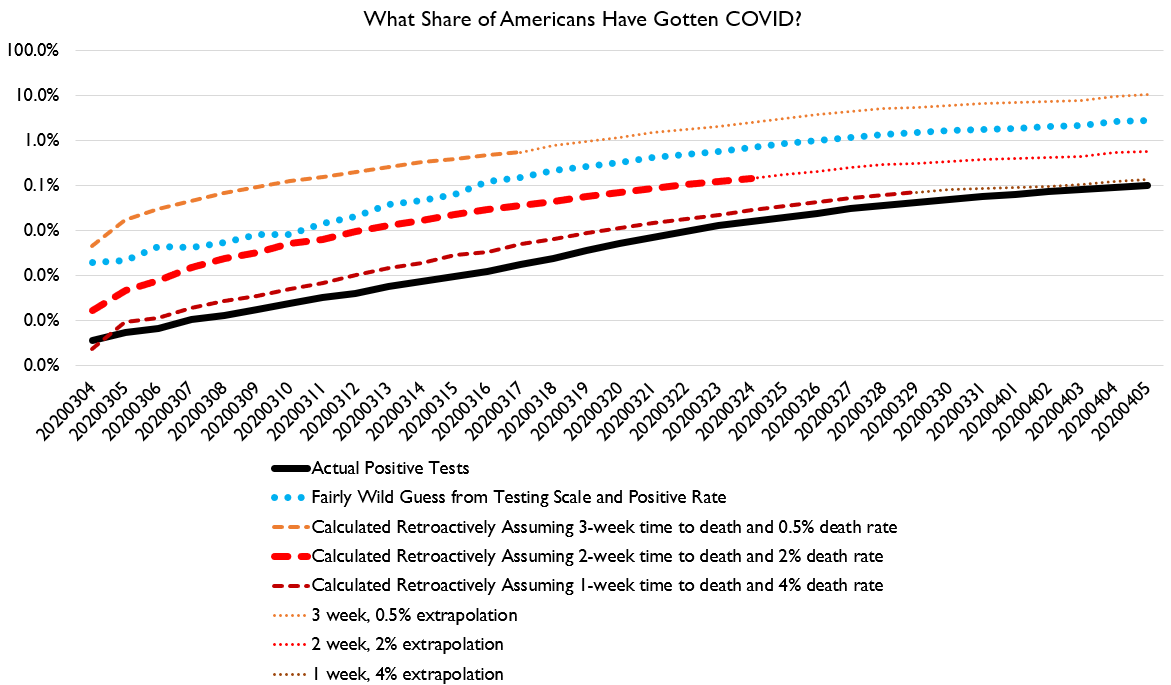
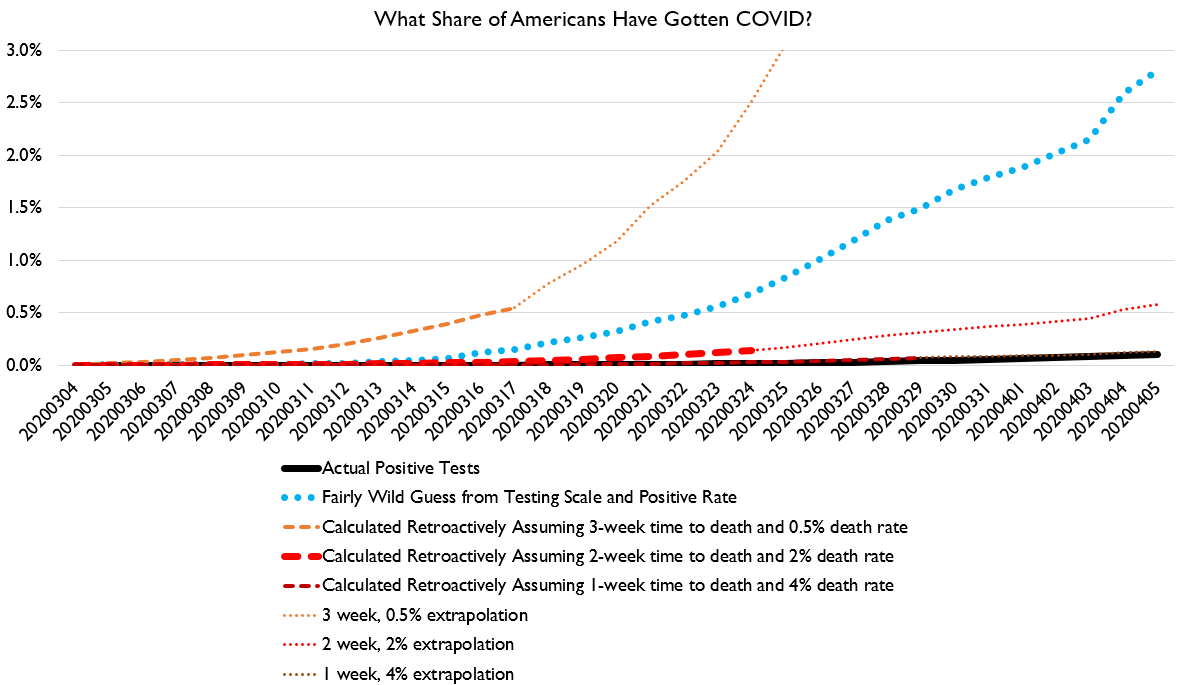
In terms of "how many people probably actually have gotten COVID," I continue to think assume a 2-week time to death (3-5 days incubation + 9-13 days to die) and a 2% CFR yields a very plausible estimate of total cases.
But if you think COVID has a 0.5% death rate, then that implies that you think ****10%***** of Americans have been infected.
I think that& #39;s ludicrous, especially given the first population-wide sample in a CO county turned up <2% COVID antibodies.
I think that& #39;s ludicrous, especially given the first population-wide sample in a CO county turned up <2% COVID antibodies.
I continue to think that the best estimate of infections is between the red hash and blue dotted lines. More than 0.5% of Americans have probably been infected, but under 3%. That fits all the data we have. If you take the blue dotted line, that implies a CFR of about 0.8%.
So my view is the true IFR is somewhere between 0.5% and 2.5%, and true infected share is between 0.5% and 3% right now.
Here& #39;s various metrics of how well we& #39;re flattening the curve. They continue to go down, except the "fairly wild guess" method: the huge spike in California testing threw that method a curveball.
Obviously, infection rates vary considerably around the country. My method suggests that as of March 21, New York state + city probably had 160k-500k people infected. It& #39;s obviously risen since. https://twitter.com/poiThePoi/status/1247020673593114625">https://twitter.com/poiThePoi...
As a final and affection note to both the "we must lock everything down and be exactly like China" people, as well as the "this is so overblown it& #39;s not much worse than the flu:" I see you in my mentions, and I wish a plague on both your houses.
COVID is bad and we should prevent it but also maybe don& #39;t cosplay totalitarianism.

 Read on Twitter
