If this guy& #39;s math is right, and I find it to be generally convincing, we should expect to see 100,000-500,000 Americans die of Covid-19 *this month*, and his math only accounts for infections stopping yesterday and healthcare not getting overwhelmed. https://twitter.com/davidrliu/status/1246794513923944453">https://twitter.com/davidrliu...
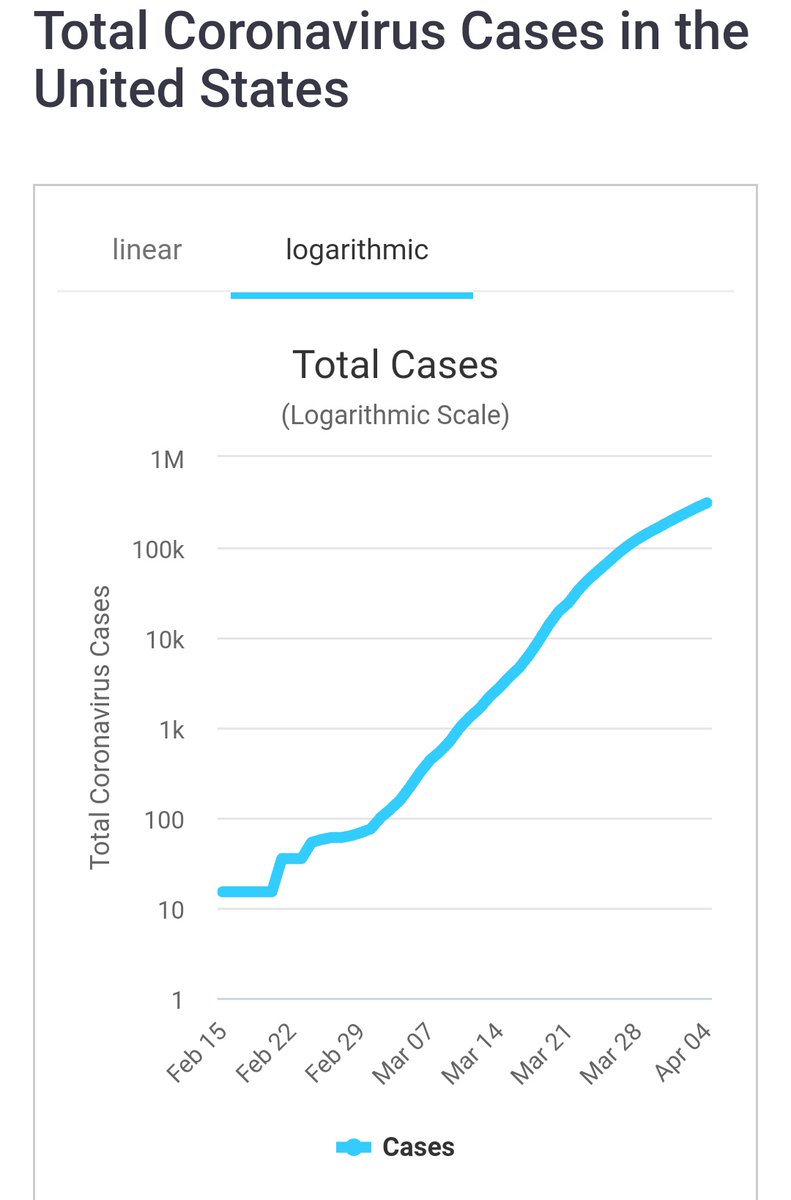
This curve (logarithmic scale) is a convincing argument that social distancing is having an effect, but it& #39;s not likely to keep bending this curve downward. It& #39;s bending it to a new effective reproductive rate, so a different, less steep line, i.e., slower exponential growth.
The video I just shared ( https://youtu.be/gxAaO2rsdIs )">https://youtu.be/gxAaO2rsd... is pretty clear on why our no-tests, no-trace, kinda-yeehaw-halfass social distancing isn& #39;t likely to curb the spread out of exponential growth. It& #39;s slowing things but not stopping them. Wash your hands more and shop less.
If we& #39;re really lucky, a significant percentage of infections remain asymptomatic, and thus way more of us have had it than we think, and life can get nearer to normal after the next two months more easily, but this will require massive, effective testing and strict quarantines.
Oh yes, also masks in public, which are probably almost as or even more important than good, fastidious hand washing so far as overall hygiene goes here.
These numbers, of course, depend entirely on if that method of modeling is correct and if its assumptions are correct. I& #39;m fooling with another approach that doesn& #39;t agree with it and is more optimistic, predicting a total of about 52,000 US deaths by the end of April, BUT...
BUT, ***I& #39;m not an epidemiologist*** and I& #39;m using the official numbers on the worldometer site, which might be way off. I& #39;ll show you anyway, but you shouldn& #39;t probably put too much stock in what I& #39;ve done because it& #39;s not a tight method by any stretch. Kinda interesting, tho.
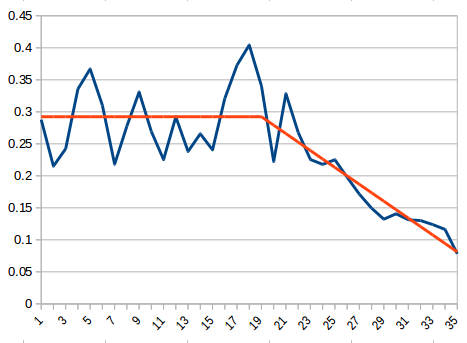
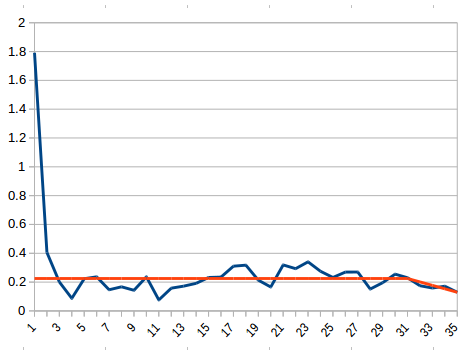
What I did was to find the day-to-day growth rate from the existing data, assuming exponential growth (which is a rock-solid assumption, frankly) starting on March 1 until today. I then charted these data, one for confirmed cases, one for confirmed deaths and added naive trends.
The cases graph shows a lot of wild variation in the rate from day to day because, presumably, testing rates were pretty variable and unreliable for most of March (if not still). You can see this, but the average indicates a 2.4-day doubling time, which is about right.
About a week after the day we officially started social distancing in the US (March 12, with March 19 a week later), it& #39;s pretty clear that the day-to-day growth rate starts dropping steadily. Social distancing and whatever else we& #39;re doing is working unless we ran short of tests
If this is right, the (official) case number isn& #39;t doubling every ~2.4 days but roughly every 8.7 days now, which is a big improvement, supposing it& #39;s accurate. Distancing and hygiene actually work, or we& #39;re REALLY failing on testing.
This "fit" I did is lazy and obviously incorrect. It should curve down smoothly from a few days after social distancing started and faster as we get better at it, but social distancing at this level alone won& #39;t stop exponential growth, so it should also level off. When? No idea.
This could be a temporary (weekend-induced?) data anomaly or some other kind, and the leveling off value might be higher than where we are now, or it might drop lower before leveling off. I& #39;m not claiming to be able to guess. Points: testing was random, social distancing works.
The confirmed deaths curve is a lot more steady, as we should expect because deaths aren& #39;t as likely to be missed as tests. It looks like until quite recently, the deaths curve was doubling every 3 days or so, which fits almost everything we know about Covid-19. No surprise.
Again, if social distancing/hygiene improvements work, we should see the death curve bending downward like the cases curve about 17-18 days after it began, and though it& #39;s harder to tell, I think we do, beginning on the last day or two of March.
Again, that curve should see a smoother trend and won& #39;t go negative or to zero. Supposing it levels off in about a week, at a ~5.4-day doubling time for deaths, which is a fairly arbitrary decision I made just to look, this would predict at least 52,000 American deaths by Apr 30.
We& #39;ll see, but based on just looking at the current curves, without making any assumptions about the number of will-be-fatal cases based on current numbers and trends, ~50k deaths by end of April might be achieved if we maintain this kind of social distancing, hygiene, etc.
Again, the take-homes on this are *I& #39;m not an epidemiologist* and *my approach isn& #39;t terribly careful* but it& #39;s clear enough that what we& #39;ve been doing is mitigating the problem (flattening the curve) significantly and can probably continue to, though it& #39;s hard to sustain.
Another fair bet is that if we stop social distancing/advanced hygiene, etc., is that those rates will go back up (with the same 5-7 and 17-18 day fuses) to the previously stable averages that look like doubling every 2.5-3 days on each. That& #39;s not a trivial thing.
For example, if our social distancing already kind of broke this past week (as was reported throughout the South) and the death curve rebounds on similar assumptions just back to its previously approximately stable value, we& #39;re looking at ~2.57M dead Americans by April 30!
That wasn& #39;t a typo. 2,570,000 dead by the end of April, USA alone (meaning this pandemic is probably going to WRECK the developing world...), if we gave up on our more advanced distancing and hygiene and let it creep back up. *MY MODEL IS NAIVE!!!* *This defines a range.*

 Read on Twitter


