humanitarian data twitter:
If you use Early Warning dashboards (drought, market prices, etc)- what are your favorites? I& #39;m hoping to compile a list. Thread has examples of the ones I use (mostly seasonal data- vegetation and rainfall)
If you use Early Warning dashboards (drought, market prices, etc)- what are your favorites? I& #39;m hoping to compile a list. Thread has examples of the ones I use (mostly seasonal data- vegetation and rainfall)
Looking at you: @dickoah , @OlanderBill , @LambertMarieJu1 , @Simon_B_Johnson , @humdata , @colomborobert, @notoncebut2x , @david_megginson
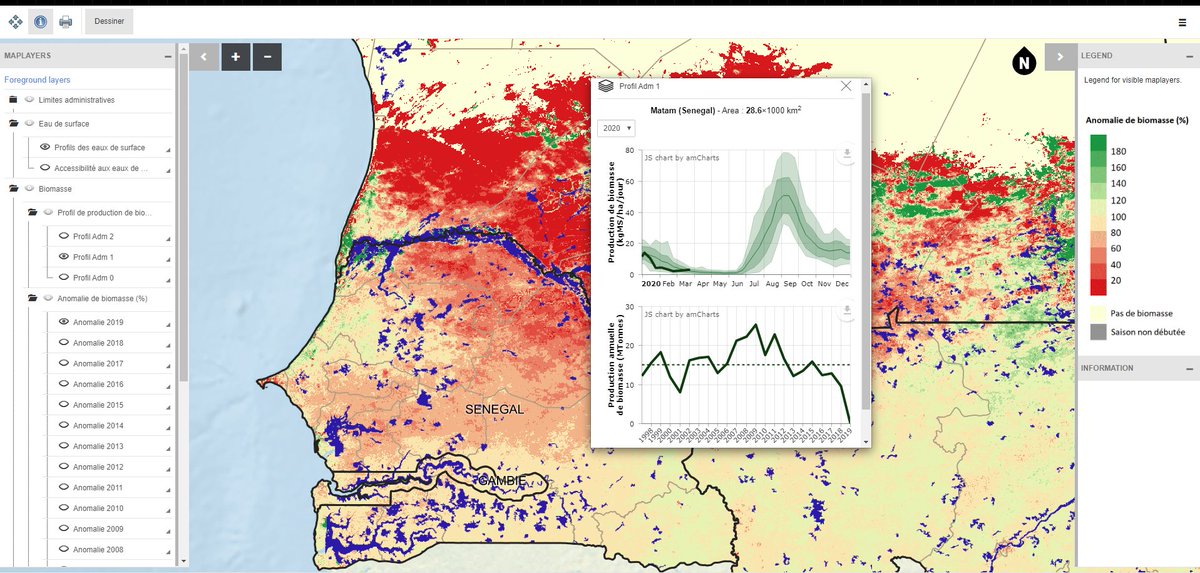
First one I have to mention is GeoSahel. All of @acfwestafrica& #39;s field data on pastoralism and biomass is here. Even though I don& #39;t work for ACF anymore, I find myself frequently using it. ( @LambertMarieJu1 runs this now)
http://80.69.76.253/Choosemap.aspx
http://80.69.76.253/Choosemap.aspx
I think @GEOCropMonitor has a great crop monitor tool- I find the crop calendar particularly useful. I really want to get to using this tool more often.
https://cropmonitor.org/index.php/eodatatools/cmet/">https://cropmonitor.org/index.php...
https://cropmonitor.org/index.php/eodatatools/cmet/">https://cropmonitor.org/index.php...
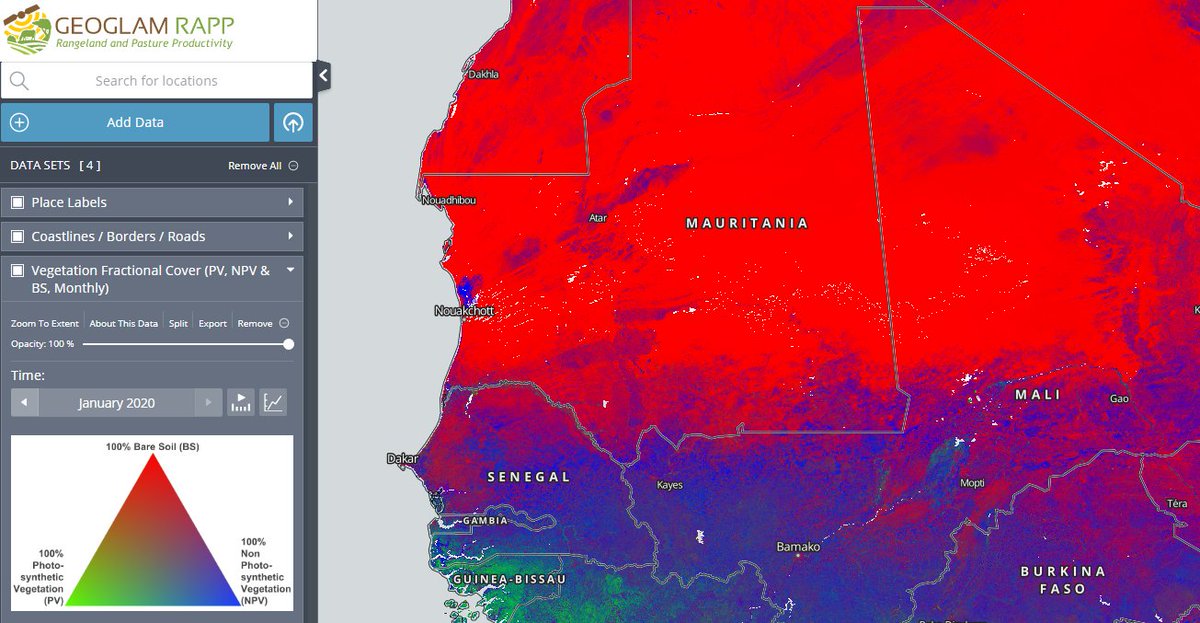
My new favorite is the @G20_GEOGLAM RAPP dashboard- a must use for #cowfacts! The fractional cover layer is a nice measure of pasture availability in the dry season.
https://map.geo-rapp.org/ ">https://map.geo-rapp.org/">...
https://map.geo-rapp.org/ ">https://map.geo-rapp.org/">...
The dashboard i& #39;ve used for the longest is definitely the @FEWSNET / @USGS Early Warning Explorer. Super easy to use- just click on an admin 1 or 2 for NDVI and rainfall time series charts.
https://earlywarning.usgs.gov/fews/ewx_lite/index.html?region=af">https://earlywarning.usgs.gov/fews/ewx_...
https://earlywarning.usgs.gov/fews/ewx_lite/index.html?region=af">https://earlywarning.usgs.gov/fews/ewx_...
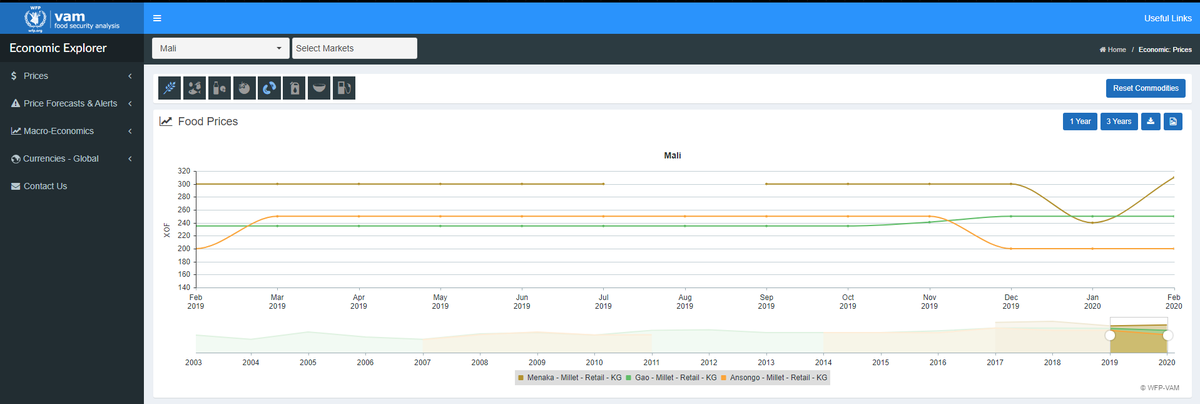
Can& #39;t not mention @WFPVAM& #39;s DataViz. I find myself using it a lot to get price data. It has seasonal data as well (NDVI and rainfall) as well but I haven& #39;t worked with it as much.
https://dataviz.vam.wfp.org/ ">https://dataviz.vam.wfp.org/">...
https://dataviz.vam.wfp.org/ ">https://dataviz.vam.wfp.org/">...
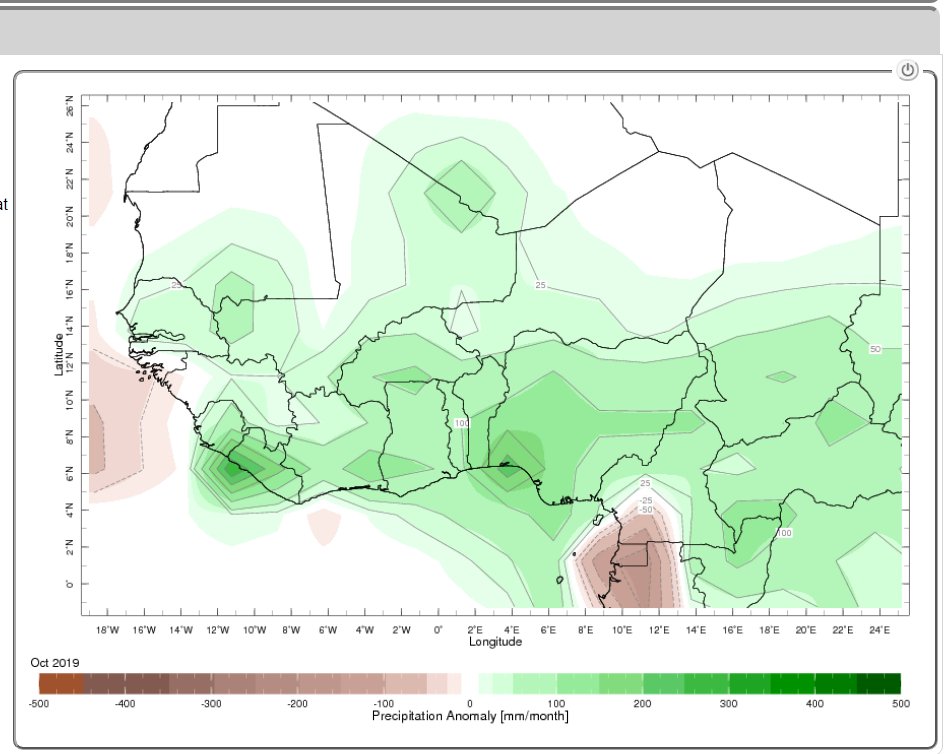
A great one from @climatesociety- simple easy to use tool that makes maps of rainfall anomalies and the archive goes back to the 1970s.
https://iridl.ldeo.columbia.edu/maproom/Global/Precipitation/Anomaly.html?bbox=bb%3A-19.00%3A-1.32%3A25.20%3A26.18%3Abb&T=Oct%202019">https://iridl.ldeo.columbia.edu/maproom/G...
https://iridl.ldeo.columbia.edu/maproom/Global/Precipitation/Anomaly.html?bbox=bb%3A-19.00%3A-1.32%3A25.20%3A26.18%3Abb&T=Oct%202019">https://iridl.ldeo.columbia.edu/maproom/G...
Here& #39;s a real specific one for wildfires. Very useful when you& #39;re looking at pasture availability in the dry season. Another indispensable dataset for #cowfacts.
https://gwis.jrc.ec.europa.eu/static/gwis_current_situation/public/index.html">https://gwis.jrc.ec.europa.eu/static/gw...
https://gwis.jrc.ec.europa.eu/static/gwis_current_situation/public/index.html">https://gwis.jrc.ec.europa.eu/static/gw...

 Read on Twitter


