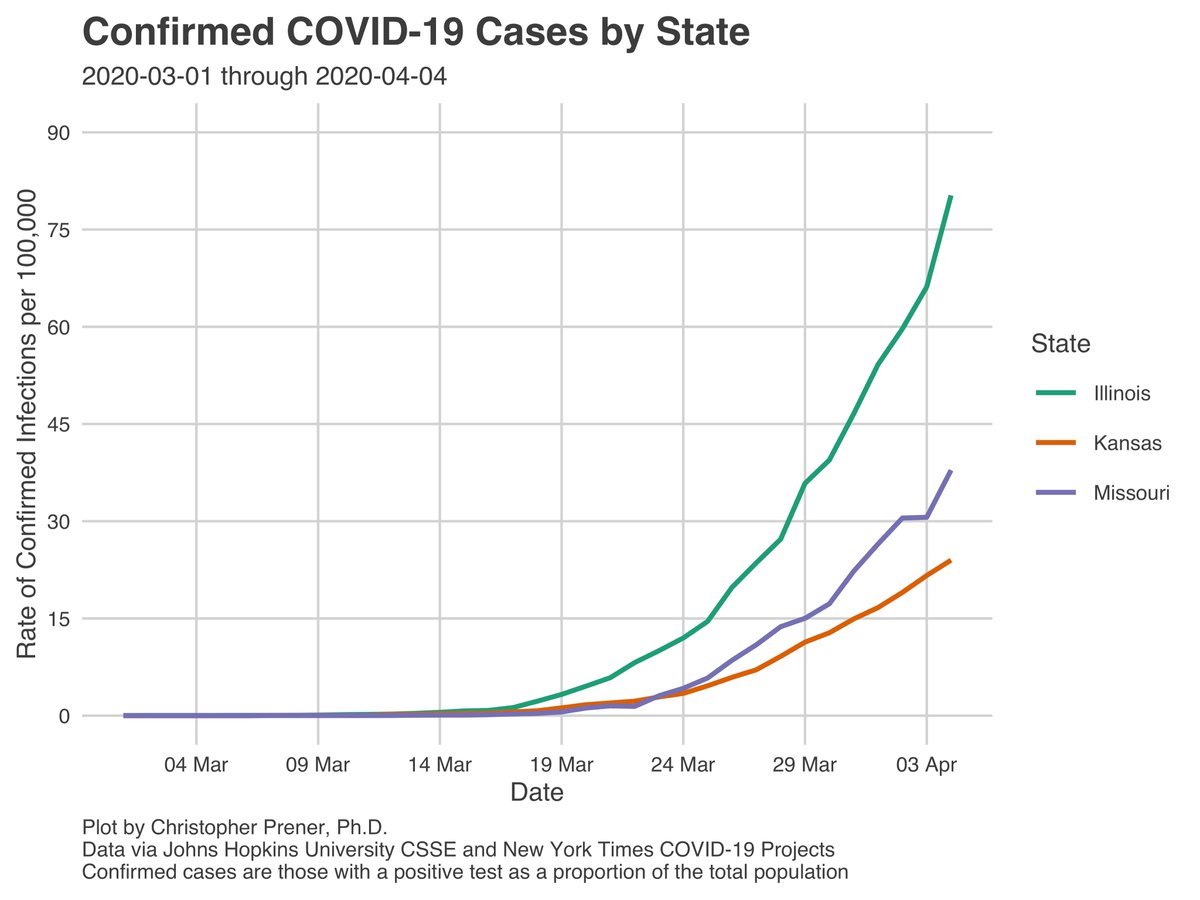
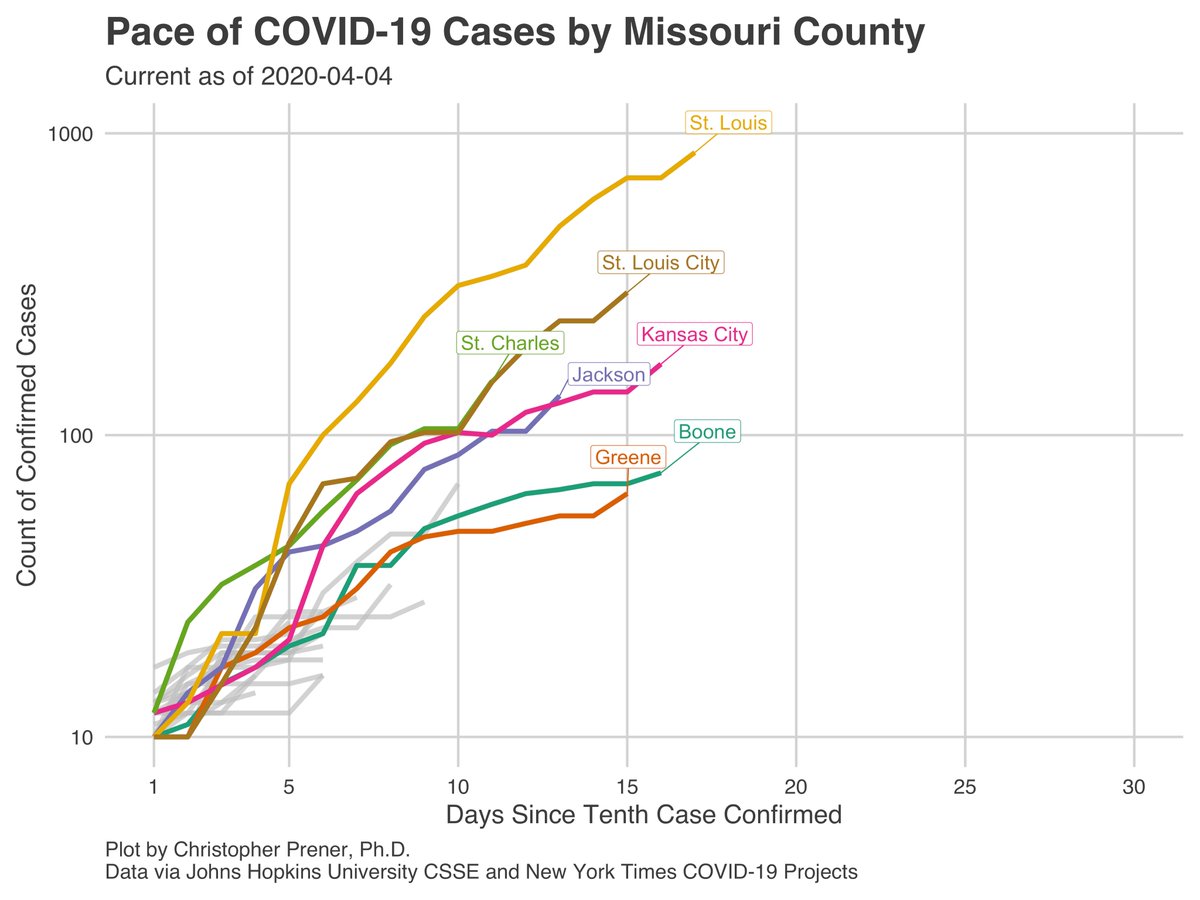
Back with my morning #COVID19 update  https://abs.twimg.com/emoji/v2/... draggable="false" alt="🧵" title="Thread" aria-label="Emoji: Thread"> for Missouri after a day off due to data reporting lags. I’ve seen some talk about when our “peak” is going to be here in #StLouis - not forecasting but we definitely are not showing signs of a peak yet - steady growth continues in MO. 1/12
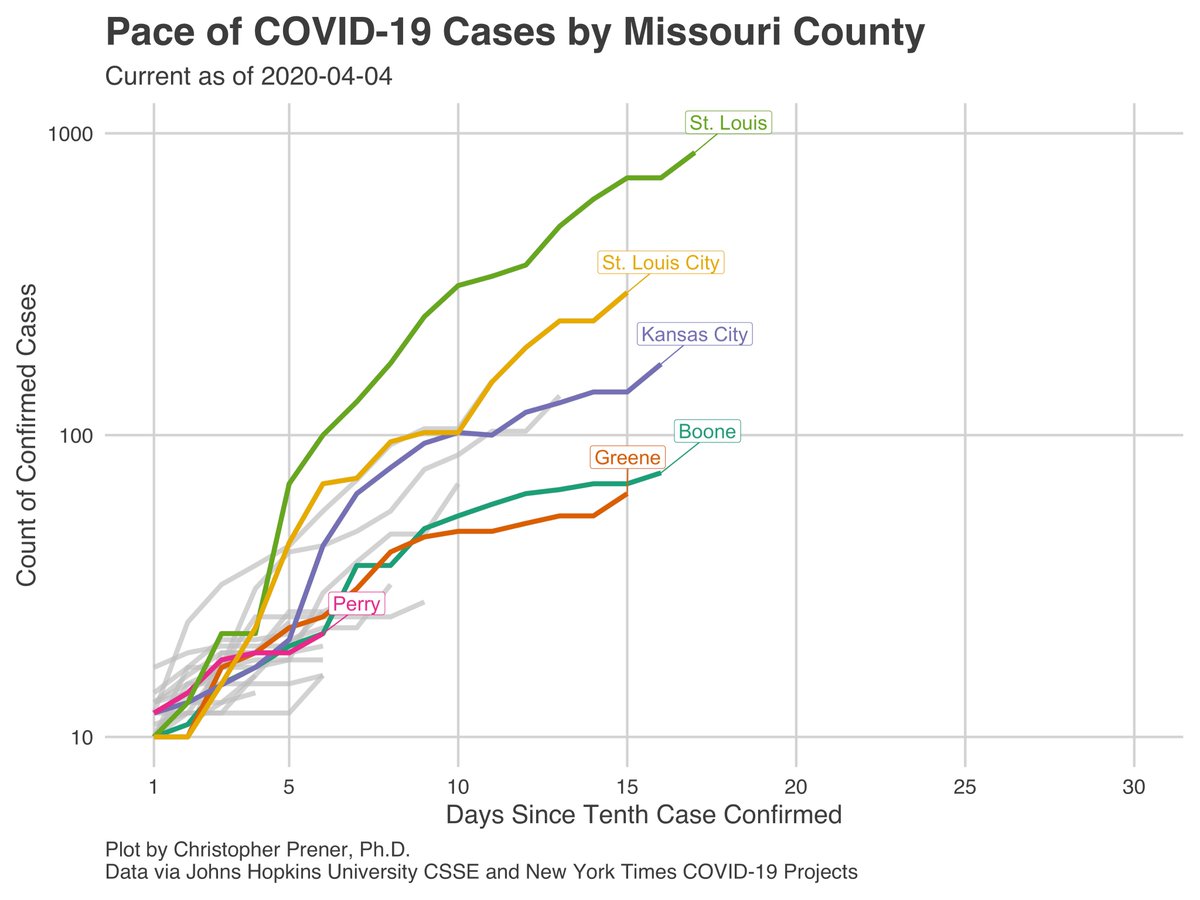
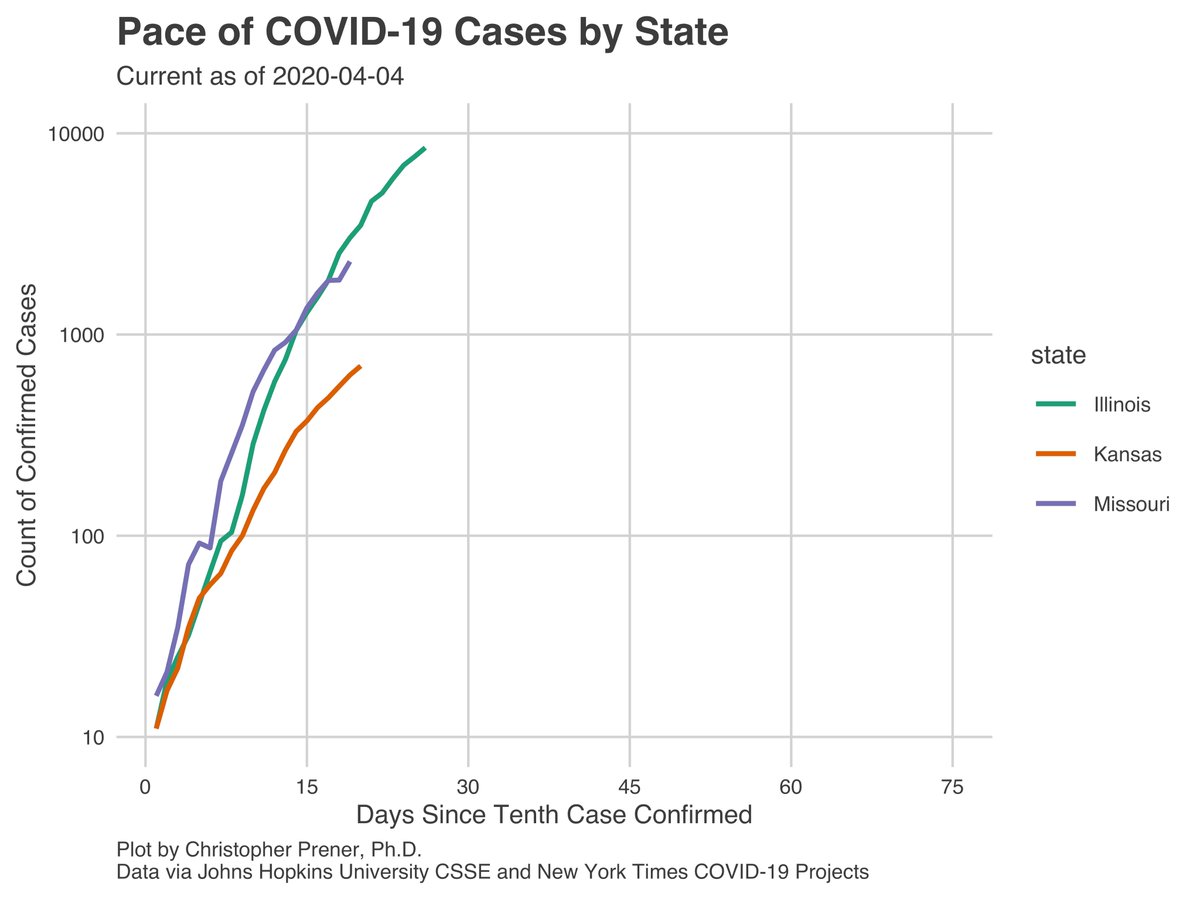
One thing to note about the log plot above  https://abs.twimg.com/emoji/v2/... draggable="false" alt="☝️" title="Up pointing index" aria-label="Emoji: Up pointing index"> and the ones below
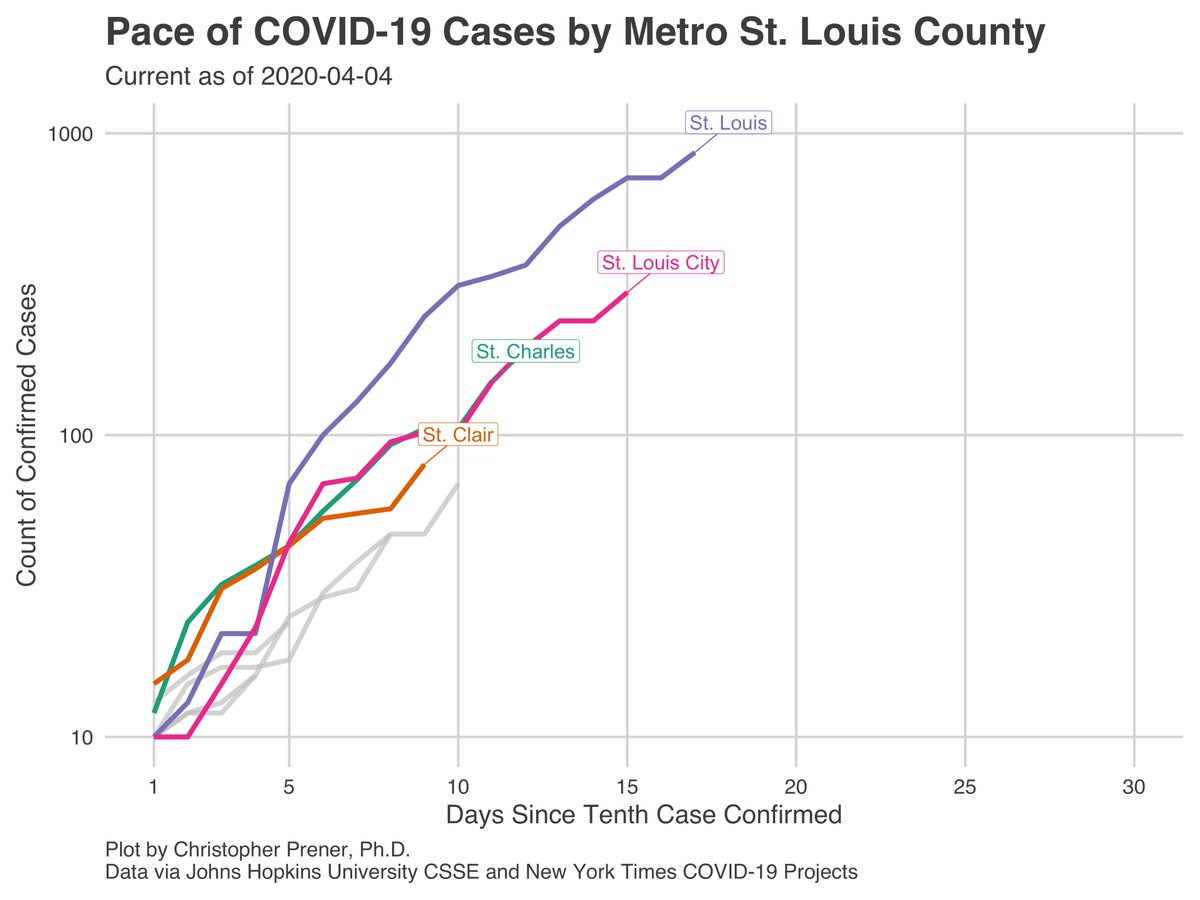
  https://abs.twimg.com/emoji/v2/... draggable="false" alt="👇" title="Down pointing backhand index" aria-label="Emoji: Down pointing backhand index"> - I’ve switched them all to plotting the number of days since the *tenth* case was confirmed in a state/county. This makes the pace comparisons easier now that infections are widespread. 2/12
Note in the state log plot that our pace is virtually *identical* to Illinois right now, even though our rates are lower because we are weeks behind them in confirmed morbidity. Keep that in mind - this points to a peak that is still not here yet. 3/12
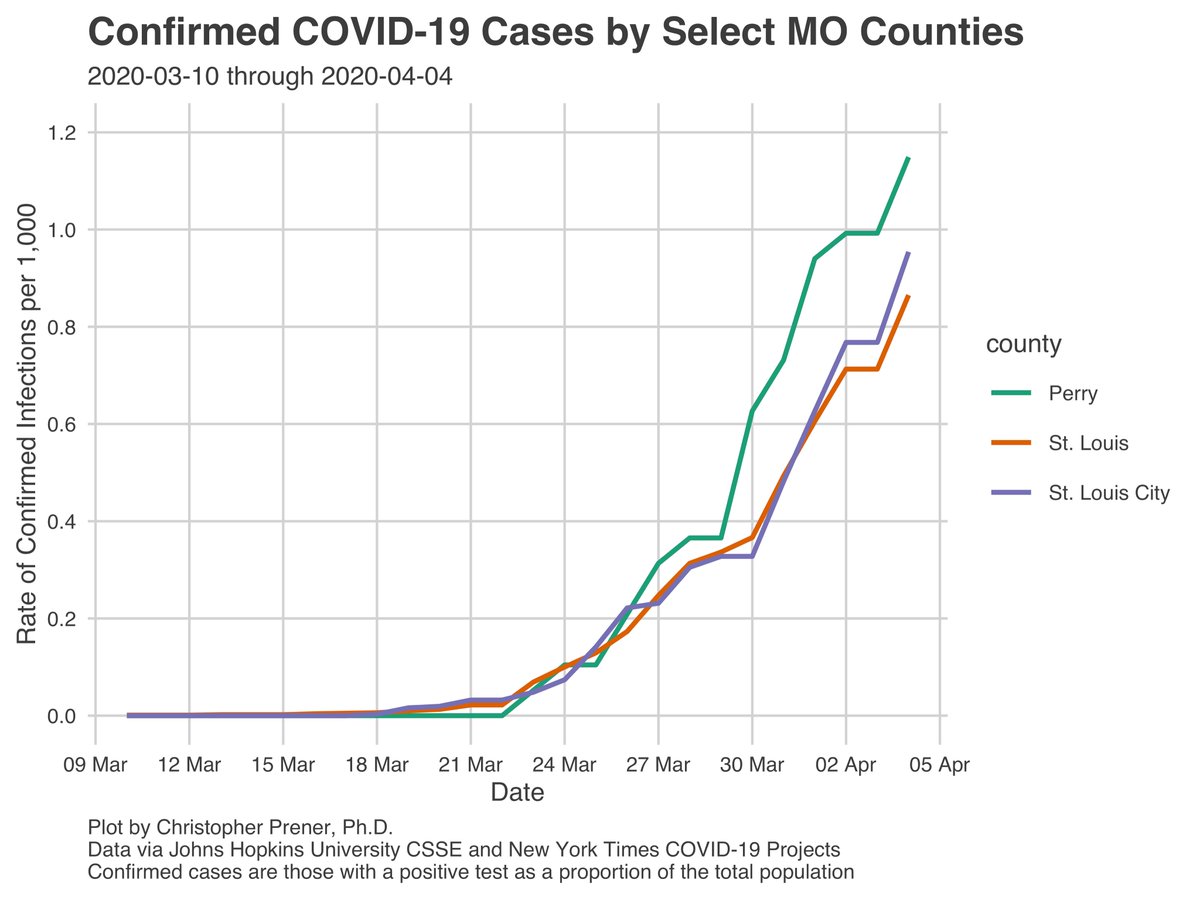
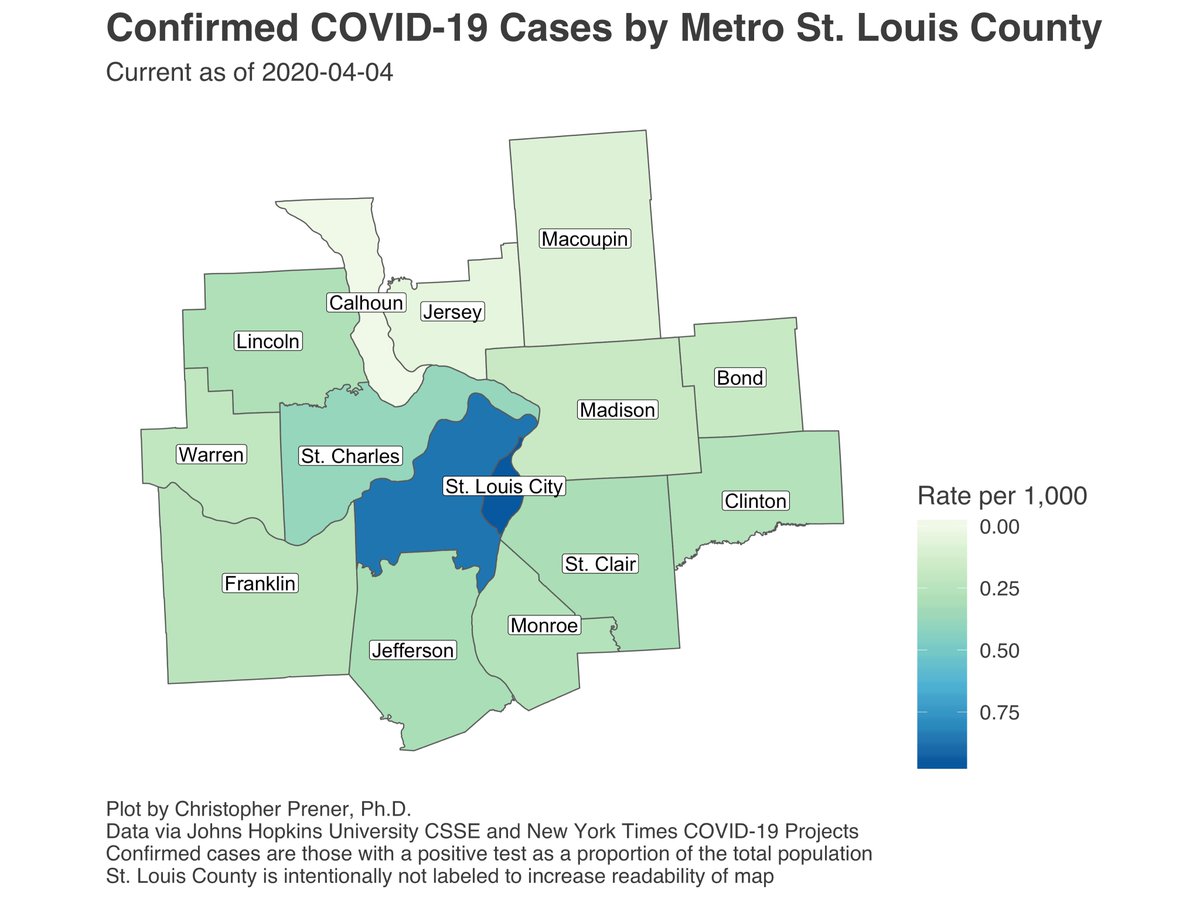
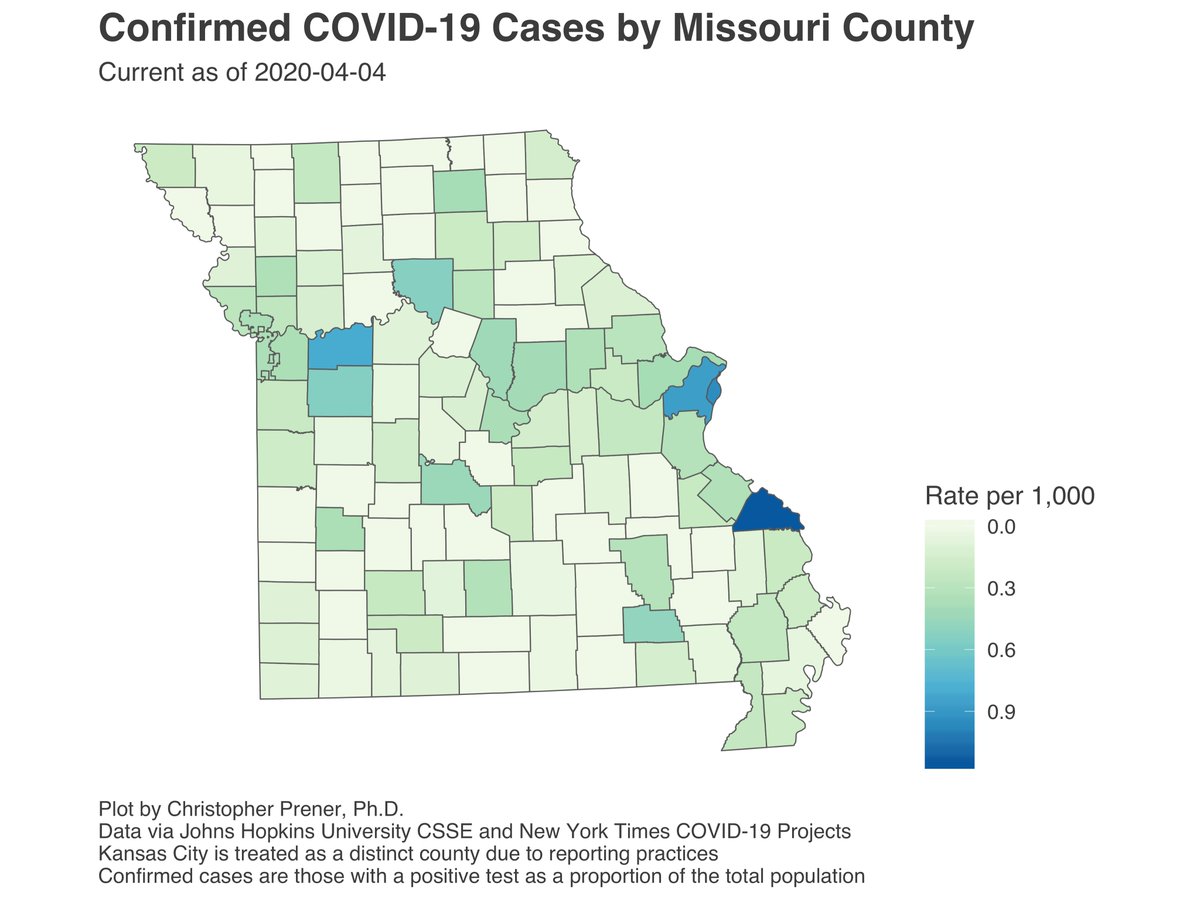
Perry County still has the highest rate of any county (the interactive maps are easier for exploring this - https://slu-opengis.github.io/covid_daily_viz/).">https://slu-opengis.github.io/covid_dai... The pace of growth (in the log plot) there is similar to Greene and Boone Counties, but in a much more rural setting. Very concerning. 4/12
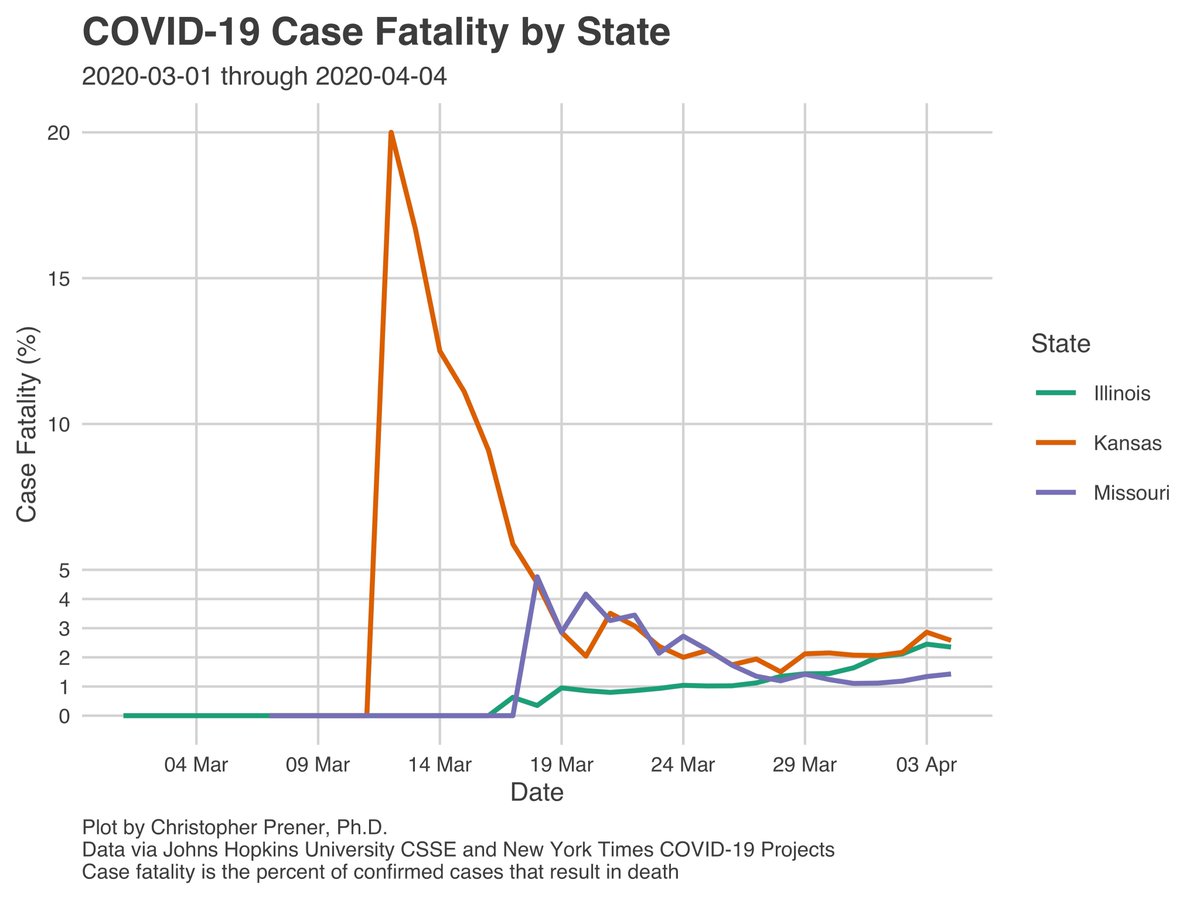
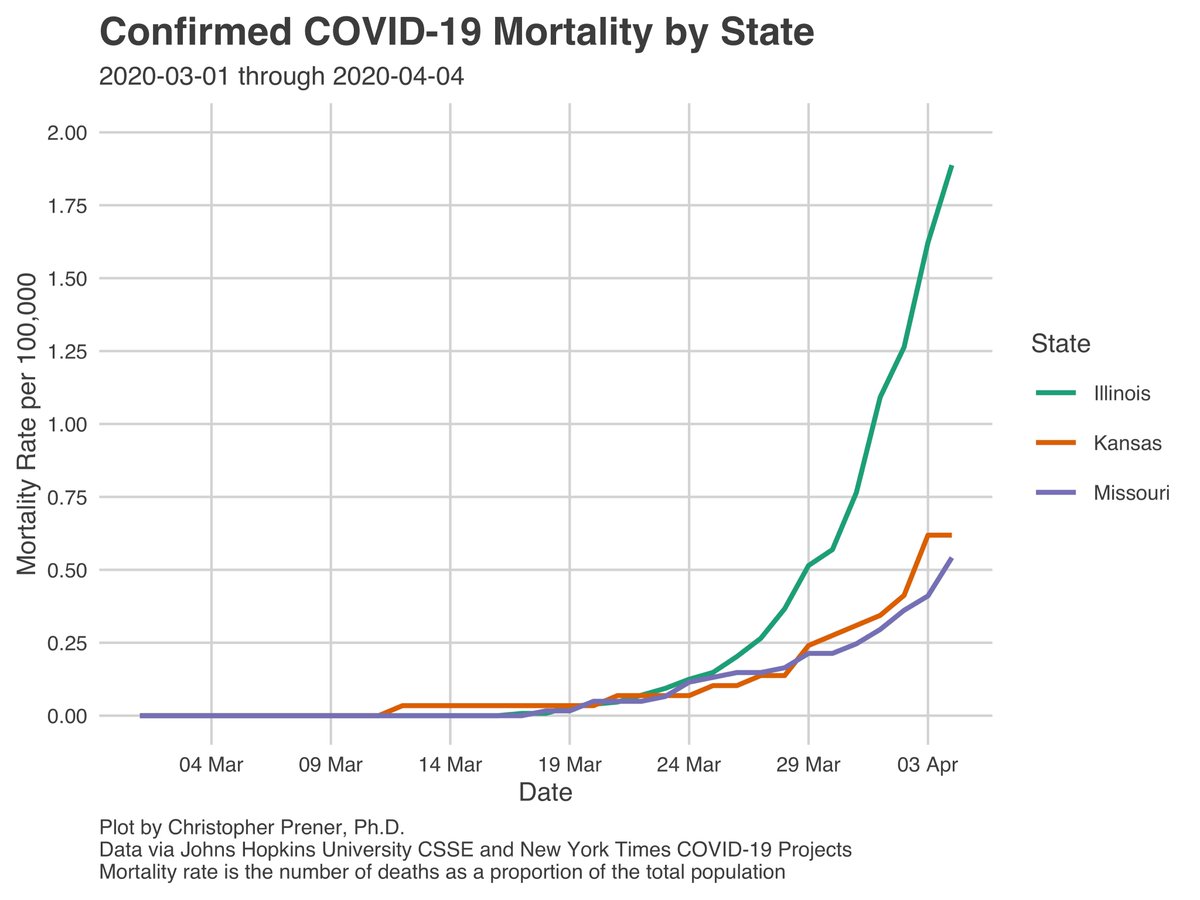
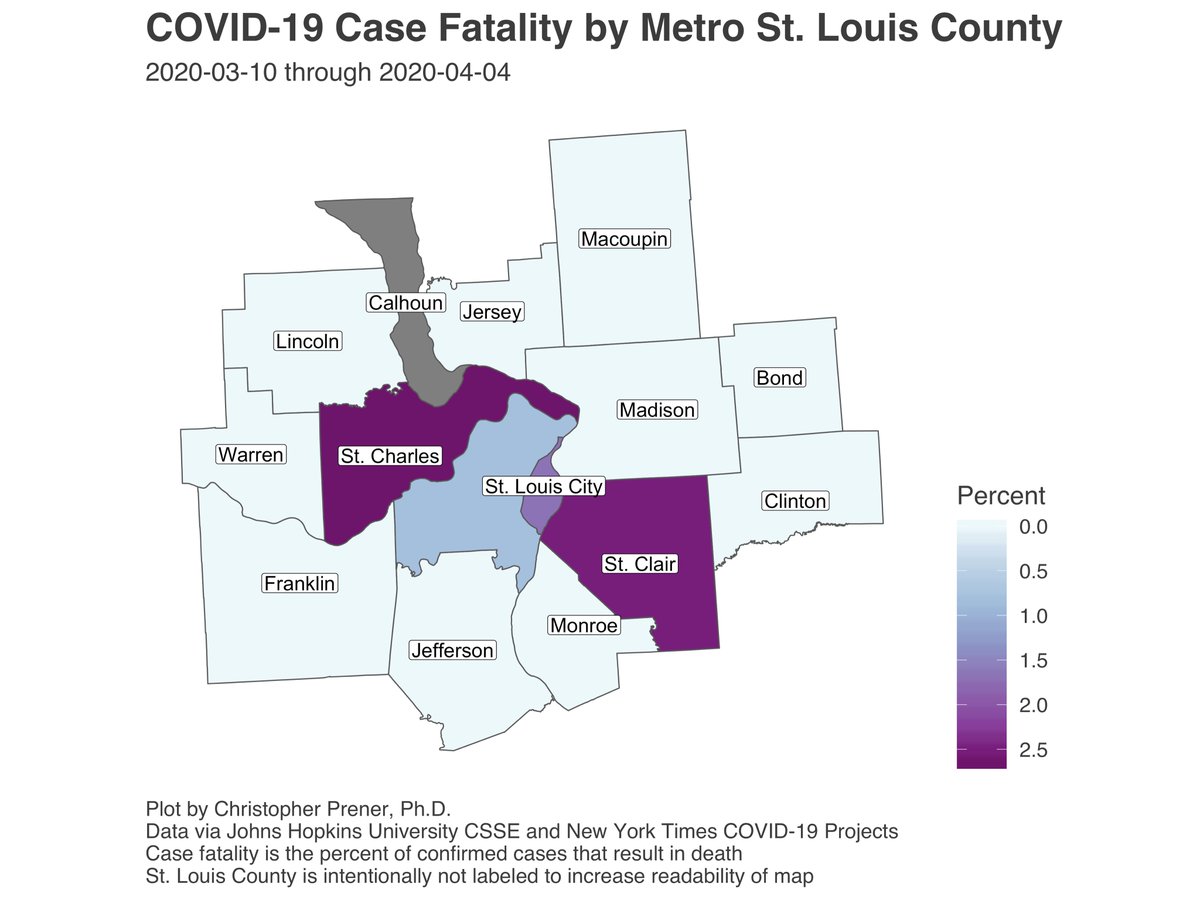
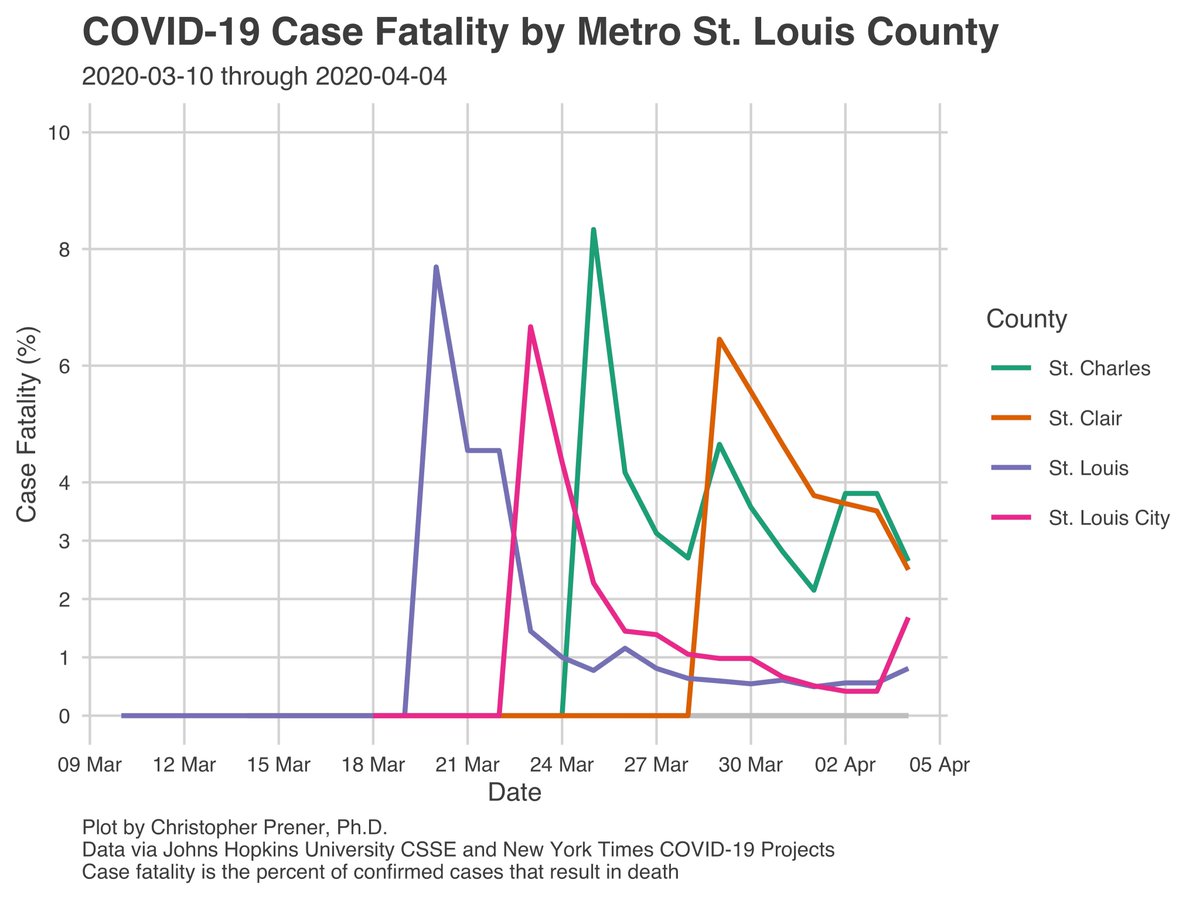
Mortality continues to grow, and case fatality rates are holding around 2%. This is higher than what was observed in Wuhan, but given recent reporting, that number might not be reliable. I’ll repeat my warning from Friday - mortality is likely to grow in MO in coming weeks. 5/12
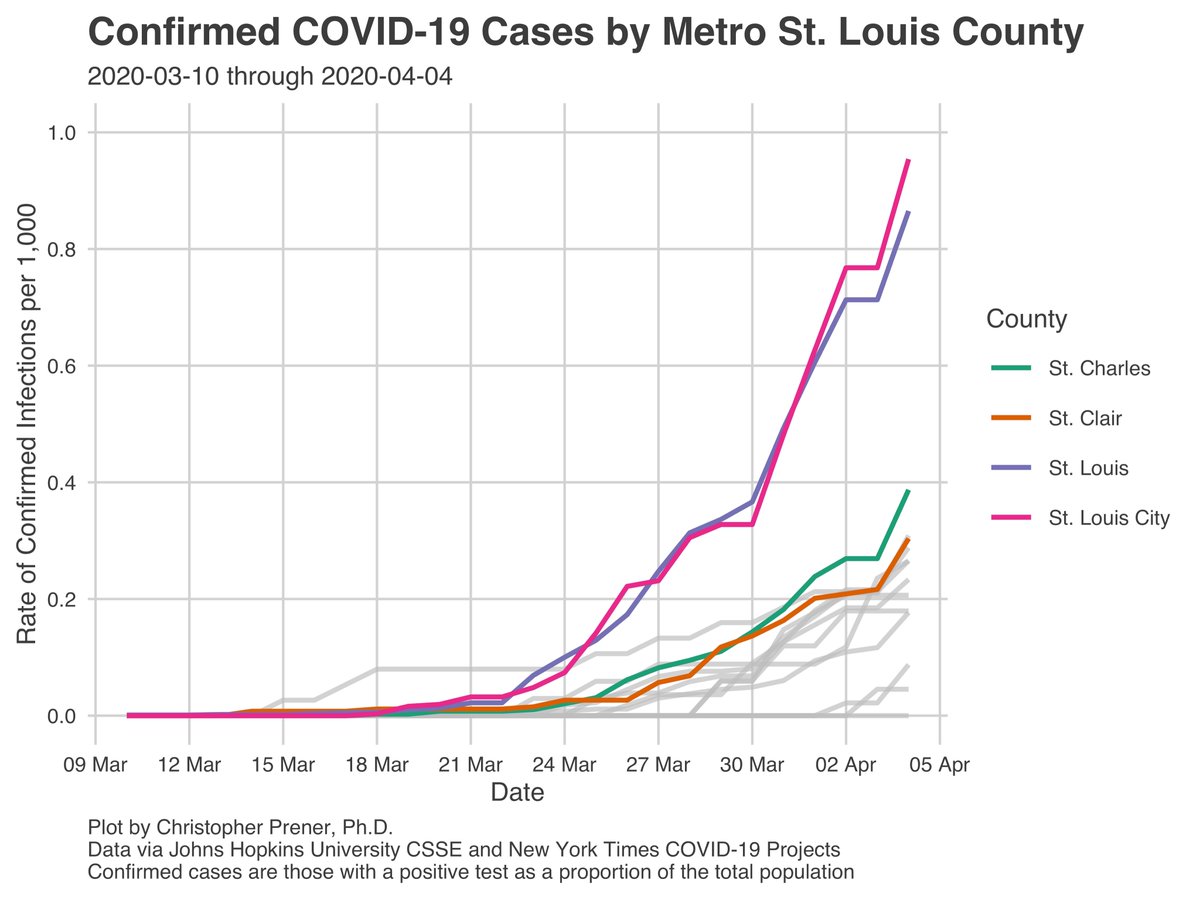
Steady growth is continuing in the STL metro area as well. #StLouis remains the epicenter - with the city having a higher rate of confirmed infection than the county despite larger numbers of confirmed infections in the county. Case fatality is converging on 2% here, too. 6/12
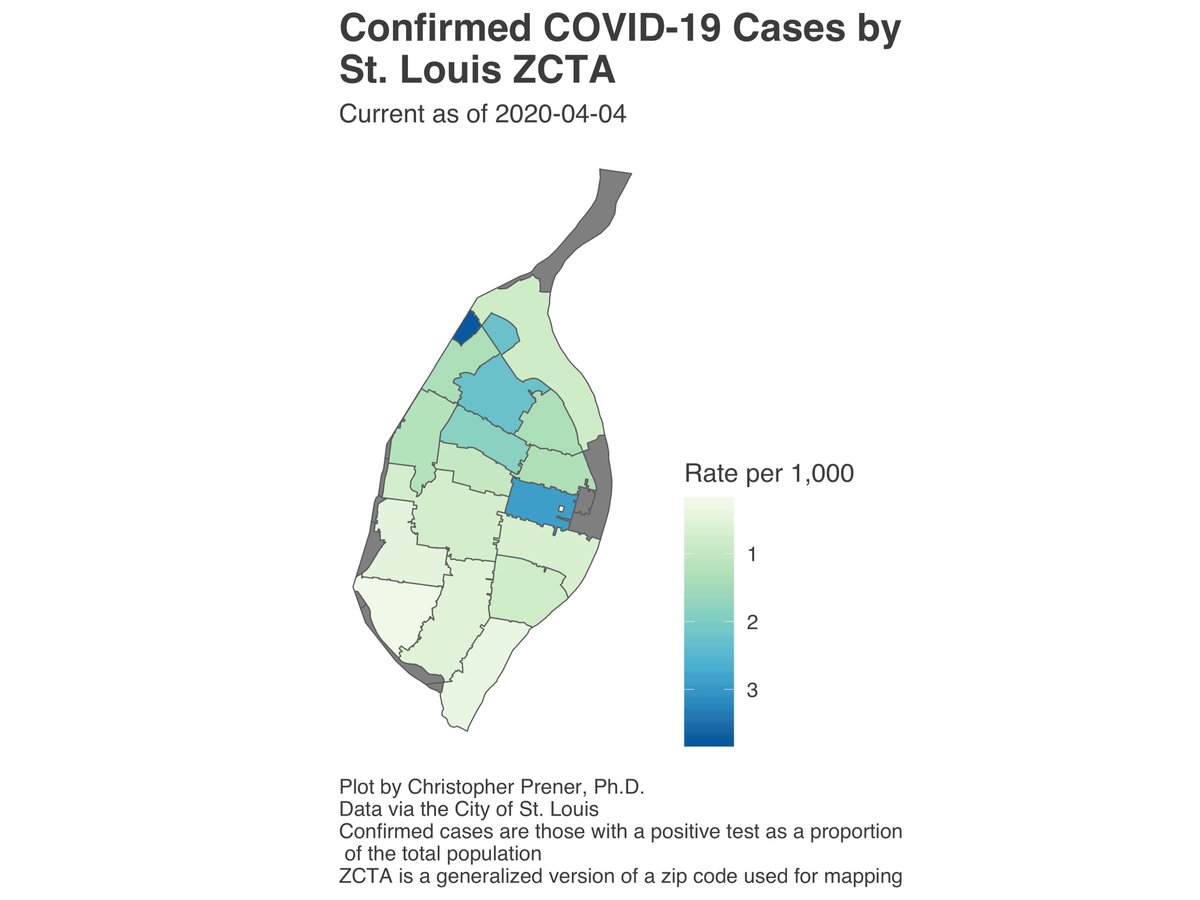
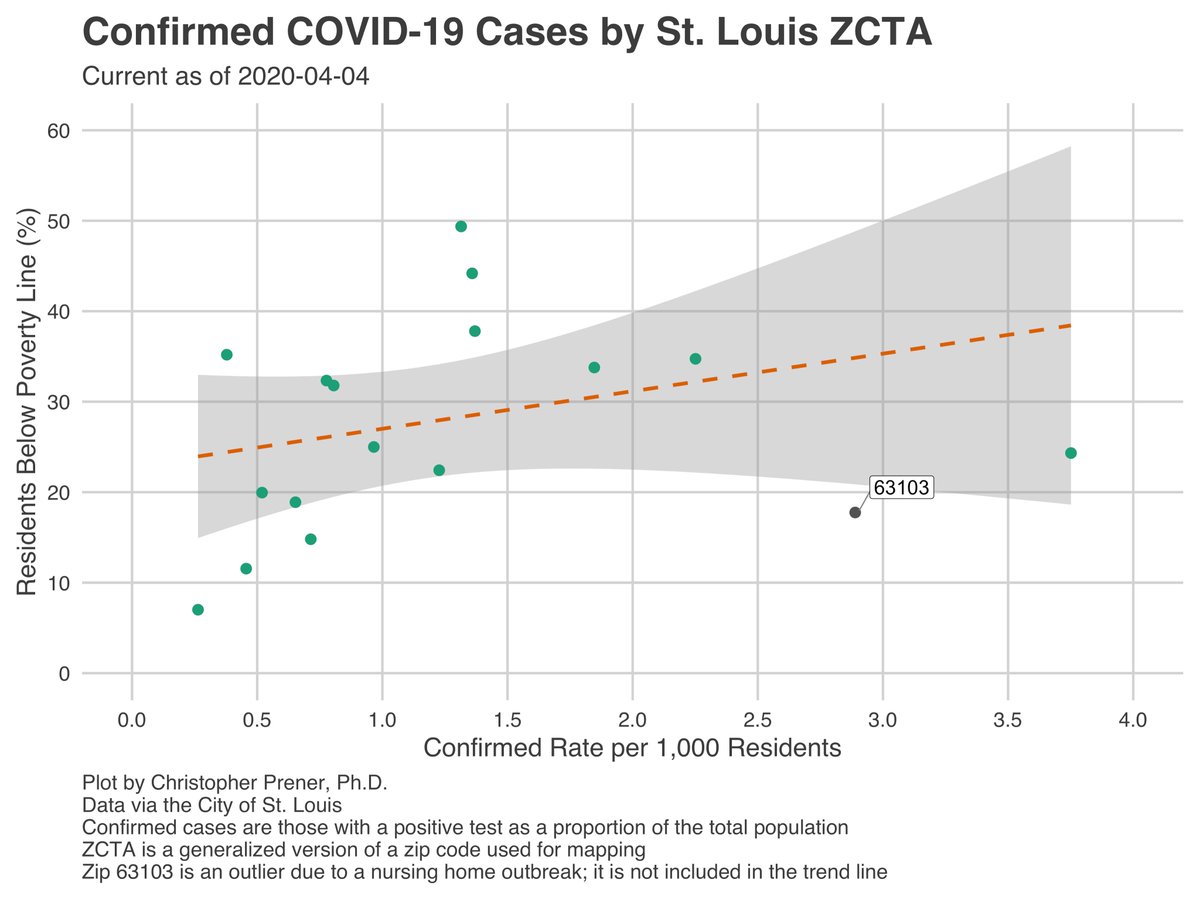
Within the city, North City zips continue have the highest rates. If these zips were counties (and many have larger populations than rural MO counties), North City zips would have the highest county rates per 1,000 residents in Missouri. Let that sink in. 7/12
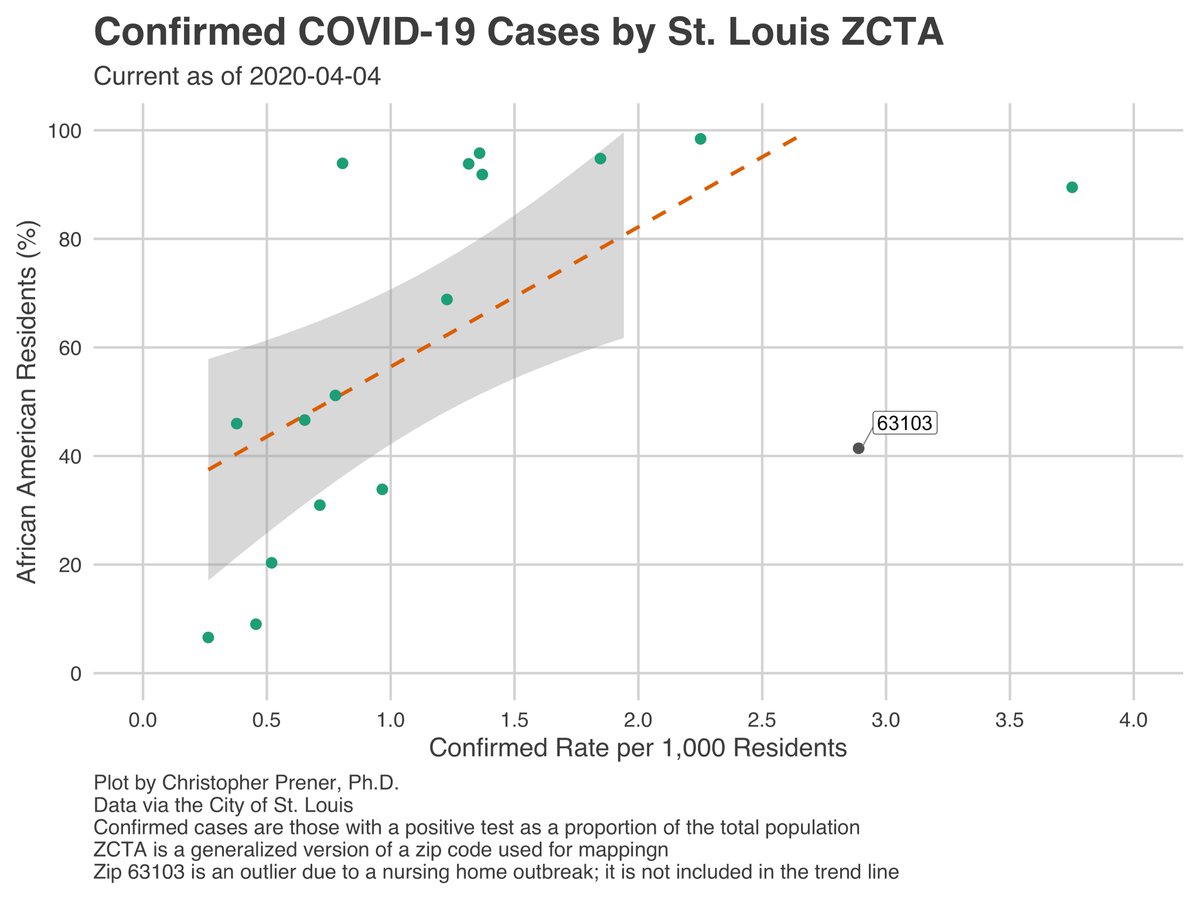
A pronounced gradient between #COVID19 and racial composition of zips remains as well. This is *deeply* troubling. This is something that we need to watch closely, and I’ll repeat my call for better data - racial breakdowns in confirmed cases and counts by zip are both needed. 8/
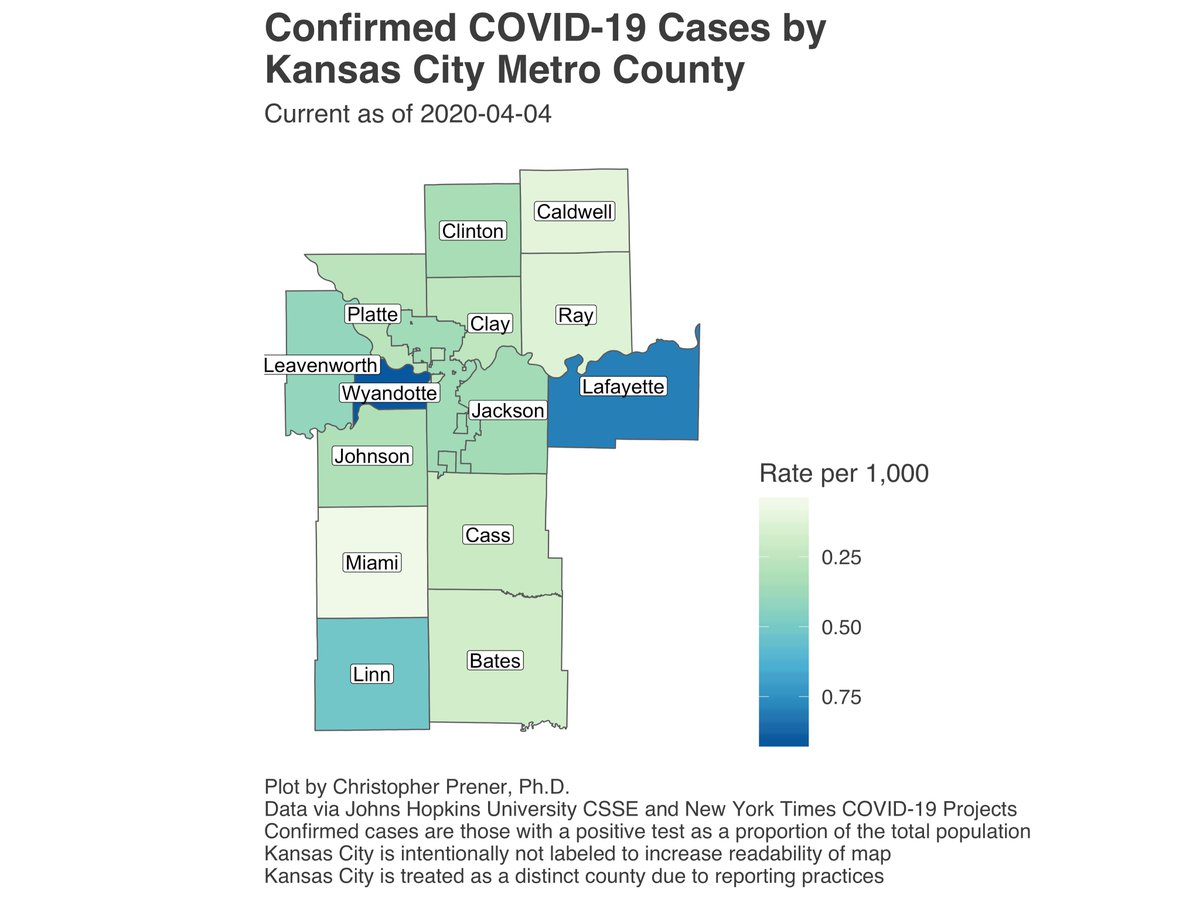
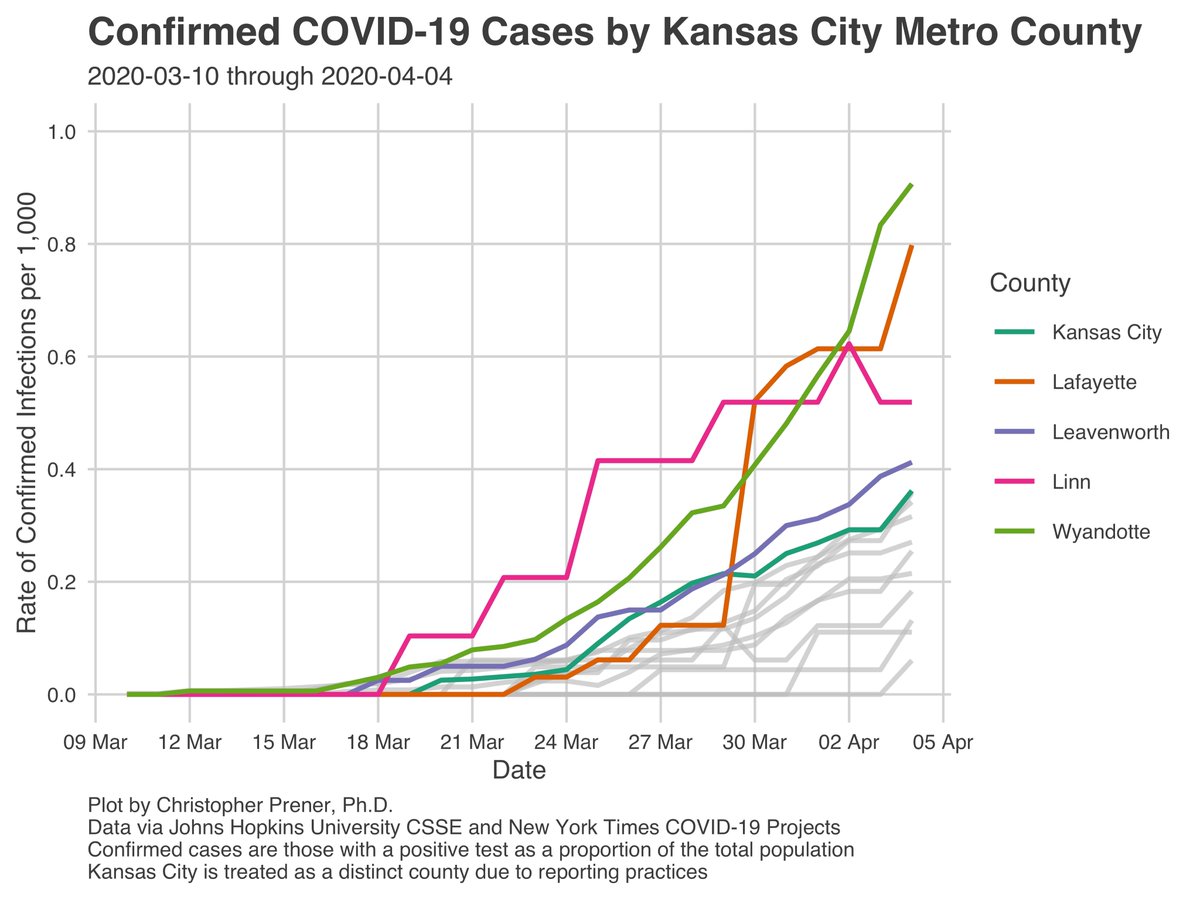
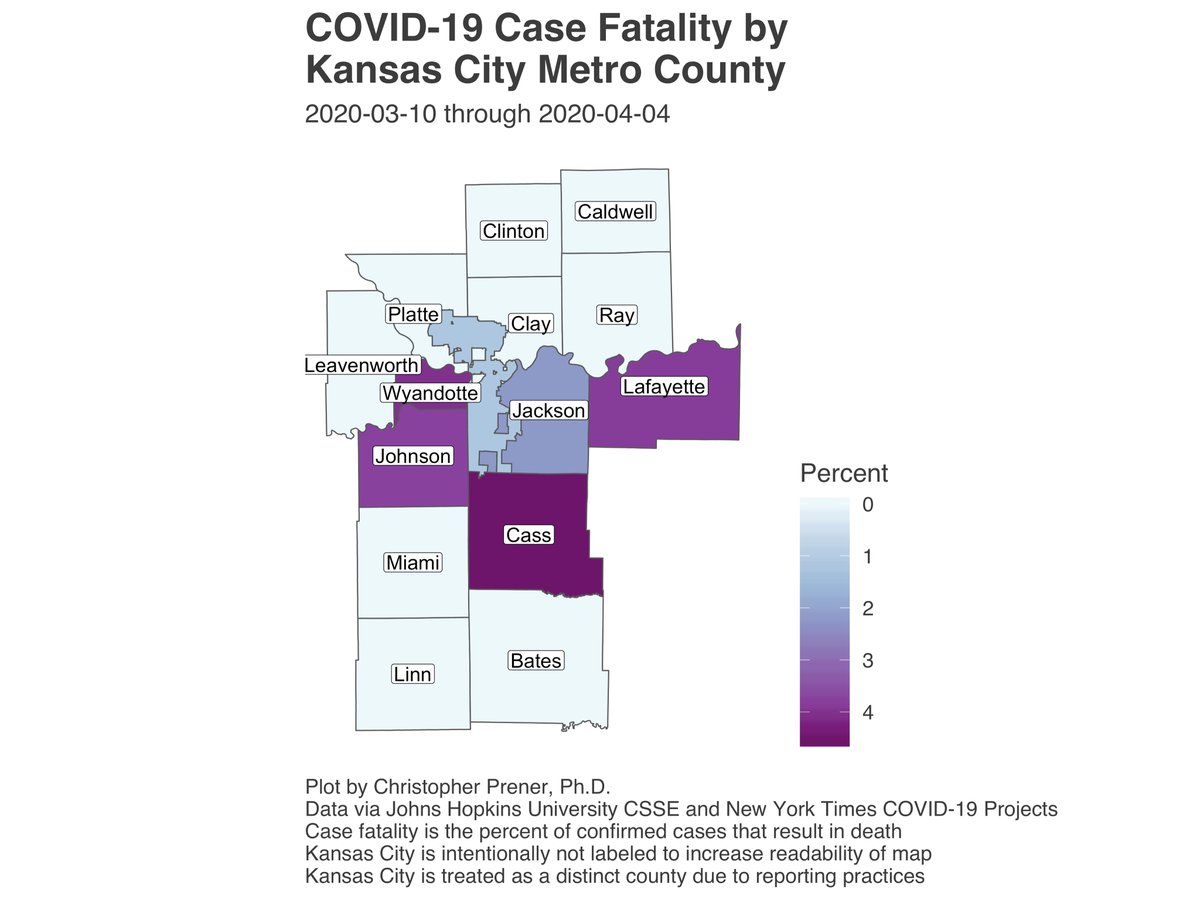
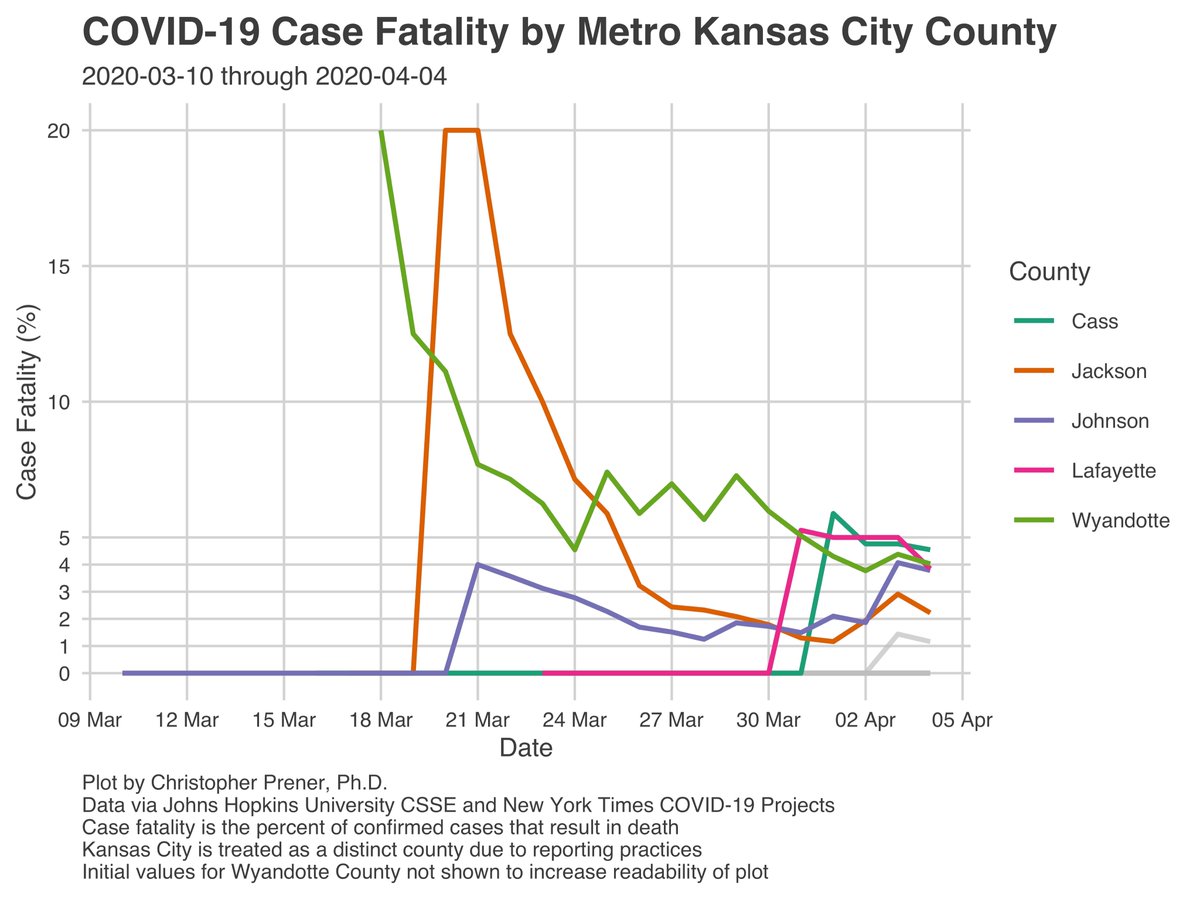
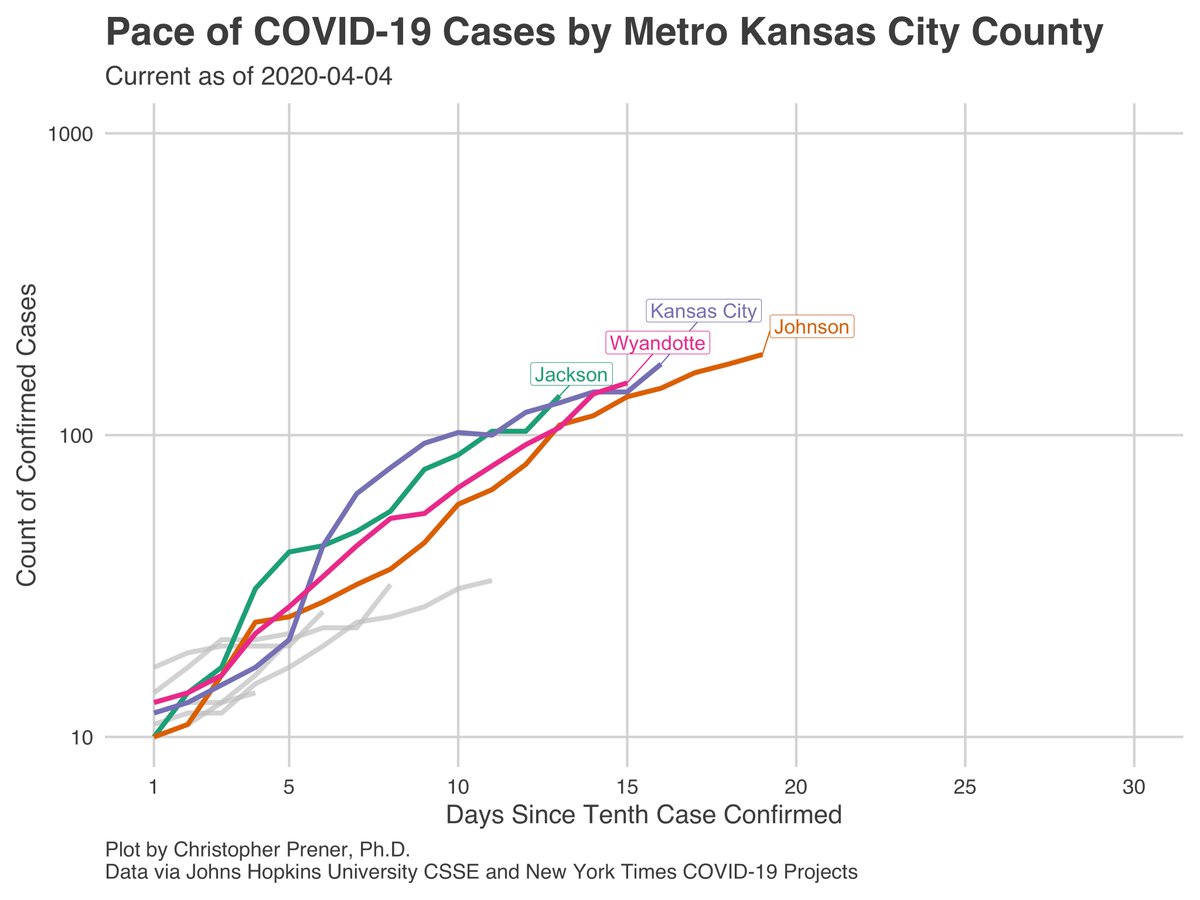
In the #KansasCity metro, the concentration of confirmed cases counties to be in outlying counties (Wyandotte in particular) and not in #KCMO itself, though growth is happening there too. Case fatality rates are higher in KC - around 4% in most counties with deaths there. 9/12
Finally, I want to point out one particularly important data point on the metro log plots - St. Charles County is on the *exact same pace* as St. Louis City is. Numbers are lower right now, but they are following an identical trajectory. 10/12
My standard caveats still apply - I want to remind folks that (1) these are historical data that reflect infections 2-3 weeks ago. (2) We are getting to the end of pre stay at home order infections. (3) These are biased by limited testing in MO and elsewhere. 11/12
As always, my #rstats code and and data are all available on @GitHub - https://github.com/slu-openGIS/covid_daily_viz.">https://github.com/slu-openG... They& #39;re licensed for re-use with attribution, and feedback and improvements are always welcome. 12/12

 Read on Twitter
 for Missouri after a day off due to data reporting lags. I’ve seen some talk about when our “peak” is going to be here in #StLouis - not forecasting but we definitely are not showing signs of a peak yet - steady growth continues in MO. 1/12" title="Back with my morning #COVID19 update https://abs.twimg.com/emoji/v2/... draggable="false" alt="🧵" title="Thread" aria-label="Emoji: Thread"> for Missouri after a day off due to data reporting lags. I’ve seen some talk about when our “peak” is going to be here in #StLouis - not forecasting but we definitely are not showing signs of a peak yet - steady growth continues in MO. 1/12">
 for Missouri after a day off due to data reporting lags. I’ve seen some talk about when our “peak” is going to be here in #StLouis - not forecasting but we definitely are not showing signs of a peak yet - steady growth continues in MO. 1/12" title="Back with my morning #COVID19 update https://abs.twimg.com/emoji/v2/... draggable="false" alt="🧵" title="Thread" aria-label="Emoji: Thread"> for Missouri after a day off due to data reporting lags. I’ve seen some talk about when our “peak” is going to be here in #StLouis - not forecasting but we definitely are not showing signs of a peak yet - steady growth continues in MO. 1/12">
 for Missouri after a day off due to data reporting lags. I’ve seen some talk about when our “peak” is going to be here in #StLouis - not forecasting but we definitely are not showing signs of a peak yet - steady growth continues in MO. 1/12" title="Back with my morning #COVID19 update https://abs.twimg.com/emoji/v2/... draggable="false" alt="🧵" title="Thread" aria-label="Emoji: Thread"> for Missouri after a day off due to data reporting lags. I’ve seen some talk about when our “peak” is going to be here in #StLouis - not forecasting but we definitely are not showing signs of a peak yet - steady growth continues in MO. 1/12">
 for Missouri after a day off due to data reporting lags. I’ve seen some talk about when our “peak” is going to be here in #StLouis - not forecasting but we definitely are not showing signs of a peak yet - steady growth continues in MO. 1/12" title="Back with my morning #COVID19 update https://abs.twimg.com/emoji/v2/... draggable="false" alt="🧵" title="Thread" aria-label="Emoji: Thread"> for Missouri after a day off due to data reporting lags. I’ve seen some talk about when our “peak” is going to be here in #StLouis - not forecasting but we definitely are not showing signs of a peak yet - steady growth continues in MO. 1/12">
