
 Read on Twitter
1/n Finally read the latest work by @BurgerCryptoAM & @btconometrics. Once again staggering findings, further fortifying the evidence that the relation between #Bitcoin  https://abs.twimg.com/hashflags... draggable="false" alt="">& #39;s Stock-to-Flow (S/F) ratio and price (originally discovered by @100trillionUSD) is not spurious.
A thread.https://abs.twimg.com/emoji/v2/... draggable="false" alt="👇" title="Down pointing backhand index" aria-label="Emoji: Down pointing backhand index">
A thread.
2/n On March 7th, @BurgerCryptoAM published the fourth article in his series on the S/F model for #Bitcoin https://abs.twimg.com/hashflags... draggable="false" alt="">. The article contributes by suggesting a model selection framework to help determine which statistical test(s) should be used in this process. https://medium.com/burgercrypto-com/reviewing-modelling-bitcoins-value-with-scarcity-part-iv-the-theoretical-framework-leading-d248ae87a138">https://medium.com/burgercry...
3/n The article @BurgerCryptoAM refers to is a 2018 publication in The Journal of Finance and Data Science that introduces a decision tree to help researchers determine which statistical test(s) to use in time series analysis, such as economic data.
https://www.sciencedirect.com/science/article/pii/S2405918817300405">https://www.sciencedirect.com/science/a...
 to use in time series analysis, such as economic data. https://www.sciencedirect.com/science/a...")
https://www.sciencedirect.com/science/article/pii/S2405918817300405">https://www.sciencedirect.com/science/a...
4/n This suggestion was picked up by @btconometrics, who used it to conclude that ARDL models should be used in the cointegration analysis of #Bitcoin https://abs.twimg.com/hashflags... draggable="false" alt="">& #39;s S/F and price instead of the Johansen and Engle-Granger tests that had been used before. https://twitter.com/btconometrics/status/1243887604199645189">https://twitter.com/btconomet...
5/n The framework shows that we have to start with a & #39;unit root test& #39; to test for stationarity. @btconometrics used the Augmented Dickey-Fuller (ADF) and Kwiatkowski-Phillips-Schmidt-Shin (KPSS) tests to find that #Bitcoin https://abs.twimg.com/hashflags... draggable="false" alt="">& #39;s price was not stationary. https://medium.com/swlh/falsifying-stock-to-flow-as-a-model-of-bitcoin-value-b2d9e61f68af">https://medium.com/swlh/fals...
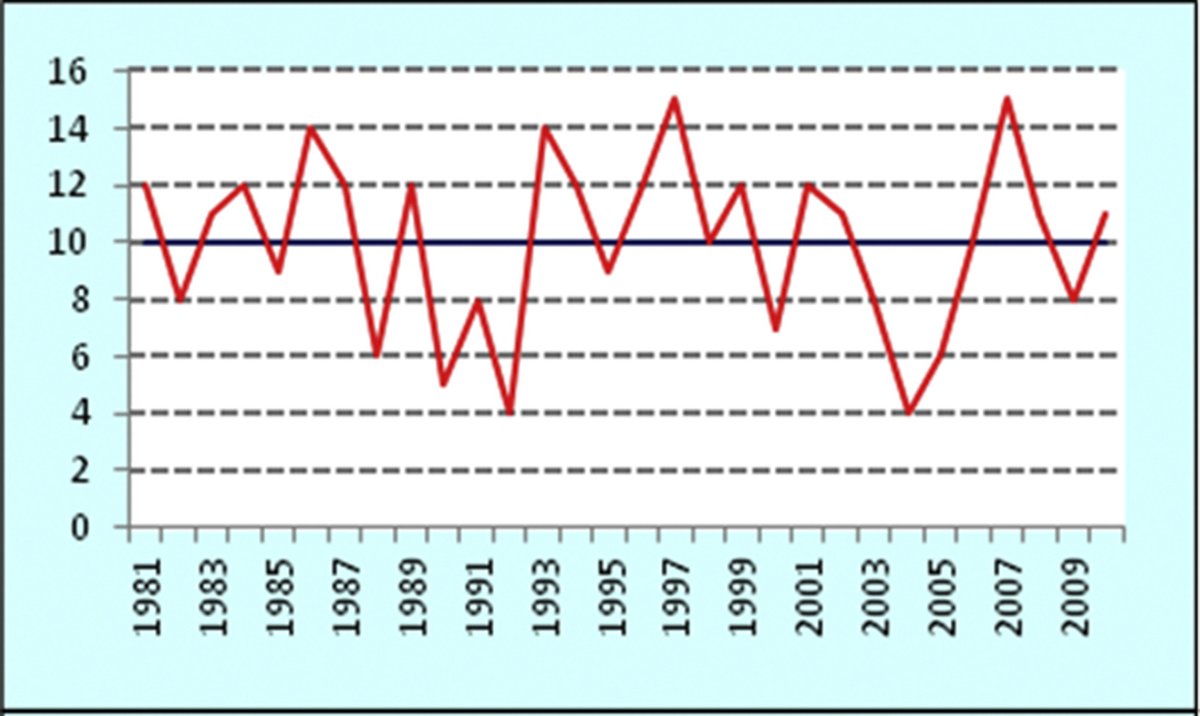
6/n From the & #39;framework-article& #39;: "A time series data is called stationary if its value tends to revert to its long-run average value and properties of data series are not affected by the change in time only (Fig. 1)."
As @btconometrics concluded, #Bitcoinhttps://abs.twimg.com/hashflags... draggable="false" alt="">& #39;s price is not.
As @btconometrics concluded, #Bitcoin
 & #39;s price is not." title="6/n From the & #39;framework-article& #39;: "A time series data is called stationary if its value tends to revert to its long-run average value and properties of data series are not affected by the change in time only (Fig. 1)."As @btconometrics concluded, #Bitcoin https://abs.twimg.com/hashflags... draggable="false" alt="">& #39;s price is not." class="img-responsive" style="max-width:100%;"/>
7/n However, the framework-article also states: "Structural break is a sudden jump or fall in an economic time series which occurs due to the change in regime, policy direction, and external shocks, among others. Structural break may occur in intercept, trend or both (Fig. 5)."
.\"")
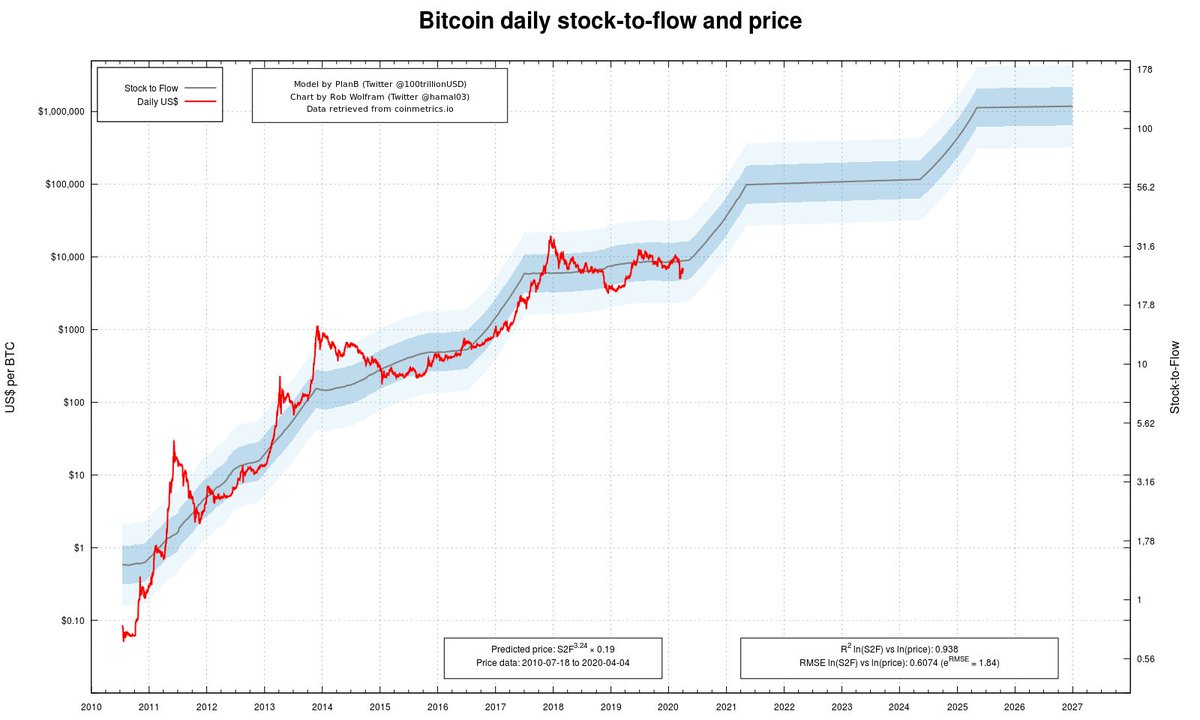
8/n If the previous tweet didn& #39;t already remind you of #Bitcoin https://abs.twimg.com/hashflags... draggable="false" alt="">& #39;s halvening, it should. The halving of the new coin issuance (=& #39;flow& #39;) doubles the S/F ratio, which can be argued to present a & #39;structural break& #39; in the time series of Bitcoin& #39;s price.
Chart by @hamal03
Chart by @hamal03
 & #39;s halvening, it should. The halving of the new coin issuance (=& #39;flow& #39;) doubles the S/F ratio, which can be argued to present a & #39;structural break& #39; in the time series of Bitcoin& #39;s price.Chart by @hamal03" title="8/n If the previous tweet didn& #39;t already remind you of #Bitcoin https://abs.twimg.com/hashflags... draggable="false" alt="">& #39;s halvening, it should. The halving of the new coin issuance (=& #39;flow& #39;) doubles the S/F ratio, which can be argued to present a & #39;structural break& #39; in the time series of Bitcoin& #39;s price.Chart by @hamal03" class="img-responsive" style="max-width:100%;"/>
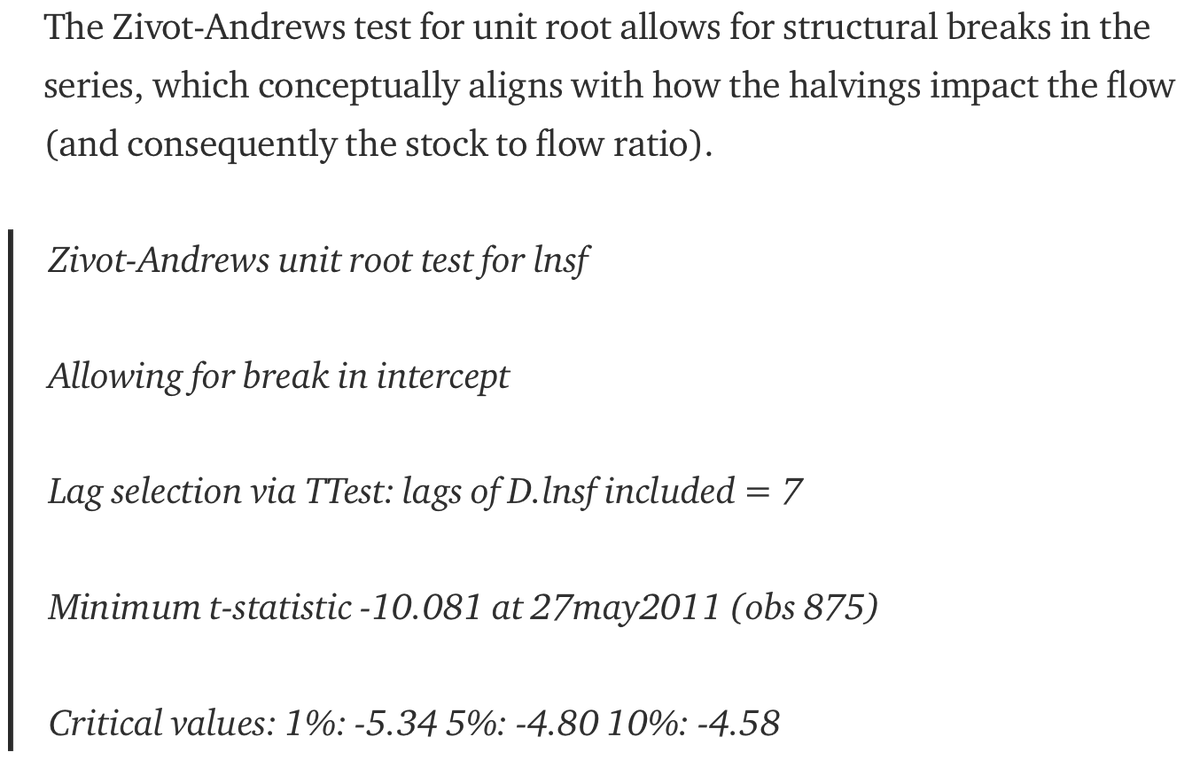
9/n This triggered @btconometrics to reconsider his original approach in testing for stationarity and use the Zivot-Andrews test that can actually account for a structural break in the time series.
His latest findings are in his March 27th article: https://medium.com/@btconometrics/stock-to-flow-influences-on-bitcoin-price-8a52e475c7a1">https://medium.com/@btconome...
His latest findings are in his March 27th article: https://medium.com/@btconometrics/stock-to-flow-influences-on-bitcoin-price-8a52e475c7a1">https://medium.com/@btconome...
10/n After this analysis, @btconometrics concluded that:
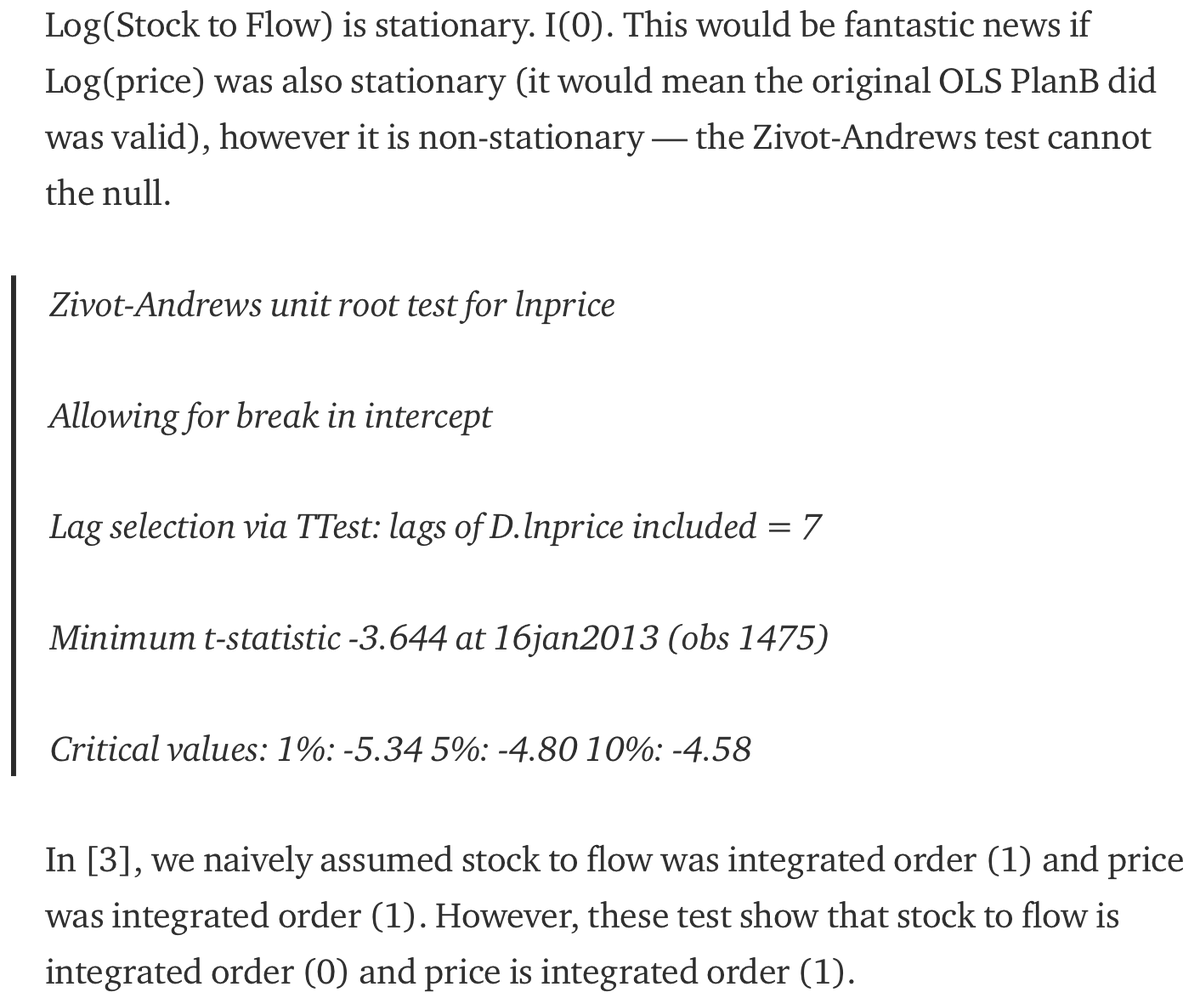
- #Bitcoinhttps://abs.twimg.com/hashflags... draggable="false" alt="">& #39;s (logarithmic) price is indeed not stationary
- ... but its (logarithmic) S/F ratio over time actually is!
- #Bitcoin
- ... but its (logarithmic) S/F ratio over time actually is!
 & #39;s (logarithmic) price is indeed not stationary- ... but its (logarithmic) S/F ratio over time actually is!" title="10/n After this analysis, @btconometrics concluded that:- #Bitcoin https://abs.twimg.com/hashflags... draggable="false" alt="">& #39;s (logarithmic) price is indeed not stationary- ... but its (logarithmic) S/F ratio over time actually is!">
 & #39;s (logarithmic) price is indeed not stationary- ... but its (logarithmic) S/F ratio over time actually is!" title="10/n After this analysis, @btconometrics concluded that:- #Bitcoin https://abs.twimg.com/hashflags... draggable="false" alt="">& #39;s (logarithmic) price is indeed not stationary- ... but its (logarithmic) S/F ratio over time actually is!">
11/n @btconometrics& #39;s previous analysis used the Johansen and Engle-Granger tests to assess cointegration, since he believed both S/F ratio and price to be non-stationary at that time. This new approach suggests that since they& #39;re mixed, ARDL models should actually be used.

12/n So, what is an ARDL model?
From the framework-article: "An autoregressive distributed lag (ARDL) model is an ordinary least square (OLS) based model which is applicable for both non-stationary time series as well as for times series with mixed order of integration."
From the framework-article: "An autoregressive distributed lag (ARDL) model is an ordinary least square (OLS) based model which is applicable for both non-stationary time series as well as for times series with mixed order of integration."
13/n Based on his latest ARDL model analysis, @btconometrics concluded that "We can see stock to flow has a significant long run influence on price."


14/n However, Nick also concluded that "Further research is required as the coefficient for the long run parameter is significantly lower than the OLS parameter. Future research should focus on improving the ARDL specification, (...)"
15/n "(...) including adjusting for confounding or potentially effect mediating variables (such as the difficulty adjustment)."
Nick& #39;s latest (April 3rd) analysis using simulations showed that price predictions based on this model are indeed more modest: https://twitter.com/btconometrics/status/1246066744382246916">https://twitter.com/btconomet...
 including adjusting for confounding or potentially effect mediating variables (such as the difficulty adjustment).\"Nick& #39;s latest (April 3rd) analysis using simulations showed that price predictions based on this model are indeed more modest: https://twitter.com/btconomet...")
Nick& #39;s latest (April 3rd) analysis using simulations showed that price predictions based on this model are indeed more modest: https://twitter.com/btconometrics/status/1246066744382246916">https://twitter.com/btconomet...
16/n Summary:
- Based on the Zivot-Andrews test, #Bitcoinhttps://abs.twimg.com/hashflags... draggable="false" alt="">& #39;s S/F ratio is a stationary variable, while price is not.
- Therefore, ARDL models that can account for mixed stationarity need to be used.
- The ARDL model suggests that Bitcoin& #39;s price and S/F are indeed cointegrated.https://abs.twimg.com/emoji/v2/... draggable="false" alt="🔥" title="Fire" aria-label="Emoji: Fire">
- Based on the Zivot-Andrews test, #Bitcoin
- Therefore, ARDL models that can account for mixed stationarity need to be used.
- The ARDL model suggests that Bitcoin& #39;s price and S/F are indeed cointegrated.
17/n Personal thought: I& #39;m wondering if the current macro-economic circumstances could actually turn out to be an & #39;external shock& #39; that causes a structural break in the time series (either to the downside due to panic or to the upside due to (hyper)inflation). https://abs.twimg.com/emoji/v2/... draggable="false" alt="🤔" title="Thinking face" aria-label="Emoji: Thinking face"> #staysafe


