This is PART 1 of Learning the relation bw Price(P) & Volume(V). I will be first explaining the Fundamentals of P&V in this thread. In the subsequent Threads I will be getting into more details & showing examples of recent Stock Market charts to make you understand even better.*1
The Best part about P & V is that both of them are tools that are freely available in every single market. So does not matter if you are Trading in Equities, commodities or Forex you can use it in all of them effectively Also the concepts work the same in all Time Frames aswell*2
1 of Dow’s Principle belief is that V is necessary to confirm whether the movement in P is genuine or not, ie. If P is moving with low V, it could not be trusted easily. But when P moves along with a significant rise in V then it can be considered as a genuine move.*3
V & P analysis is relative in nature & hence will lead to a discretionary based Trading style. Basically what I mean is u will have to put in hours in front of the charts. There is no shortcut to learning how to trade. If you want to earn then you simply got to learn.*4
Vol increases and decreases due to the activity of big sharks (Smart Money) in the market so we must try to be trading in the direction of the big sharks always. Because Big Sharks almost always win, If you can’t beat them, join them, our goal is to make money.*5
For Technical Analysis, At Start Only two things you need to consider while analyzing a candlestick, First is the wick of the candle & second would be the size of the body of the candlestick. Along with this you need to consider the Vol as well to get a more complete picture.*6
When the price action is supported by volume (Validation), you can expect the price to move in the direction you are planning to take trade and most of the time you will be rite. But when price is not backed up by volume (Anomaly), you can expect fake out most of the time.*7
Take Note.
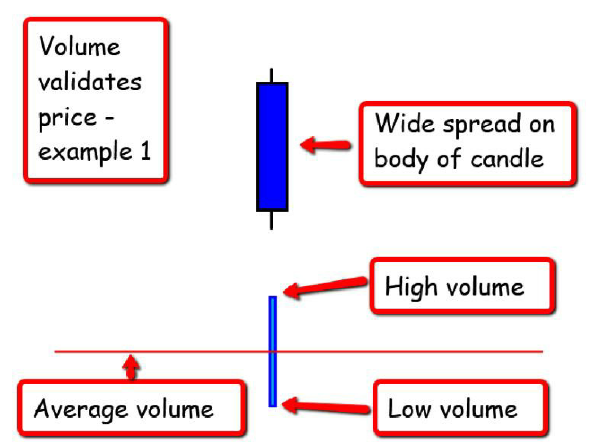
Case 1 - Big body Candle with high volume (Strong Market Sentiment) – Validated Price Action
(Explanation – A lot of effort is required to make the price move a lot in one direction, and this effort should be seen in terms of above average volume). Example 1*8
Case 1 - Big body Candle with high volume (Strong Market Sentiment) – Validated Price Action
(Explanation – A lot of effort is required to make the price move a lot in one direction, and this effort should be seen in terms of above average volume). Example 1*8
Case 2 – Small body candle having low volume (Weak Market Sentiment) – Validated Price Action
(Explanation – Only Small effort is required to make the price move a little in one direction, and this effort should be seen in terms of below average volume). Example 2 *9
(Explanation – Only Small effort is required to make the price move a little in one direction, and this effort should be seen in terms of below average volume). Example 2 *9
Case 3 - Big Body Candle containing low V – Anomaly in Price action
(Explanation – high probability to be a trap by market makers (Early warning) so that they can trap more ppl into taking the position @ the same time hunting SLs and then reverse the direction of the market. *10
(Explanation – high probability to be a trap by market makers (Early warning) so that they can trap more ppl into taking the position @ the same time hunting SLs and then reverse the direction of the market. *10
The low volume bar is showing that the smart money is not joining in this price action as they are only testing whether there is any demand left at a higher price). Example 3 *11
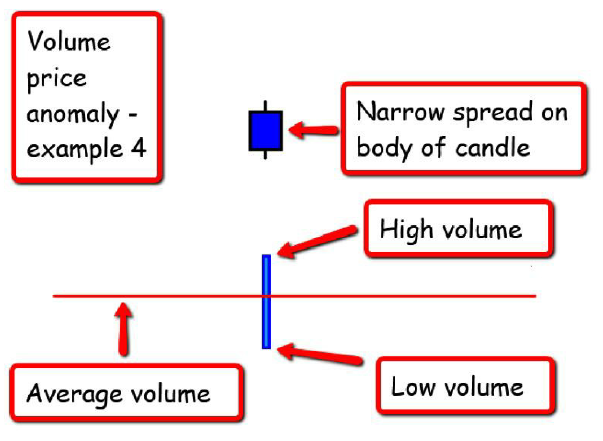
Case 4 – Small Body Candle Containing High Vol – Anomaly in Price Action
(Explanation – high probability that the market is about to reverse (Early warning) Retail traders are eager to initiate new trades(getting Trapped) while the smart money is exiting their position)*12
(Explanation – high probability that the market is about to reverse (Early warning) Retail traders are eager to initiate new trades(getting Trapped) while the smart money is exiting their position)*12
These anomalies and validation should be observed closely while analyzing charts.
I will be posting the continuation of this thread soon where I will be introducing more detailed concepts that will complete the big picture(in time) and also see some real examples. Stay Tuned.
I will be posting the continuation of this thread soon where I will be introducing more detailed concepts that will complete the big picture(in time) and also see some real examples. Stay Tuned.

 Read on Twitter


