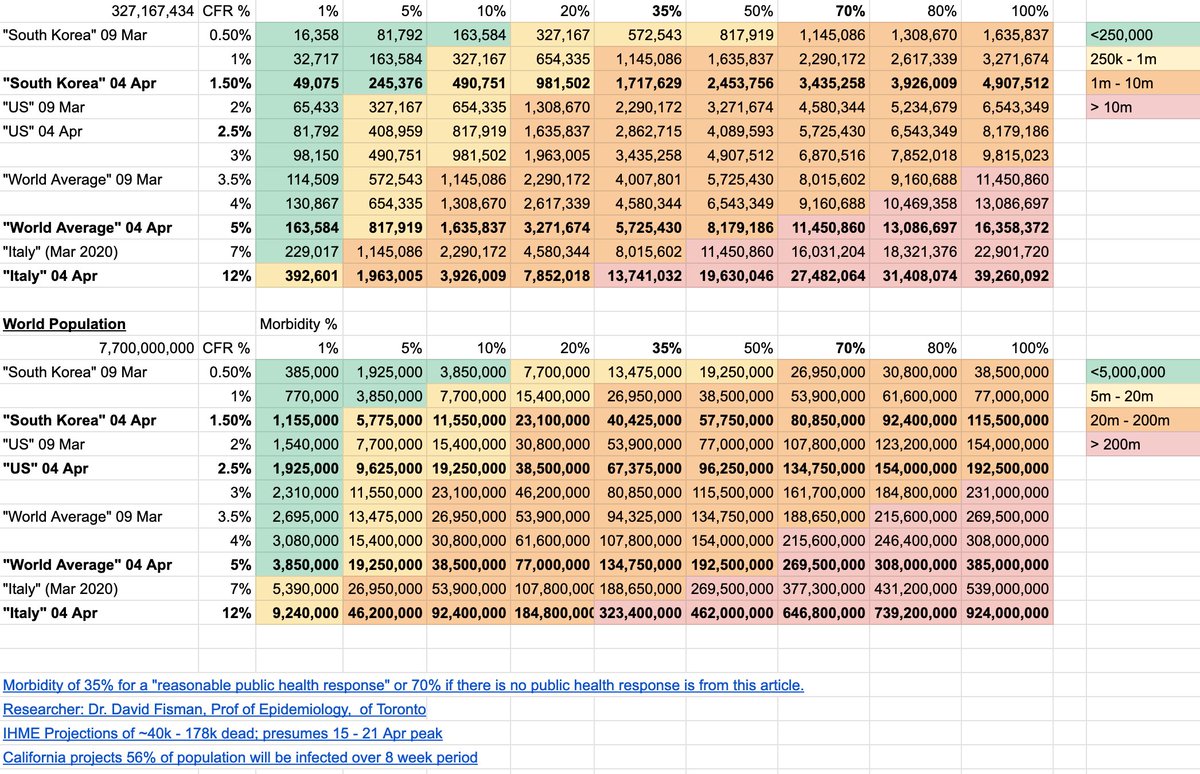
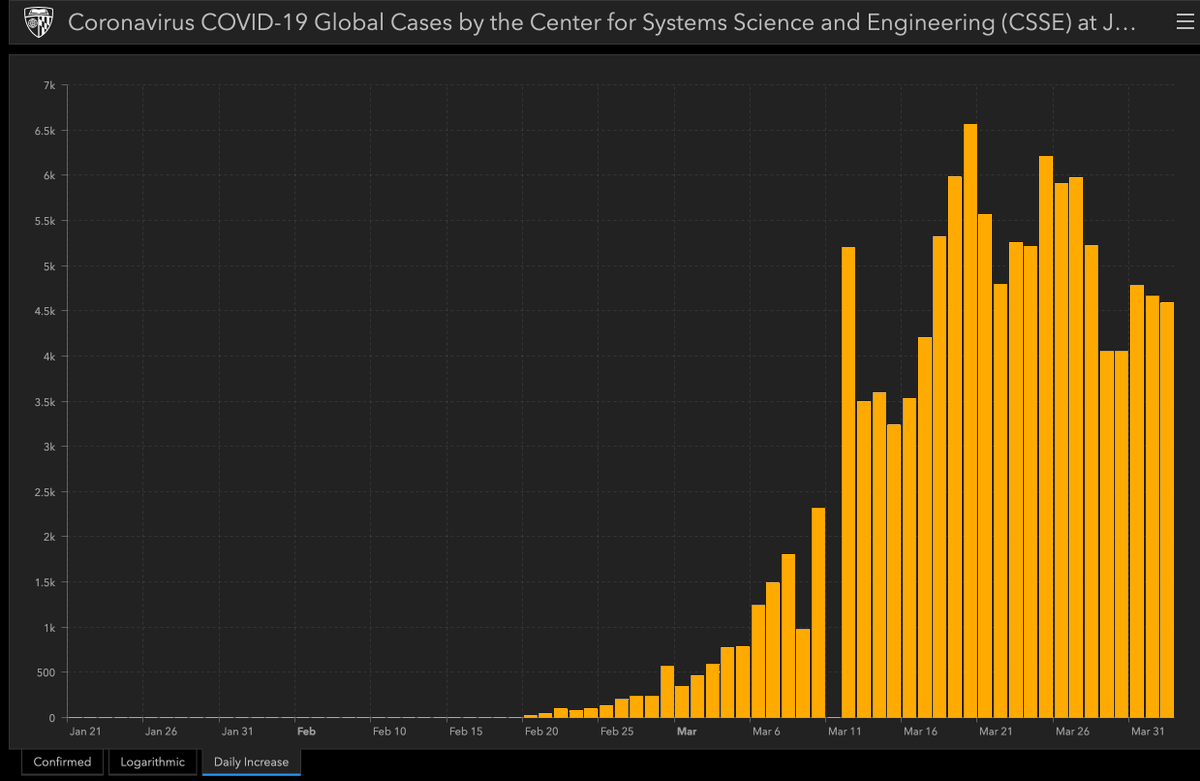
We keep getting conflicting reports re #coronavirus overall mortality and morbidity. Are we going to see 100k& #39;s die or millions? In my spreadsheet here ( #gid=2028211391">https://docs.google.com/spreadsheets/d/1K_jLQVedAK_-3nHdok7aoyYMY19qj1OtfaMTaguAOME/edit #gid=2028211391)">https://docs.google.com/spreadshe... I try to analyze the numbers. But I need people to sanity-check my logic and #CheckMyMath 1/
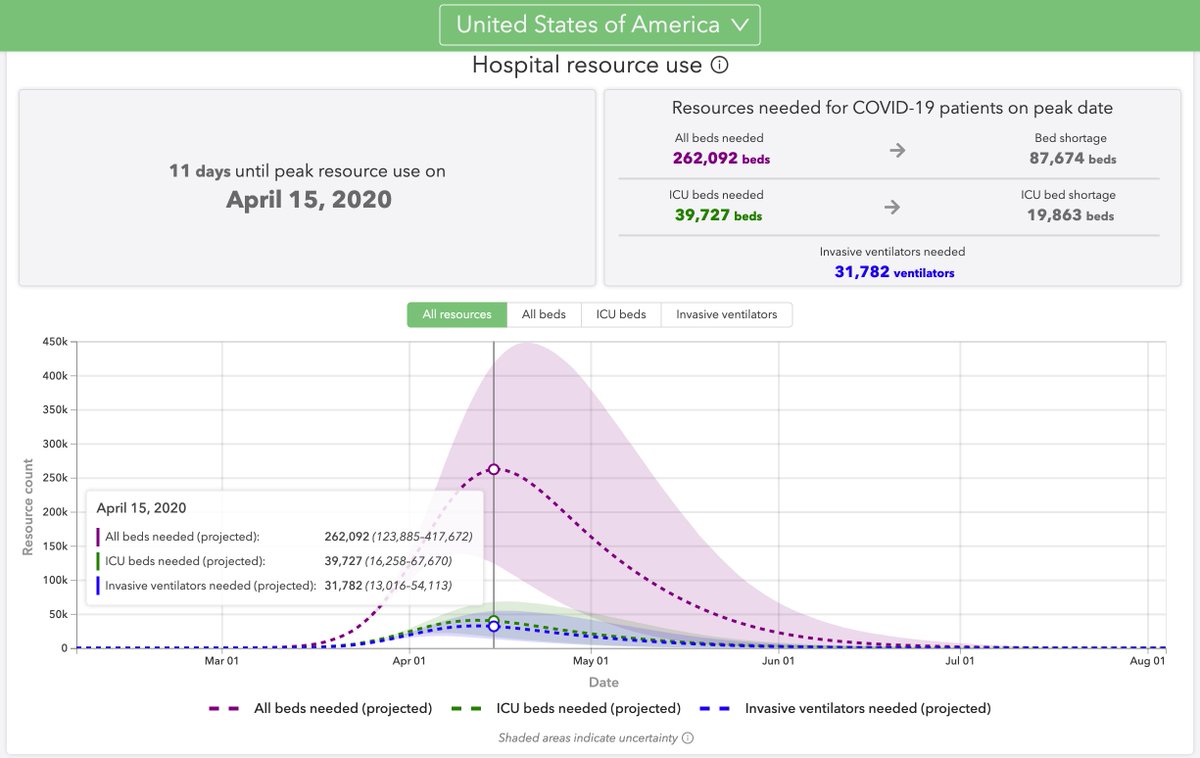
According to @IHME_UW
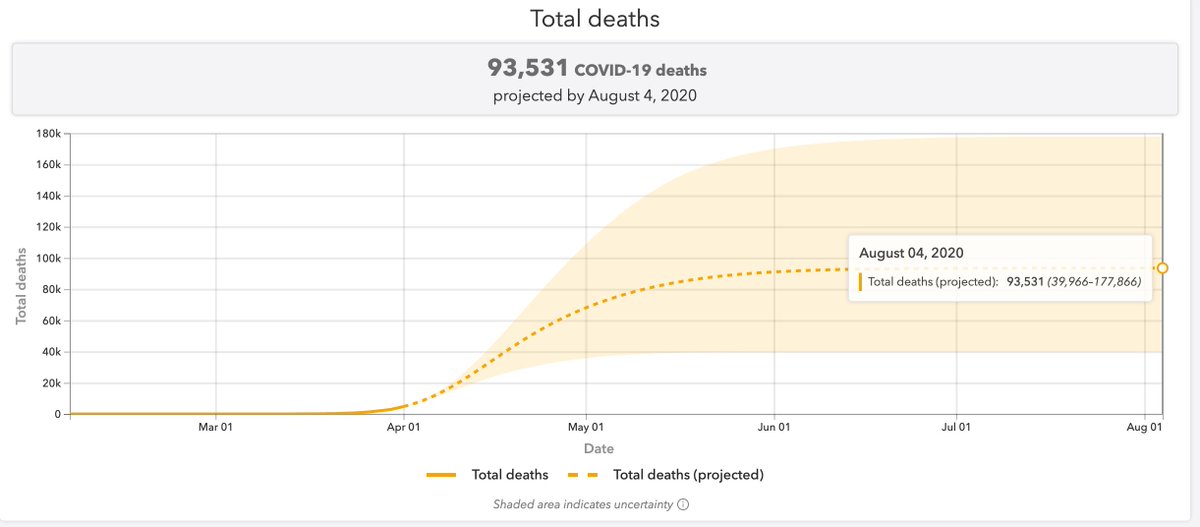
dashboard ( https://covid19.healthdata.org/projections )">https://covid19.healthdata.org/projectio... they are looking at the disease peaking ~15 Apr, and then subsiding, and presume sheltering measures will be needed only through May. They give a cone of 39k - 178k dead. 2/
dashboard ( https://covid19.healthdata.org/projections )">https://covid19.healthdata.org/projectio... they are looking at the disease peaking ~15 Apr, and then subsiding, and presume sheltering measures will be needed only through May. They give a cone of 39k - 178k dead. 2/
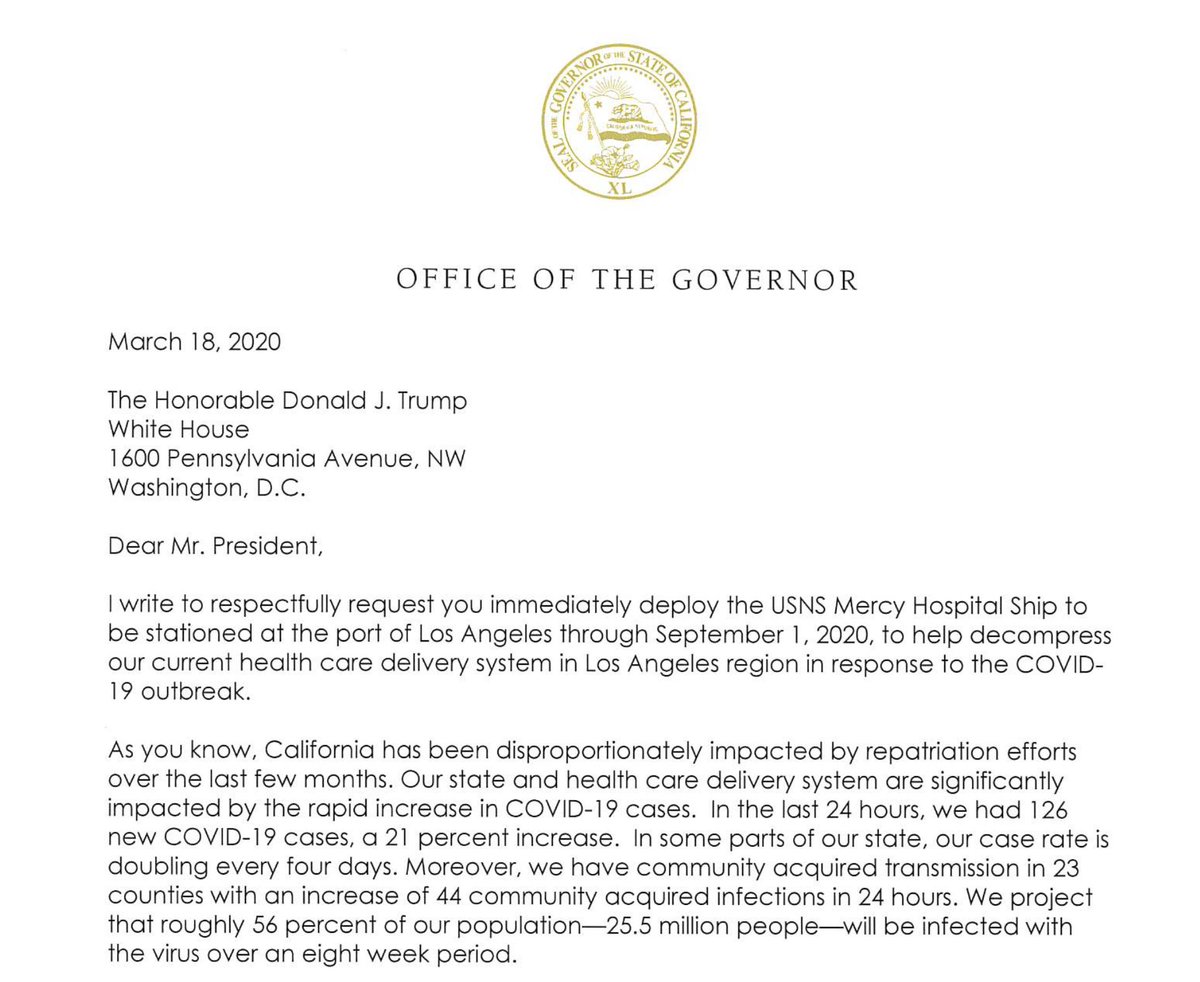
However, Gov. Gavin Newsom believes the disease will reach 56% of the California populace (25.5m) over an 8 week period ( https://thehill.com/policy/defense/488547-california-projects-56-percent-of-the-population-will-be-infected-over-8-week).">https://thehill.com/policy/de... That projection was made back on 19 Mar, which means social distancing through Mid-May at least. 3/
Given the current rate of death in the U.S. is at 2.5% of confirmed #coronavirus cases, basic math would tell us 25.5m * 2.5% = (25,500,000 * 0.025 =) 637,500 dead. So something isn& #39;t adding up. Either we are going to see bell curves and S-curves as IHME says, or not. 4/
Italy, though savaged by the disease to date, does point to some hope for #coronavirus. This is their daily new infections. So while their fatality rate has risen from 7% in Mar to 12% in Apr, they *might* be seeing new cases tailing off. 5/
I am looking forward to seeing the bell curves & S-curves. But we need to find a way to reconcile the dire predictions of this epidemic reaching 50%, 70% or 80% of the population with it somehow seeming to taper off at <10% of overall populations. Doomsday, or defused bomb? 6/
Back to that chart I shared. I am still staring at it. I am still wondering how we avoid having this spread across even 10% to 20% of the U.S. population. If the U.S. keeps up current 2.5% mortality rate, that& #39;s 800k - 1.6m dead. #CheckMyMath 7/
And if we look at a global current trend rate of 5% fatality rate (which has risen since March, when it stood at 3.5%), if it even has a 10% - 20% prevalence rate, we& #39;re talking 38m - 77m dead. #CheckMyMath 8/
I can& #39;t escape looking at that projected 70% overall global morbidity rate, and a current 5% death rate. *If* (big if) we do see it spread that far at current lethality that means 269 million dead. #CheckMyMath and please, for God& #39;s sake, prove me wrong. 9/
At the start, I have to admit I underappreciated just how huge #coronavirus was going to be. I didn& #39;t dismiss it or call it fake news, but, like many, I didn& #39;t see how fast it was going to spread. Embarrassing in retrospect: https://towardsdatascience.com/chasing-the-data-coronavirus-802d8a1c4e9a">https://towardsdatascience.com/chasing-t... 10/
However, now I want to make sure I am not lurching the other direction, turning into Chicken Little and falsely claiming the sky is falling. So I appeal to the professional epidemiologists & data scientists & simply ask again #CheckMyMath. 11/x
Post Script: Here is my thread from back on 09 Mar when I first came across this mathematical conundrum. I am still trying to reconcile doomsday with a "defused bomb" scenario. https://twitter.com/PeterCorless/status/1237220525639794689?s=20">https://twitter.com/PeterCorl...

 Read on Twitter