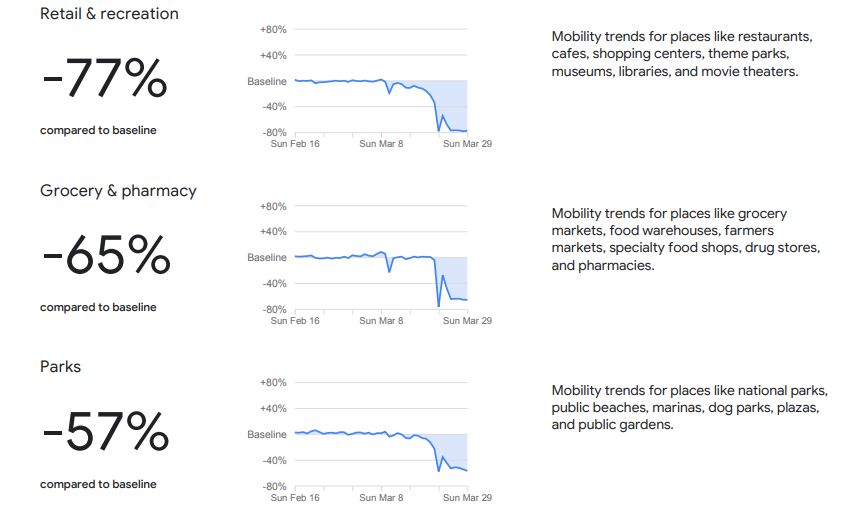
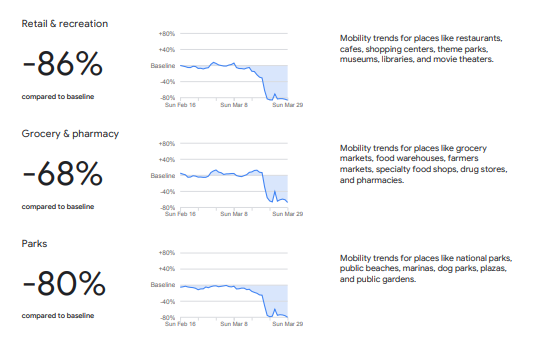
So Google has these mobility reports now and you can see how mobility has changed for specific aspects. They compare to a baseline of that country (there& #39;s the time in the chart so u can see deterioration since early March).
India: -77% for retail; -65% for grocery; -57% parks
India: -77% for retail; -65% for grocery; -57% parks
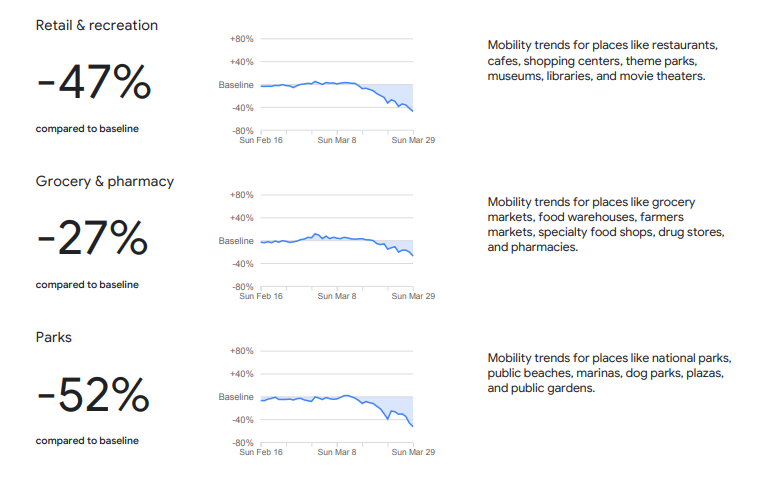
Indonesia  https://abs.twimg.com/emoji/v2/... draggable="false" alt="🇮🇩" title="Flag of Indonesia" aria-label="Emoji: Flag of Indonesia">: -47% for retail & recreation; -27% for grocery & pharmacy; -52% for parks; -54% for transit; -15% for workplace
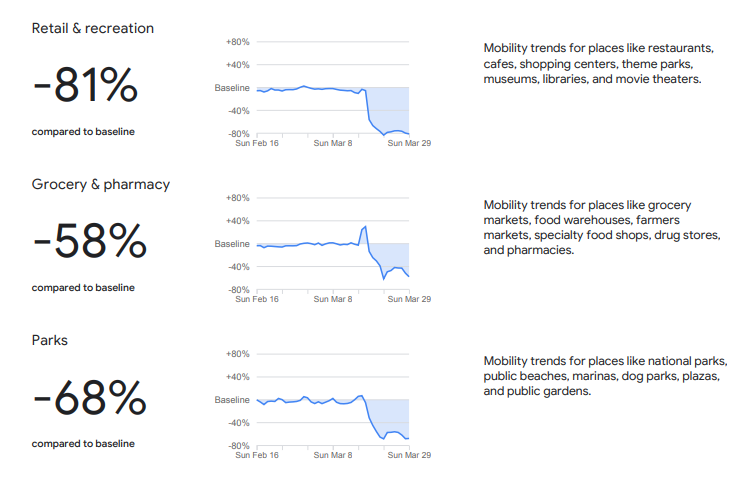
Malaysia  https://abs.twimg.com/emoji/v2/... draggable="false" alt="🇲🇾" title="Flag of Malaysia" aria-label="Emoji: Flag of Malaysia">: -81% for retail & recreation; -58% for grocery & pharma; -68% parks; -83% transit stations; -52% workplace
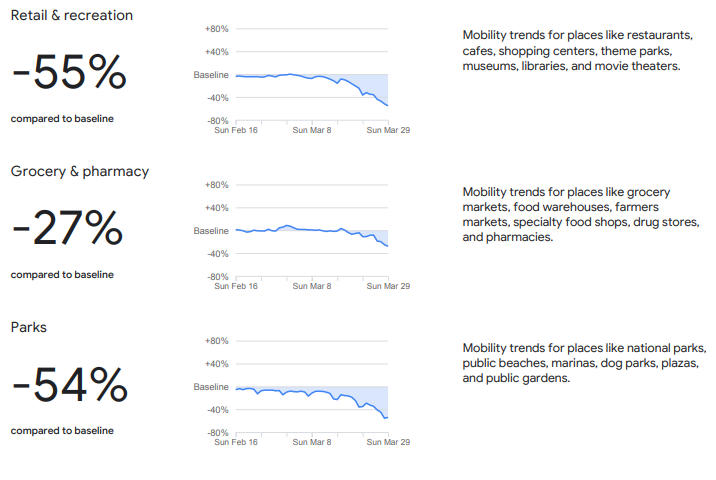
Thailand  https://abs.twimg.com/emoji/v2/... draggable="false" alt="🇹🇭" title="Flag of Thailand" aria-label="Emoji: Flag of Thailand">: -55% retail & recreation; -27% grocery & pharma; -54% parks; -61% transit stations & -21 workplaces
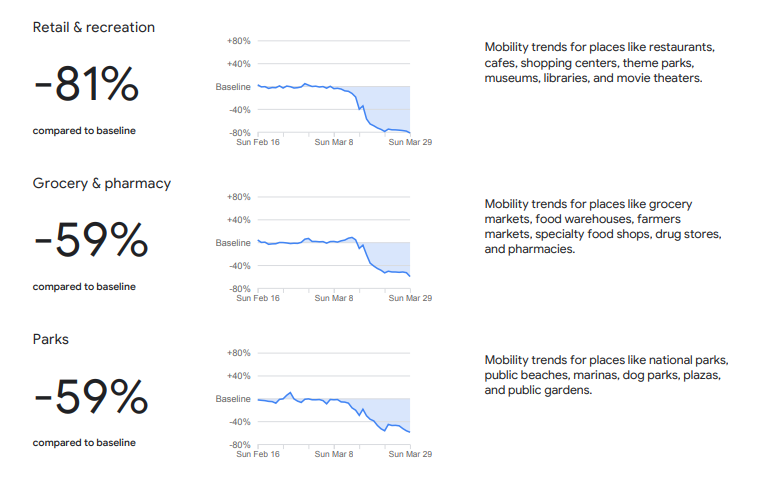
The Philippines  https://abs.twimg.com/emoji/v2/... draggable="false" alt="🇵🇭" title="Flag of Philippines" aria-label="Emoji: Flag of Philippines">: -81% retail & recreation; -59% grocery & pharma & parks -59% & -82% transit and -54% workplaces
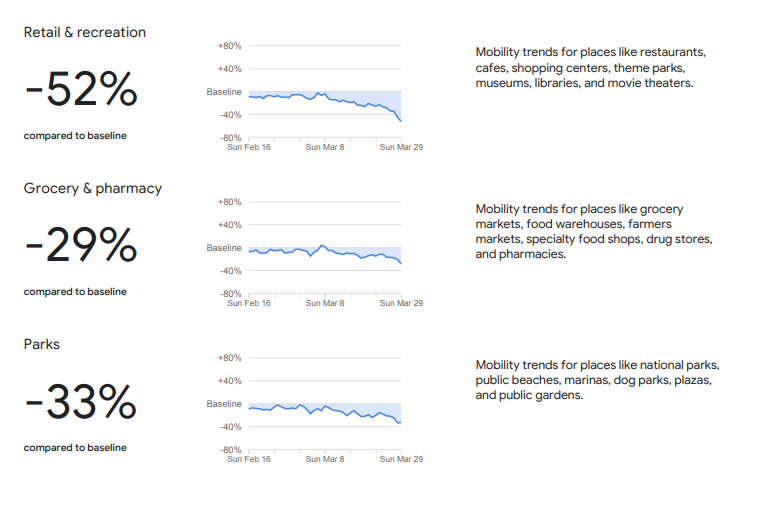
Vietnam  https://abs.twimg.com/emoji/v2/... draggable="false" alt="🇻🇳" title="Flag of Vietnam" aria-label="Emoji: Flag of Vietnam"> lock-down hasn& #39;t started yet till 1 April & data already: -52% retail sales & recreation; -29% grocery & pharma; -33% parks; -49% transit stations; -20% workplaces
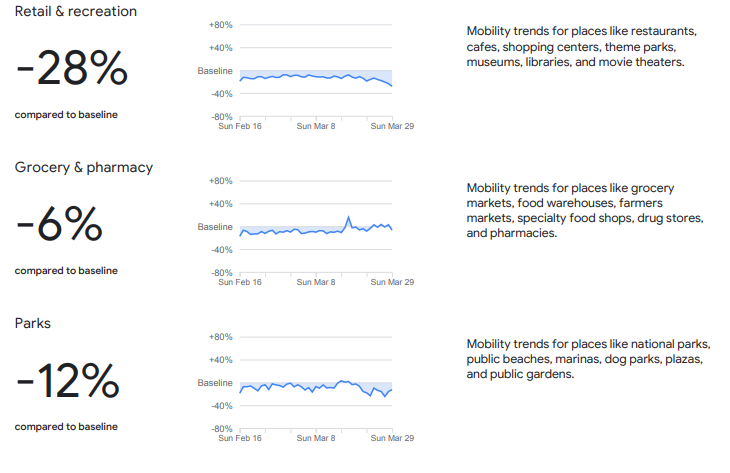
Singapore (before the circuit breaker or soft lock-down): -28% retail & recreation; -6% grocery & pharma; -12% parks; -40% transit stations; -15% workplace
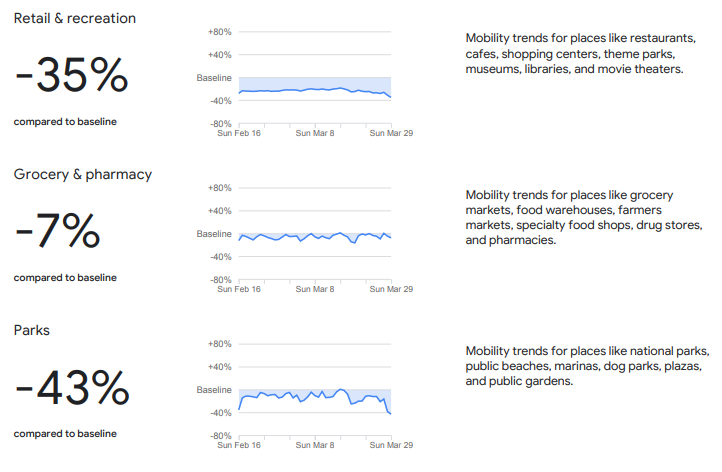
Hong Kong  https://abs.twimg.com/emoji/v2/... draggable="false" alt="🇭🇰" title="Flag of Hong Kong" aria-label="Emoji: Flag of Hong Kong">: -35% for retail & recreation; -7% for grocery & pharma; -43% for parks; -45% for transit stations; -24% workplaces
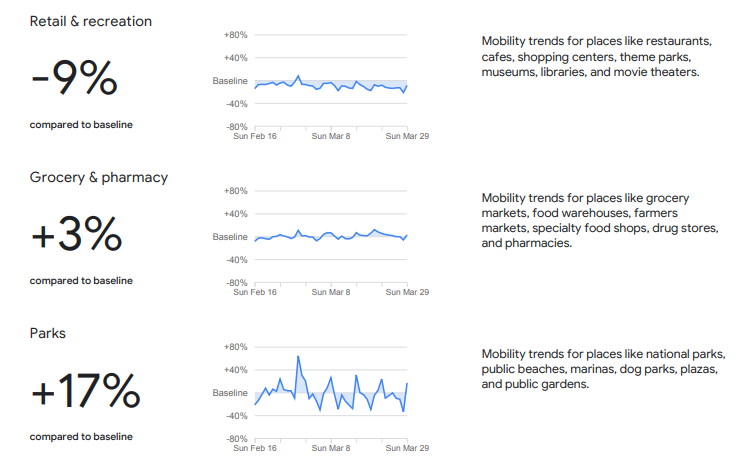
Taiwan  https://abs.twimg.com/emoji/v2/... draggable="false" alt="🇹🇼" title="Flag of Taiwan" aria-label="Emoji: Flag of Taiwan">: -9% for retail & recreation; +3% for grocery; +17% for parks; -24% for transit station; -1% for workplaces.
I think we have a winner of mobility so far! https://abs.twimg.com/emoji/v2/... draggable="false" alt="👏🏻" title="Clapping hands sign (light skin tone)" aria-label="Emoji: Clapping hands sign (light skin tone)">
 https://abs.twimg.com/emoji/v2/... draggable="false" alt="👏🏻" title="Clapping hands sign (light skin tone)" aria-label="Emoji: Clapping hands sign (light skin tone)">
 https://abs.twimg.com/emoji/v2/... draggable="false" alt="👏🏻" title="Clapping hands sign (light skin tone)" aria-label="Emoji: Clapping hands sign (light skin tone)">
I think we have a winner of mobility so far!
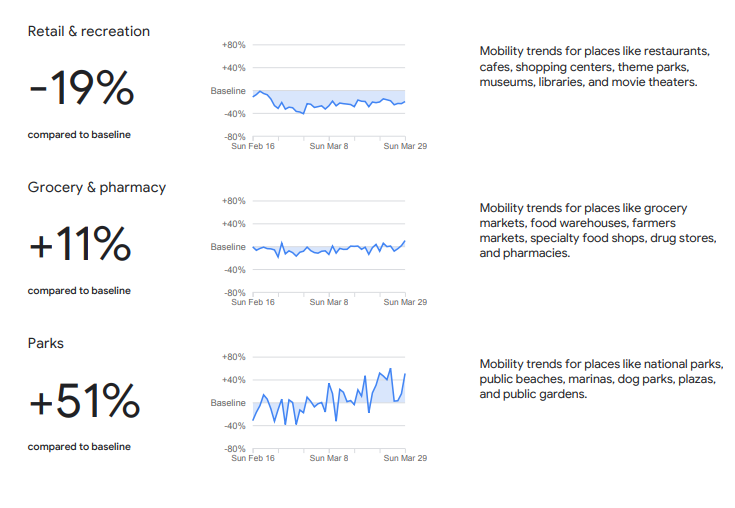
Yes, South Korea  https://abs.twimg.com/emoji/v2/... draggable="false" alt="🇰🇷" title="Flag of South Korea" aria-label="Emoji: Flag of South Korea"> is like Taiwan but less good in terms of drop of retail sales but seems HEALTHY!
-19% retail sales & recreation
+11% grocery & pharma
+51% parks!!!
-17% transit stations
-16% work place
Yes, Taiwan is #1 in mobility by along shot & South Korea is #1 https://abs.twimg.com/emoji/v2/... draggable="false" alt="👏🏻" title="Clapping hands sign (light skin tone)" aria-label="Emoji: Clapping hands sign (light skin tone)">
 https://abs.twimg.com/emoji/v2/... draggable="false" alt="👏🏻" title="Clapping hands sign (light skin tone)" aria-label="Emoji: Clapping hands sign (light skin tone)">
 https://abs.twimg.com/emoji/v2/... draggable="false" alt="👏🏻" title="Clapping hands sign (light skin tone)" aria-label="Emoji: Clapping hands sign (light skin tone)">
-19% retail sales & recreation
+11% grocery & pharma
+51% parks!!!
-17% transit stations
-16% work place
Yes, Taiwan is #1 in mobility by along shot & South Korea is #1
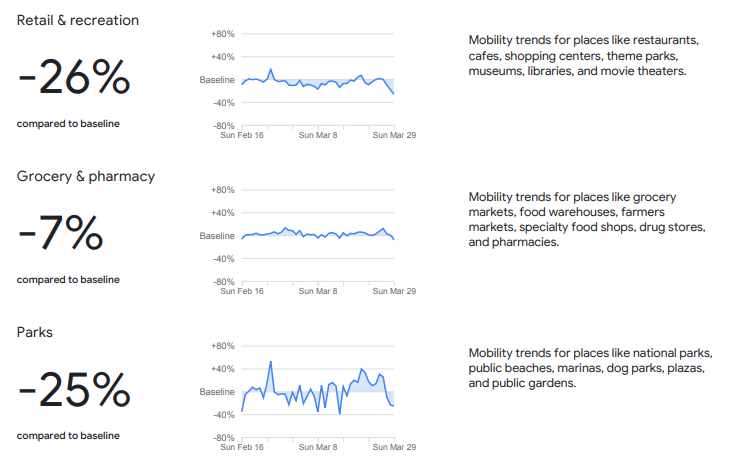
Japan  https://abs.twimg.com/emoji/v2/... draggable="false" alt="🇯🇵" title="Flag of Japan" aria-label="Emoji: Flag of Japan">: -26% retail & recreation; -7% grocery & pharma; -25% parks; -41% transit stations; -9% workplaces
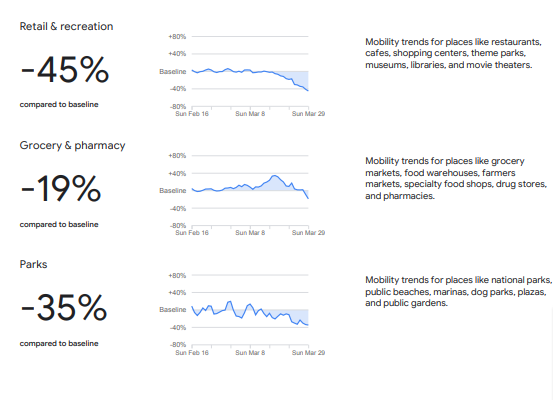
Australia: -45% retail sales; -19% grocery & pharma; -35% parks; -58% transit stations; -33% workplaces
Are you ready? This is the worst I& #39;ve seen so far & confirms the cliff diving of the PMI.
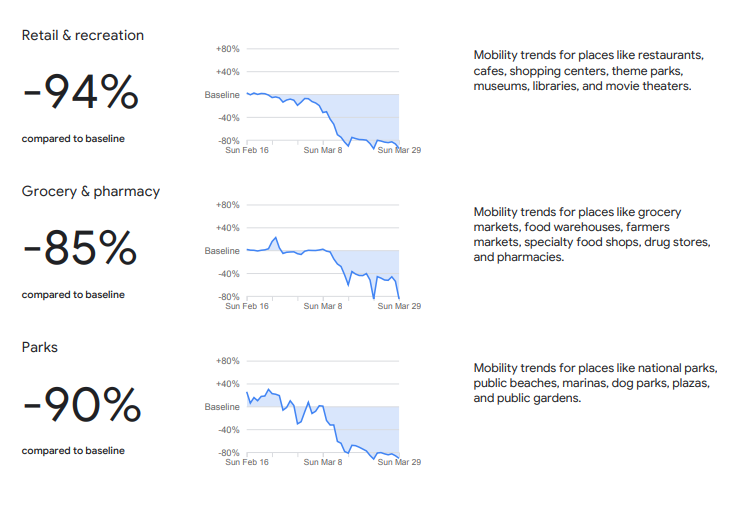
Italy https://abs.twimg.com/emoji/v2/... draggable="false" alt="🇮🇹" title="Flag of Italy" aria-label="Emoji: Flag of Italy">: -94% for retail & recreation; -85% for grocery & pharma; -90% parks; -87% transit; -63% workplace
Basically very very limited mobility.
Italy
Basically very very limited mobility.
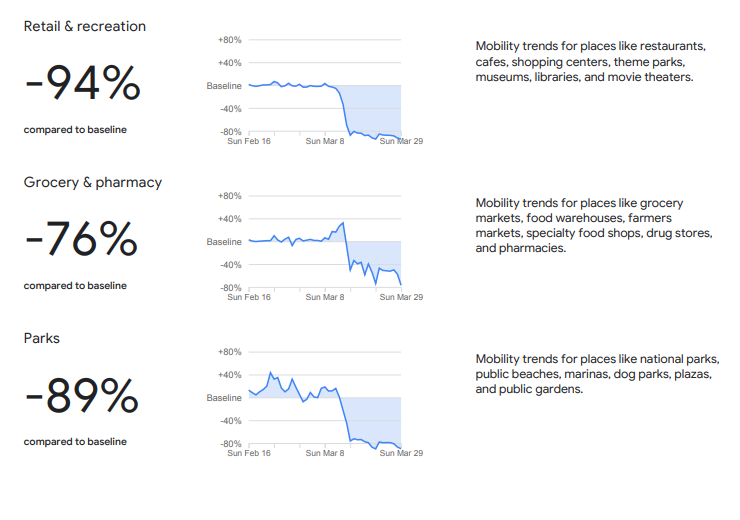
Spain  https://abs.twimg.com/emoji/v2/... draggable="false" alt="🇪🇸" title="Flag of Spain" aria-label="Emoji: Flag of Spain"> is bad too & looks just like Italy:
-94% retail sales & recreation
-76% grocery & pharma
-89% parks
-88% transit stations
-64% work places
-94% retail sales & recreation
-76% grocery & pharma
-89% parks
-88% transit stations
-64% work places
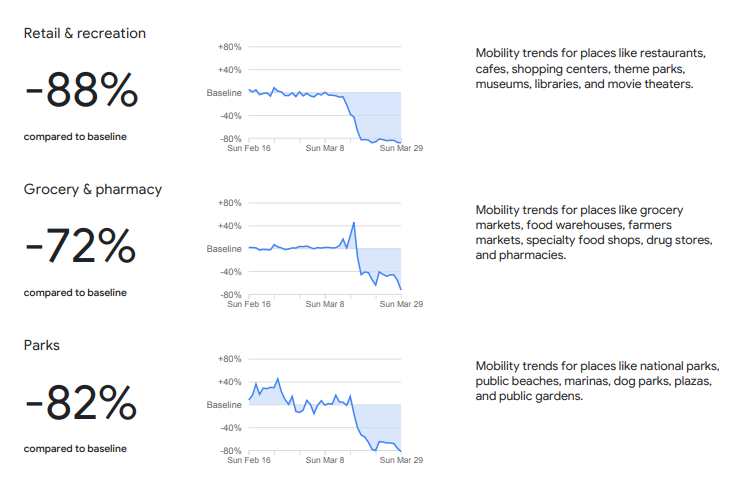
France  https://abs.twimg.com/emoji/v2/... draggable="false" alt="🇫🇷" title="Flag of France" aria-label="Emoji: Flag of France">:
-88% retail sales & creation
-72% grocery & pharma
-82% parks
-87% transportation
-56% workplaces
-88% retail sales & creation
-72% grocery & pharma
-82% parks
-87% transportation
-56% workplaces
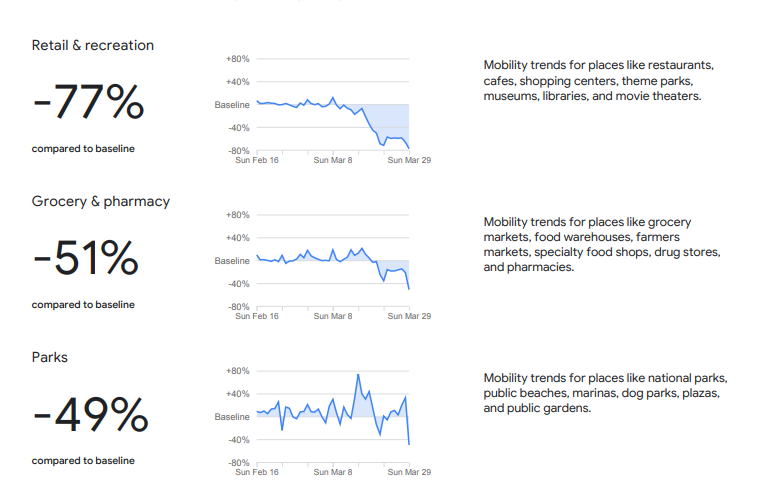
Germany  https://abs.twimg.com/emoji/v2/... draggable="false" alt="🇩🇪" title="Flag of Germany" aria-label="Emoji: Flag of Germany">:
-77% retail & recreation
-51% grocery & pharma
-49% parks
-68% transit
-39% workplaces
-77% retail & recreation
-51% grocery & pharma
-49% parks
-68% transit
-39% workplaces
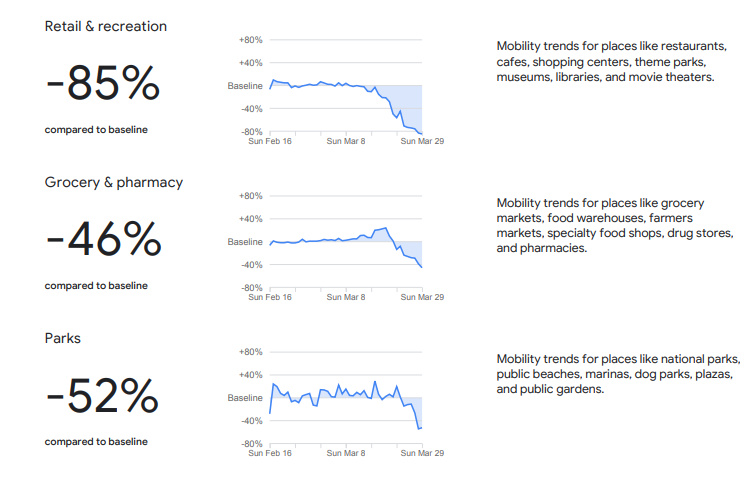
United Kingdom  https://abs.twimg.com/emoji/v2/... draggable="false" alt="🇬🇧" title="Flag of United Kingdom" aria-label="Emoji: Flag of United Kingdom">
-85% retail & recreation
-46% grocery & pharma
-52% parks
-75% transit stations
-55% workplaces
-85% retail & recreation
-46% grocery & pharma
-52% parks
-75% transit stations
-55% workplaces
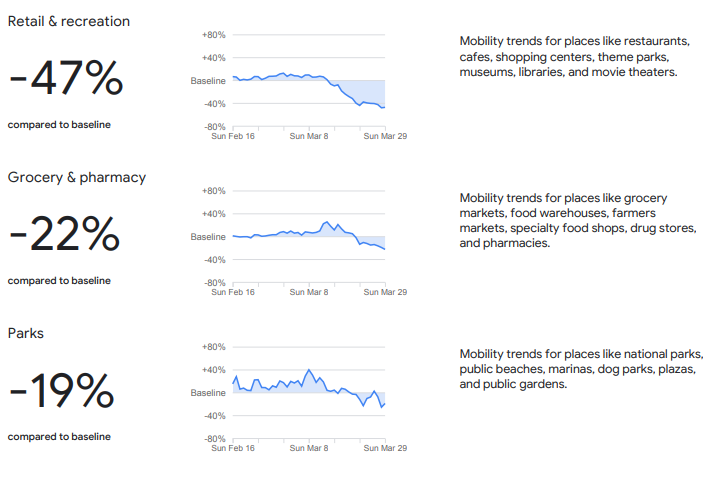
United States  https://abs.twimg.com/emoji/v2/... draggable="false" alt="🇺🇸" title="Flag of United States" aria-label="Emoji: Flag of United States">:
-47% retail & recreation
-22% grocery & pharma
-19% parks
-51% transit
-38% workplaces
-47% retail & recreation
-22% grocery & pharma
-19% parks
-51% transit
-38% workplaces
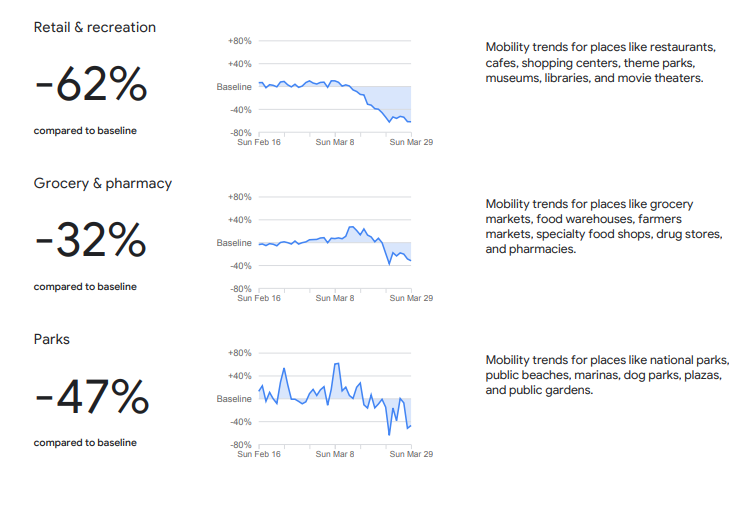
Let& #39;s look at New York, roughly about ~40% of US total confirmed & deaths (confirmed a bit below & deaths above):
-62% retail & recreation
-32% grocery & pharma
-47% parks
-68% transit stations
-46% workplaces
-62% retail & recreation
-32% grocery & pharma
-47% parks
-68% transit stations
-46% workplaces
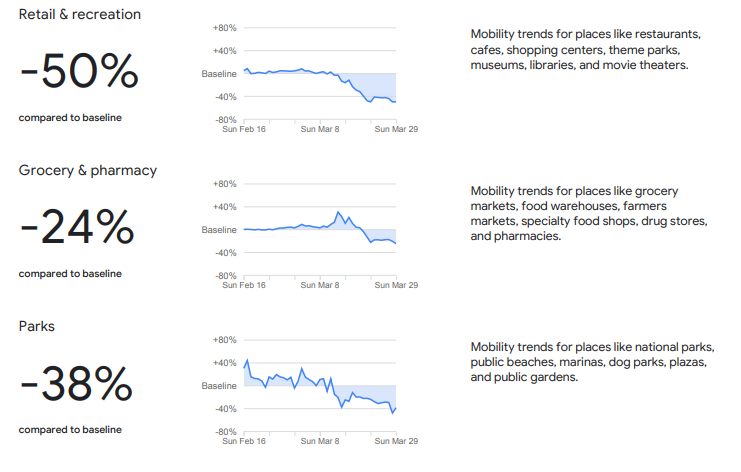
California has 3.8% of coronavirus deaths of the US & most populous state & the economy is bigger than the UK:
-50 retail and recreation
-24% grocery & pharmacy
-38% parks
-54% transit stations
-39% workplaces
-50 retail and recreation
-24% grocery & pharmacy
-38% parks
-54% transit stations
-39% workplaces
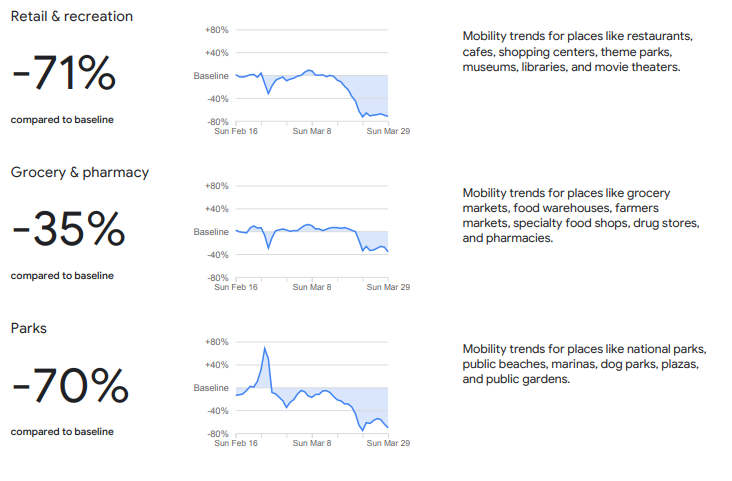
I have a few Brazilian followers so here& #39;s for you: Brazil  https://abs.twimg.com/emoji/v2/... draggable="false" alt="🇧🇷" title="Flag of Brazil" aria-label="Emoji: Flag of Brazil">
-71% retail & recreation
-35% grocery & pharma
-70% parks
-62% transit stations
-34% workplaces
-71% retail & recreation
-35% grocery & pharma
-70% parks
-62% transit stations
-34% workplaces
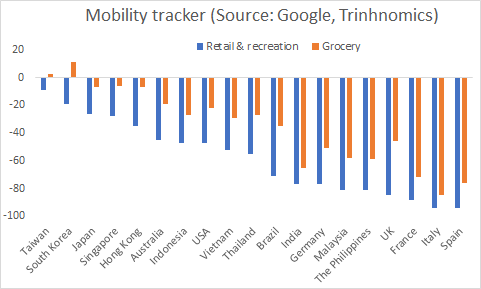
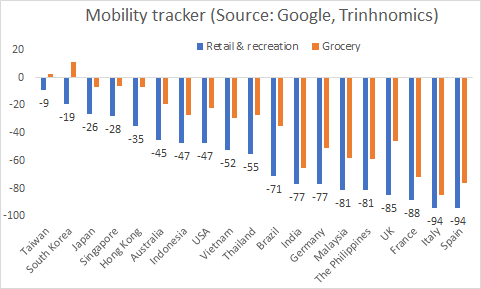
Are you ready??? Here we go, I inputted the data & compared across mobility different economies for end of March:
Best retail sales is of course Taiwan https://abs.twimg.com/emoji/v2/... draggable="false" alt="🇹🇼" title="Flag of Taiwan" aria-label="Emoji: Flag of Taiwan">& South Korea
  https://abs.twimg.com/emoji/v2/... draggable="false" alt="🇰🇷" title="Flag of South Korea" aria-label="Emoji: Flag of South Korea"> & Japan
  https://abs.twimg.com/emoji/v2/... draggable="false" alt="🇯🇵" title="Flag of Japan" aria-label="Emoji: Flag of Japan"> but note EVERYONE NEGATIVE
Worst for retail sales:: Spain, Italy, France, UK & the Philippines!
Best retail sales is of course Taiwan
Worst for retail sales:: Spain, Italy, France, UK & the Philippines!
Note that USA retail sales & recreation is skewed towards the better half of the economies I chose (Asian & Western Europe) but still negative! No one is positive, even wonderful Taiwan and South Korea!
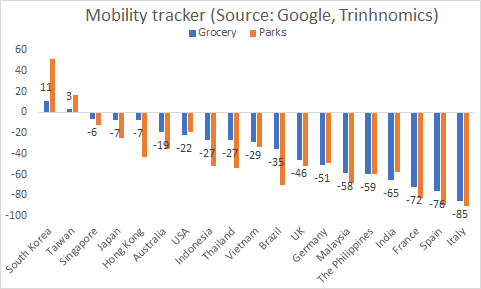
Parks & grocery mobility: Note something exceptional about Taiwan & South Korea, BOTH HAVE INCREASED!!!
So the Taiwanese & South Koreans are healthier!!! Meanwhile, mobility suppression severe in Italy, Spain, France, India and the Philippines for grocery!
Surprised about HK!
So the Taiwanese & South Koreans are healthier!!! Meanwhile, mobility suppression severe in Italy, Spain, France, India and the Philippines for grocery!
Surprised about HK!
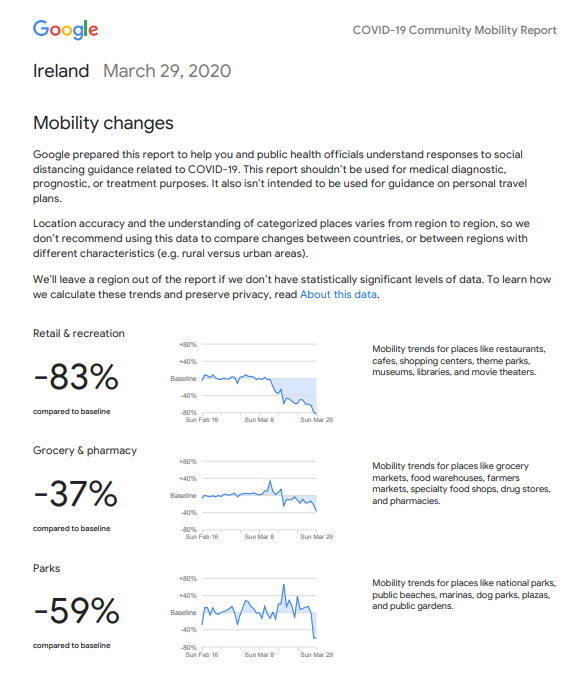
@fbermingham requested Ireland  https://abs.twimg.com/emoji/v2/... draggable="false" alt="🇮🇪" title="Flag of Ireland" aria-label="Emoji: Flag of Ireland"> so here we go!!!:
-83% retail & recreation
-37% grocery & pharma
-59% parks
-78% transit stations
-52% workplaces
Will add Ireland to the sample to compare too!
-83% retail & recreation
-37% grocery & pharma
-59% parks
-78% transit stations
-52% workplaces
Will add Ireland to the sample to compare too!
Okay, adding Ireland to the mix  https://abs.twimg.com/emoji/v2/... draggable="false" alt="🤗" title="Hugging face" aria-label="Emoji: Hugging face"> (any other request?):
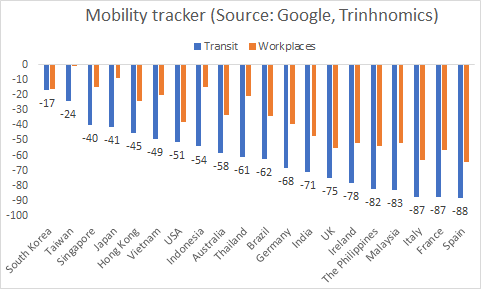
Let& #39;s look at transit centers, this is important b/c it impacts transportation & hospitality business & the new is BAD:
No one is up, even wonderful South Korea & Taiwan & down double digits!
Worst: Spain, France, Italy!
Let& #39;s look at transit centers, this is important b/c it impacts transportation & hospitality business & the new is BAD:
No one is up, even wonderful South Korea & Taiwan & down double digits!
Worst: Spain, France, Italy!
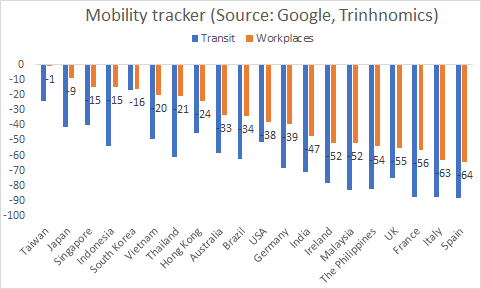
What about workplaces????
South Korea moved down in the mobility rankings & Taiwan remains top followed by Japan & Singapore.
Workplaces mobility less impacted than others for worst economies like Spain, Italy, France and the UK!
USA is middle of the pack!
South Korea moved down in the mobility rankings & Taiwan remains top followed by Japan & Singapore.
Workplaces mobility less impacted than others for worst economies like Spain, Italy, France and the UK!
USA is middle of the pack!
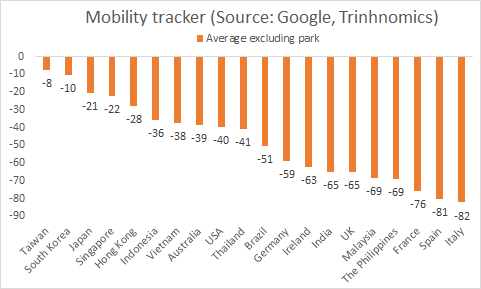
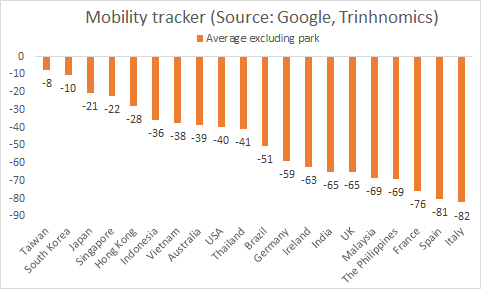
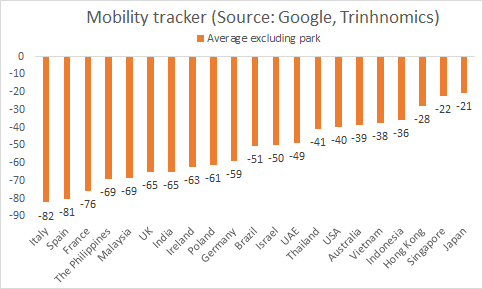
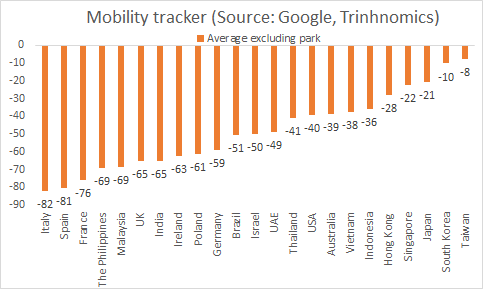
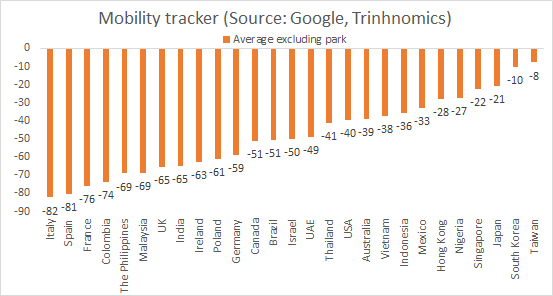
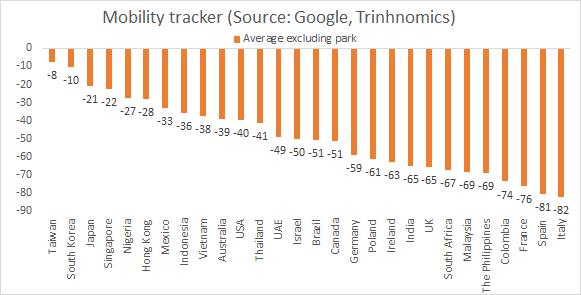
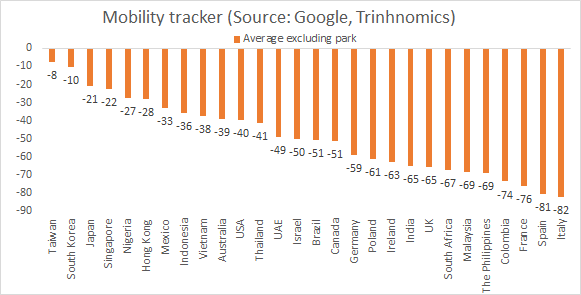
Are you ready??? I took an average of all the changes & I exclude parks and here are the rankings of BEST to WORST mobility change from base line (change in chart):
#1 Taiwan https://abs.twimg.com/emoji/v2/... draggable="false" alt="🇹🇼" title="Flag of Taiwan" aria-label="Emoji: Flag of Taiwan">
  https://abs.twimg.com/emoji/v2/... draggable="false" alt="👏🏻" title="Clapping hands sign (light skin tone)" aria-label="Emoji: Clapping hands sign (light skin tone)">
#2 South Korea https://abs.twimg.com/emoji/v2/... draggable="false" alt="🇰🇷" title="Flag of South Korea" aria-label="Emoji: Flag of South Korea">
#3 Japan https://abs.twimg.com/emoji/v2/... draggable="false" alt="🇯🇵" title="Flag of Japan" aria-label="Emoji: Flag of Japan">
#4 Singapore https://abs.twimg.com/emoji/v2/... draggable="false" alt="🇸🇬" title="Flag of Singapore" aria-label="Emoji: Flag of Singapore">
#5 Hong Kong https://abs.twimg.com/emoji/v2/... draggable="false" alt="🇭🇰" title="Flag of Hong Kong" aria-label="Emoji: Flag of Hong Kong">
Yay to the Asian tigers, esp TW! https://abs.twimg.com/emoji/v2/... draggable="false" alt="👏🏻" title="Clapping hands sign (light skin tone)" aria-label="Emoji: Clapping hands sign (light skin tone)">
#1 Taiwan
#2 South Korea
#3 Japan
#4 Singapore
#5 Hong Kong
Yay to the Asian tigers, esp TW!
The WORST change of mobility from the base line (excluding parks):
#1 Italy https://abs.twimg.com/emoji/v2/... draggable="false" alt="🇮🇹" title="Flag of Italy" aria-label="Emoji: Flag of Italy">
#2 Spain https://abs.twimg.com/emoji/v2/... draggable="false" alt="🇪🇸" title="Flag of Spain" aria-label="Emoji: Flag of Spain">
#3 France https://abs.twimg.com/emoji/v2/... draggable="false" alt="🇫🇷" title="Flag of France" aria-label="Emoji: Flag of France">
#4 The Philippines https://abs.twimg.com/emoji/v2/... draggable="false" alt="🇵🇭" title="Flag of Philippines" aria-label="Emoji: Flag of Philippines">
#5 Malaysia https://abs.twimg.com/emoji/v2/... draggable="false" alt="🇲🇾" title="Flag of Malaysia" aria-label="Emoji: Flag of Malaysia">
USA is pretty similar to Australia, pretty interesting https://abs.twimg.com/emoji/v2/... draggable="false" alt="🧐" title="Face with monocle" aria-label="Emoji: Face with monocle">
 https://abs.twimg.com/emoji/v2/... draggable="false" alt="🤓" title="Nerd face" aria-label="Emoji: Nerd face"> (no wonder I have a fondness for Australian, similar vibe of mobility policy).
#1 Italy
#2 Spain
#3 France
#4 The Philippines
#5 Malaysia
USA is pretty similar to Australia, pretty interesting
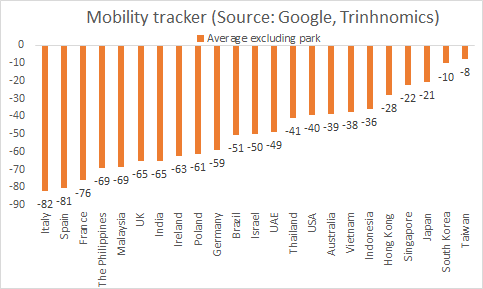
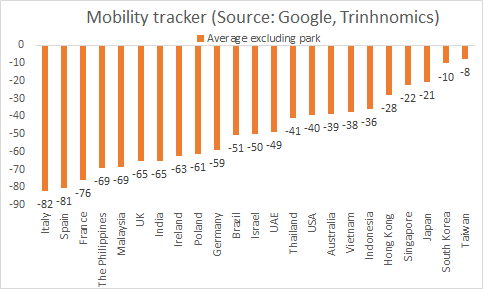
Okay, someone requested Israel & the UAE & here they are in the average ranking ex parks:
Average mobility falls -50% for Israel & -49% for UAE.
Added Poland too! -61% & similar to Germany.
Average mobility falls -50% for Israel & -49% for UAE.
Added Poland too! -61% & similar to Germany.
Bottom line:
Do what Taiwan did & very vigilant early on (started tracing & testing & shutting borders ASAP) to contain the spread of the virus & least disruptive to mobility & growth.
Alternative is hardcore suppression (Wuhan style) & very bad for mobility & growth (Italy).
Do what Taiwan did & very vigilant early on (started tracing & testing & shutting borders ASAP) to contain the spread of the virus & least disruptive to mobility & growth.
Alternative is hardcore suppression (Wuhan style) & very bad for mobility & growth (Italy).
Obvs since Taiwan & Asian economies that are vigilant like Vietnam, South Korea etc are the EXCEPTION, & NOT NORM (obvs thanks to the WHO misinformation in Jan & Feb 2020 too), we got rather SUPPRESSED mobility now as we have outbreaks. Western Europe is suppressing mobility most
Within the USA, New York got the most suppression of mobility. California is also doing it too to avoid an outbreak but hopefully CA will pivot towards the Taiwan model.
Taiwan & South Korean model is least disruptive to mobility & growth & so the US should try to get there.
Taiwan & South Korean model is least disruptive to mobility & growth & so the US should try to get there.
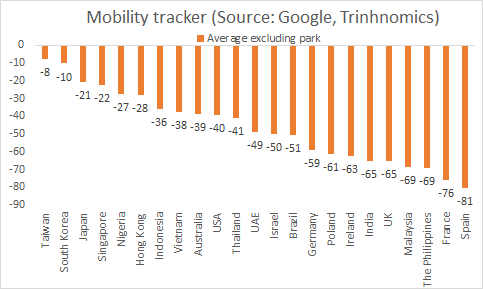
PS: Someone asked for Nigeria & it& #39;s not bad! Better than Hong Kong in terms of mobility decline. Obvs I don& #39;t know anything about Nigeria so can& #39;t conclude anything (a lot of coverage in the FT Weekend this week though for fashion & whatnot).
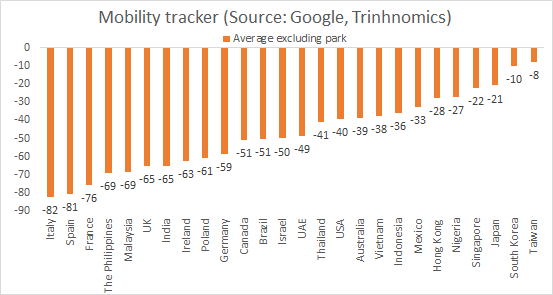
I got request for Canada & since I do Canada I thought I should add Mexico, our southern neighbor!!!
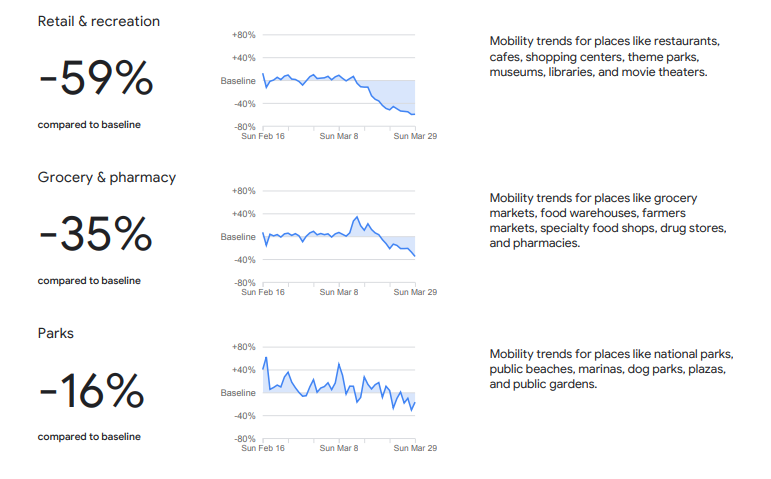
Canada is -51% & Mexico is -33% for total average. Details for Canada included https://abs.twimg.com/emoji/v2/... draggable="false" alt="👇🏻" title="Down pointing backhand index (light skin tone)" aria-label="Emoji: Down pointing backhand index (light skin tone)">
 https://abs.twimg.com/emoji/v2/... draggable="false" alt="👇🏻" title="Down pointing backhand index (light skin tone)" aria-label="Emoji: Down pointing backhand index (light skin tone)">
Canada is -51% & Mexico is -33% for total average. Details for Canada included
Here is Colombia! Mobility is among most restricted in the world at -74% total & retail sales mobility -86%
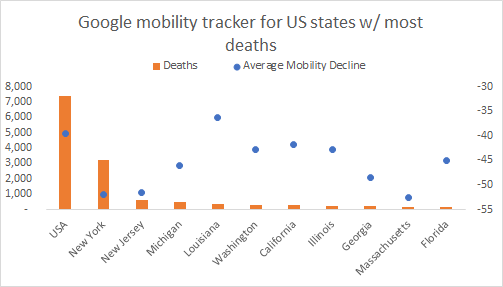
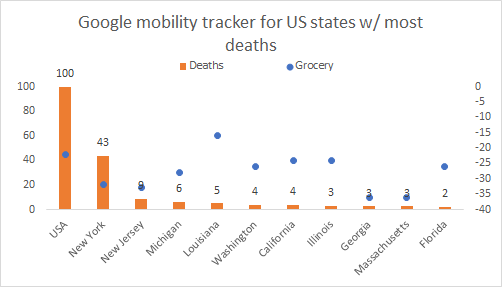
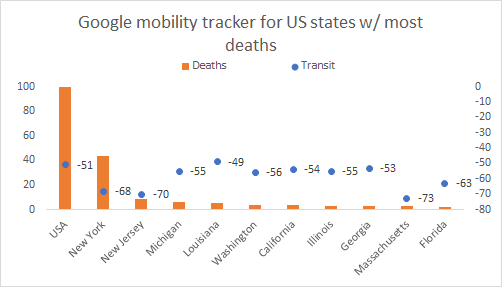
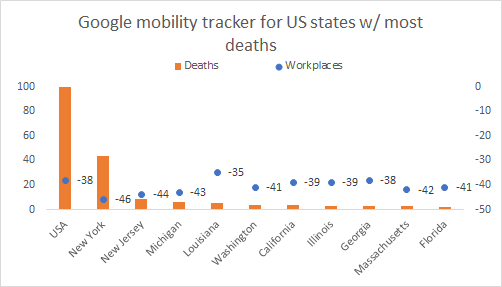
Okay, some of you asked about US data & details. Here is what I have done: I took the 10 states w/ the most deaths & then I showed the mobility decline in those states. The orange line shows the deaths & blue dot is the decline:
New York has 43% of deaths & mobility decline -52%
New York has 43% of deaths & mobility decline -52%
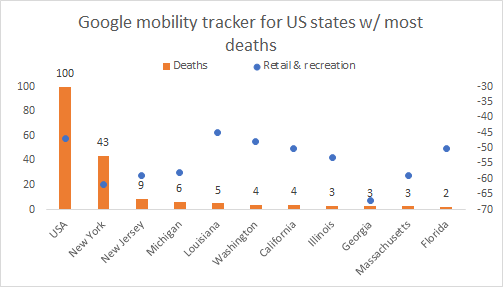
Retail & recreation mobility decline & share of total deaths. Very interesting, New York got 43% of USA deaths but mobility for retail & recreation is falling most for Georgia, which has 3% of deaths & 4% of confirmed.
You& #39;d think New York would drop more!
You& #39;d think New York would drop more!
Here is grocery mobility & deaths: again, New York is not the most! It& #39;s Massachusetts & Georgia!
Here is for transit, massive drop for Massachusetts. New York is dropping a lot but not the biggest!
It is in workplace that you see the most drop for NY but other states with fewer deaths are also dropping just as much.
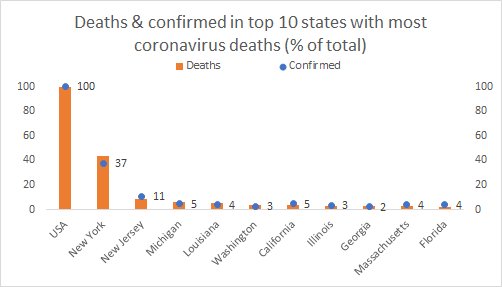
Finally, here is another way to look at the distribution of confirmed & deaths in the USA: Very clear that New York & New Jersey are where the outbreaks are.
But also clear that mobility decline is not the most there but actually Massachusetts!!! How about that?
But also clear that mobility decline is not the most there but actually Massachusetts!!! How about that?
Someone asked for South Africa: here it is -67% in average mobility & details are -79% for retail & recreation; -60 for grocery & pharma & -80% for transit stations & -49% workplaces
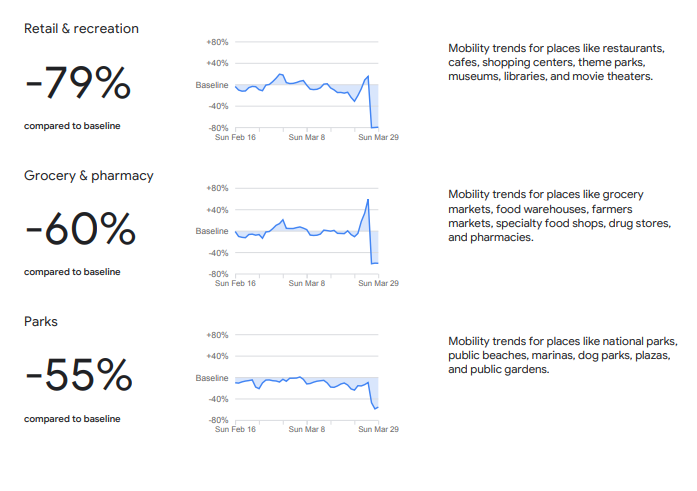
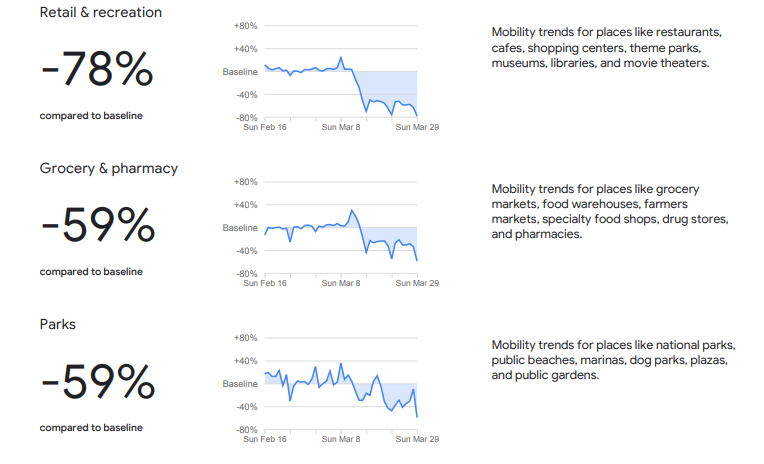
Here is Poland  https://abs.twimg.com/emoji/v2/... draggable="false" alt="🇵🇱" title="Flag of Poland" aria-label="Emoji: Flag of Poland"> per popular request:
-78% for retail sales & -59% for grocery; -59% for parks; -71% for transit; and -36% for workplace. And this is what it looks like taking an average ex parks: -61% & close to Germany& #39;s -59%
-78% for retail sales & -59% for grocery; -59% for parks; -71% for transit; and -36% for workplace. And this is what it looks like taking an average ex parks: -61% & close to Germany& #39;s -59%

 Read on Twitter
 : -47% for retail & recreation; -27% for grocery & pharmacy; -52% for parks; -54% for transit; -15% for workplace" title="Indonesia https://abs.twimg.com/emoji/v2/... draggable="false" alt="🇮🇩" title="Flag of Indonesia" aria-label="Emoji: Flag of Indonesia">: -47% for retail & recreation; -27% for grocery & pharmacy; -52% for parks; -54% for transit; -15% for workplace" class="img-responsive" style="max-width:100%;"/>
 : -81% for retail & recreation; -58% for grocery & pharma; -68% parks; -83% transit stations; -52% workplace" title="Malaysia https://abs.twimg.com/emoji/v2/... draggable="false" alt="🇲🇾" title="Flag of Malaysia" aria-label="Emoji: Flag of Malaysia">: -81% for retail & recreation; -58% for grocery & pharma; -68% parks; -83% transit stations; -52% workplace" class="img-responsive" style="max-width:100%;"/>
 : -55% retail & recreation; -27% grocery & pharma; -54% parks; -61% transit stations & -21 workplaces" title="Thailand https://abs.twimg.com/emoji/v2/... draggable="false" alt="🇹🇭" title="Flag of Thailand" aria-label="Emoji: Flag of Thailand">: -55% retail & recreation; -27% grocery & pharma; -54% parks; -61% transit stations & -21 workplaces" class="img-responsive" style="max-width:100%;"/>
 : -81% retail & recreation; -59% grocery & pharma & parks -59% & -82% transit and -54% workplaces" title="The Philippines https://abs.twimg.com/emoji/v2/... draggable="false" alt="🇵🇭" title="Flag of Philippines" aria-label="Emoji: Flag of Philippines">: -81% retail & recreation; -59% grocery & pharma & parks -59% & -82% transit and -54% workplaces" class="img-responsive" style="max-width:100%;"/>
 lock-down hasn& #39;t started yet till 1 April & data already: -52% retail sales & recreation; -29% grocery & pharma; -33% parks; -49% transit stations; -20% workplaces" title="Vietnam https://abs.twimg.com/emoji/v2/... draggable="false" alt="🇻🇳" title="Flag of Vietnam" aria-label="Emoji: Flag of Vietnam"> lock-down hasn& #39;t started yet till 1 April & data already: -52% retail sales & recreation; -29% grocery & pharma; -33% parks; -49% transit stations; -20% workplaces" class="img-responsive" style="max-width:100%;"/>
 : -35% for retail & recreation; -7% for grocery & pharma; -43% for parks; -45% for transit stations; -24% workplaces" title="Hong Kong https://abs.twimg.com/emoji/v2/... draggable="false" alt="🇭🇰" title="Flag of Hong Kong" aria-label="Emoji: Flag of Hong Kong">: -35% for retail & recreation; -7% for grocery & pharma; -43% for parks; -45% for transit stations; -24% workplaces" class="img-responsive" style="max-width:100%;"/>
 : -9% for retail & recreation; +3% for grocery; +17% for parks; -24% for transit station; -1% for workplaces.I think we have a winner of mobility so far! https://abs.twimg.com/emoji/v2/... draggable="false" alt="👏🏻" title="Clapping hands sign (light skin tone)" aria-label="Emoji: Clapping hands sign (light skin tone)">https://abs.twimg.com/emoji/v2/... draggable="false" alt="👏🏻" title="Clapping hands sign (light skin tone)" aria-label="Emoji: Clapping hands sign (light skin tone)">https://abs.twimg.com/emoji/v2/... draggable="false" alt="👏🏻" title="Clapping hands sign (light skin tone)" aria-label="Emoji: Clapping hands sign (light skin tone)">" title="Taiwan https://abs.twimg.com/emoji/v2/... draggable="false" alt="🇹🇼" title="Flag of Taiwan" aria-label="Emoji: Flag of Taiwan">: -9% for retail & recreation; +3% for grocery; +17% for parks; -24% for transit station; -1% for workplaces.I think we have a winner of mobility so far! https://abs.twimg.com/emoji/v2/... draggable="false" alt="👏🏻" title="Clapping hands sign (light skin tone)" aria-label="Emoji: Clapping hands sign (light skin tone)">https://abs.twimg.com/emoji/v2/... draggable="false" alt="👏🏻" title="Clapping hands sign (light skin tone)" aria-label="Emoji: Clapping hands sign (light skin tone)">https://abs.twimg.com/emoji/v2/... draggable="false" alt="👏🏻" title="Clapping hands sign (light skin tone)" aria-label="Emoji: Clapping hands sign (light skin tone)">" class="img-responsive" style="max-width:100%;"/>
 is like Taiwan but less good in terms of drop of retail sales but seems HEALTHY!-19% retail sales & recreation+11% grocery & pharma+51% parks!!!-17% transit stations-16% work placeYes, Taiwan is #1 in mobility by along shot & South Korea is #1 https://abs.twimg.com/emoji/v2/... draggable="false" alt="👏🏻" title="Clapping hands sign (light skin tone)" aria-label="Emoji: Clapping hands sign (light skin tone)">https://abs.twimg.com/emoji/v2/... draggable="false" alt="👏🏻" title="Clapping hands sign (light skin tone)" aria-label="Emoji: Clapping hands sign (light skin tone)">https://abs.twimg.com/emoji/v2/... draggable="false" alt="👏🏻" title="Clapping hands sign (light skin tone)" aria-label="Emoji: Clapping hands sign (light skin tone)">" title="Yes, South Korea https://abs.twimg.com/emoji/v2/... draggable="false" alt="🇰🇷" title="Flag of South Korea" aria-label="Emoji: Flag of South Korea"> is like Taiwan but less good in terms of drop of retail sales but seems HEALTHY!-19% retail sales & recreation+11% grocery & pharma+51% parks!!!-17% transit stations-16% work placeYes, Taiwan is #1 in mobility by along shot & South Korea is #1 https://abs.twimg.com/emoji/v2/... draggable="false" alt="👏🏻" title="Clapping hands sign (light skin tone)" aria-label="Emoji: Clapping hands sign (light skin tone)">https://abs.twimg.com/emoji/v2/... draggable="false" alt="👏🏻" title="Clapping hands sign (light skin tone)" aria-label="Emoji: Clapping hands sign (light skin tone)">https://abs.twimg.com/emoji/v2/... draggable="false" alt="👏🏻" title="Clapping hands sign (light skin tone)" aria-label="Emoji: Clapping hands sign (light skin tone)">" class="img-responsive" style="max-width:100%;"/>
 : -26% retail & recreation; -7% grocery & pharma; -25% parks; -41% transit stations; -9% workplaces" title="Japan https://abs.twimg.com/emoji/v2/... draggable="false" alt="🇯🇵" title="Flag of Japan" aria-label="Emoji: Flag of Japan">: -26% retail & recreation; -7% grocery & pharma; -25% parks; -41% transit stations; -9% workplaces" class="img-responsive" style="max-width:100%;"/>
 : -94% for retail & recreation; -85% for grocery & pharma; -90% parks; -87% transit; -63% workplace Basically very very limited mobility." title="Are you ready? This is the worst I& #39;ve seen so far & confirms the cliff diving of the PMI.Italy https://abs.twimg.com/emoji/v2/... draggable="false" alt="🇮🇹" title="Flag of Italy" aria-label="Emoji: Flag of Italy">: -94% for retail & recreation; -85% for grocery & pharma; -90% parks; -87% transit; -63% workplace Basically very very limited mobility." class="img-responsive" style="max-width:100%;"/>
 is bad too & looks just like Italy:-94% retail sales & recreation-76% grocery & pharma-89% parks-88% transit stations-64% work places" title="Spain https://abs.twimg.com/emoji/v2/... draggable="false" alt="🇪🇸" title="Flag of Spain" aria-label="Emoji: Flag of Spain"> is bad too & looks just like Italy:-94% retail sales & recreation-76% grocery & pharma-89% parks-88% transit stations-64% work places" class="img-responsive" style="max-width:100%;"/>
 :-88% retail sales & creation-72% grocery & pharma-82% parks-87% transportation-56% workplaces" title="France https://abs.twimg.com/emoji/v2/... draggable="false" alt="🇫🇷" title="Flag of France" aria-label="Emoji: Flag of France">:-88% retail sales & creation-72% grocery & pharma-82% parks-87% transportation-56% workplaces" class="img-responsive" style="max-width:100%;"/>
 :-77% retail & recreation-51% grocery & pharma-49% parks-68% transit-39% workplaces" title="Germany https://abs.twimg.com/emoji/v2/... draggable="false" alt="🇩🇪" title="Flag of Germany" aria-label="Emoji: Flag of Germany">:-77% retail & recreation-51% grocery & pharma-49% parks-68% transit-39% workplaces" class="img-responsive" style="max-width:100%;"/>
 -85% retail & recreation-46% grocery & pharma-52% parks-75% transit stations-55% workplaces" title="United Kingdom https://abs.twimg.com/emoji/v2/... draggable="false" alt="🇬🇧" title="Flag of United Kingdom" aria-label="Emoji: Flag of United Kingdom">-85% retail & recreation-46% grocery & pharma-52% parks-75% transit stations-55% workplaces" class="img-responsive" style="max-width:100%;"/>
 :-47% retail & recreation-22% grocery & pharma-19% parks-51% transit-38% workplaces" title="United States https://abs.twimg.com/emoji/v2/... draggable="false" alt="🇺🇸" title="Flag of United States" aria-label="Emoji: Flag of United States">:-47% retail & recreation-22% grocery & pharma-19% parks-51% transit-38% workplaces" class="img-responsive" style="max-width:100%;"/>
 -71% retail & recreation-35% grocery & pharma-70% parks-62% transit stations-34% workplaces" title="I have a few Brazilian followers so here& #39;s for you: Brazil https://abs.twimg.com/emoji/v2/... draggable="false" alt="🇧🇷" title="Flag of Brazil" aria-label="Emoji: Flag of Brazil">-71% retail & recreation-35% grocery & pharma-70% parks-62% transit stations-34% workplaces" class="img-responsive" style="max-width:100%;"/>
 & South Korea https://abs.twimg.com/emoji/v2/... draggable="false" alt="🇰🇷" title="Flag of South Korea" aria-label="Emoji: Flag of South Korea"> & Japan https://abs.twimg.com/emoji/v2/... draggable="false" alt="🇯🇵" title="Flag of Japan" aria-label="Emoji: Flag of Japan"> but note EVERYONE NEGATIVEWorst for retail sales:: Spain, Italy, France, UK & the Philippines!" title="Are you ready??? Here we go, I inputted the data & compared across mobility different economies for end of March:Best retail sales is of course Taiwan https://abs.twimg.com/emoji/v2/... draggable="false" alt="🇹🇼" title="Flag of Taiwan" aria-label="Emoji: Flag of Taiwan">& South Korea https://abs.twimg.com/emoji/v2/... draggable="false" alt="🇰🇷" title="Flag of South Korea" aria-label="Emoji: Flag of South Korea"> & Japan https://abs.twimg.com/emoji/v2/... draggable="false" alt="🇯🇵" title="Flag of Japan" aria-label="Emoji: Flag of Japan"> but note EVERYONE NEGATIVEWorst for retail sales:: Spain, Italy, France, UK & the Philippines!" class="img-responsive" style="max-width:100%;"/>
 so here we go!!!:-83% retail & recreation-37% grocery & pharma-59% parks-78% transit stations-52% workplacesWill add Ireland to the sample to compare too!" title=" @fbermingham requested Ireland https://abs.twimg.com/emoji/v2/... draggable="false" alt="🇮🇪" title="Flag of Ireland" aria-label="Emoji: Flag of Ireland"> so here we go!!!:-83% retail & recreation-37% grocery & pharma-59% parks-78% transit stations-52% workplacesWill add Ireland to the sample to compare too!" class="img-responsive" style="max-width:100%;"/>
 (any other request?):Let& #39;s look at transit centers, this is important b/c it impacts transportation & hospitality business & the new is BAD:No one is up, even wonderful South Korea & Taiwan & down double digits!Worst: Spain, France, Italy!" title="Okay, adding Ireland to the mix https://abs.twimg.com/emoji/v2/... draggable="false" alt="🤗" title="Hugging face" aria-label="Emoji: Hugging face"> (any other request?):Let& #39;s look at transit centers, this is important b/c it impacts transportation & hospitality business & the new is BAD:No one is up, even wonderful South Korea & Taiwan & down double digits!Worst: Spain, France, Italy!" class="img-responsive" style="max-width:100%;"/>
 https://abs.twimg.com/emoji/v2/... draggable="false" alt="👏🏻" title="Clapping hands sign (light skin tone)" aria-label="Emoji: Clapping hands sign (light skin tone)"> #2 South Korea https://abs.twimg.com/emoji/v2/... draggable="false" alt="🇰🇷" title="Flag of South Korea" aria-label="Emoji: Flag of South Korea"> #3 Japan https://abs.twimg.com/emoji/v2/... draggable="false" alt="🇯🇵" title="Flag of Japan" aria-label="Emoji: Flag of Japan"> #4 Singapore https://abs.twimg.com/emoji/v2/... draggable="false" alt="🇸🇬" title="Flag of Singapore" aria-label="Emoji: Flag of Singapore"> #5 Hong Kong https://abs.twimg.com/emoji/v2/... draggable="false" alt="🇭🇰" title="Flag of Hong Kong" aria-label="Emoji: Flag of Hong Kong">Yay to the Asian tigers, esp TW! https://abs.twimg.com/emoji/v2/... draggable="false" alt="👏🏻" title="Clapping hands sign (light skin tone)" aria-label="Emoji: Clapping hands sign (light skin tone)">" title="Are you ready??? I took an average of all the changes & I exclude parks and here are the rankings of BEST to WORST mobility change from base line (change in chart): #1 Taiwan https://abs.twimg.com/emoji/v2/... draggable="false" alt="🇹🇼" title="Flag of Taiwan" aria-label="Emoji: Flag of Taiwan"> https://abs.twimg.com/emoji/v2/... draggable="false" alt="👏🏻" title="Clapping hands sign (light skin tone)" aria-label="Emoji: Clapping hands sign (light skin tone)"> #2 South Korea https://abs.twimg.com/emoji/v2/... draggable="false" alt="🇰🇷" title="Flag of South Korea" aria-label="Emoji: Flag of South Korea"> #3 Japan https://abs.twimg.com/emoji/v2/... draggable="false" alt="🇯🇵" title="Flag of Japan" aria-label="Emoji: Flag of Japan"> #4 Singapore https://abs.twimg.com/emoji/v2/... draggable="false" alt="🇸🇬" title="Flag of Singapore" aria-label="Emoji: Flag of Singapore"> #5 Hong Kong https://abs.twimg.com/emoji/v2/... draggable="false" alt="🇭🇰" title="Flag of Hong Kong" aria-label="Emoji: Flag of Hong Kong">Yay to the Asian tigers, esp TW! https://abs.twimg.com/emoji/v2/... draggable="false" alt="👏🏻" title="Clapping hands sign (light skin tone)" aria-label="Emoji: Clapping hands sign (light skin tone)">" class="img-responsive" style="max-width:100%;"/>
 #2 Spain https://abs.twimg.com/emoji/v2/... draggable="false" alt="🇪🇸" title="Flag of Spain" aria-label="Emoji: Flag of Spain"> #3 France https://abs.twimg.com/emoji/v2/... draggable="false" alt="🇫🇷" title="Flag of France" aria-label="Emoji: Flag of France"> #4 The Philippines https://abs.twimg.com/emoji/v2/... draggable="false" alt="🇵🇭" title="Flag of Philippines" aria-label="Emoji: Flag of Philippines"> #5 Malaysia https://abs.twimg.com/emoji/v2/... draggable="false" alt="🇲🇾" title="Flag of Malaysia" aria-label="Emoji: Flag of Malaysia">USA is pretty similar to Australia, pretty interestinghttps://abs.twimg.com/emoji/v2/... draggable="false" alt="🧐" title="Face with monocle" aria-label="Emoji: Face with monocle">https://abs.twimg.com/emoji/v2/... draggable="false" alt="🤓" title="Nerd face" aria-label="Emoji: Nerd face"> (no wonder I have a fondness for Australian, similar vibe of mobility policy)." title="The WORST change of mobility from the base line (excluding parks): #1 Italy https://abs.twimg.com/emoji/v2/... draggable="false" alt="🇮🇹" title="Flag of Italy" aria-label="Emoji: Flag of Italy"> #2 Spain https://abs.twimg.com/emoji/v2/... draggable="false" alt="🇪🇸" title="Flag of Spain" aria-label="Emoji: Flag of Spain"> #3 France https://abs.twimg.com/emoji/v2/... draggable="false" alt="🇫🇷" title="Flag of France" aria-label="Emoji: Flag of France"> #4 The Philippines https://abs.twimg.com/emoji/v2/... draggable="false" alt="🇵🇭" title="Flag of Philippines" aria-label="Emoji: Flag of Philippines"> #5 Malaysia https://abs.twimg.com/emoji/v2/... draggable="false" alt="🇲🇾" title="Flag of Malaysia" aria-label="Emoji: Flag of Malaysia">USA is pretty similar to Australia, pretty interestinghttps://abs.twimg.com/emoji/v2/... draggable="false" alt="🧐" title="Face with monocle" aria-label="Emoji: Face with monocle">https://abs.twimg.com/emoji/v2/... draggable="false" alt="🤓" title="Nerd face" aria-label="Emoji: Nerd face"> (no wonder I have a fondness for Australian, similar vibe of mobility policy)." class="img-responsive" style="max-width:100%;"/>
 https://abs.twimg.com/emoji/v2/... draggable="false" alt="👇🏻" title="Down pointing backhand index (light skin tone)" aria-label="Emoji: Down pointing backhand index (light skin tone)">" title="I got request for Canada & since I do Canada I thought I should add Mexico, our southern neighbor!!!Canada is -51% & Mexico is -33% for total average. Details for Canada included https://abs.twimg.com/emoji/v2/... draggable="false" alt="👇🏻" title="Down pointing backhand index (light skin tone)" aria-label="Emoji: Down pointing backhand index (light skin tone)">https://abs.twimg.com/emoji/v2/... draggable="false" alt="👇🏻" title="Down pointing backhand index (light skin tone)" aria-label="Emoji: Down pointing backhand index (light skin tone)">">
 https://abs.twimg.com/emoji/v2/... draggable="false" alt="👇🏻" title="Down pointing backhand index (light skin tone)" aria-label="Emoji: Down pointing backhand index (light skin tone)">" title="I got request for Canada & since I do Canada I thought I should add Mexico, our southern neighbor!!!Canada is -51% & Mexico is -33% for total average. Details for Canada included https://abs.twimg.com/emoji/v2/... draggable="false" alt="👇🏻" title="Down pointing backhand index (light skin tone)" aria-label="Emoji: Down pointing backhand index (light skin tone)">https://abs.twimg.com/emoji/v2/... draggable="false" alt="👇🏻" title="Down pointing backhand index (light skin tone)" aria-label="Emoji: Down pointing backhand index (light skin tone)">">
 per popular request:-78% for retail sales & -59% for grocery; -59% for parks; -71% for transit; and -36% for workplace. And this is what it looks like taking an average ex parks: -61% & close to Germany& #39;s -59%" title="Here is Poland https://abs.twimg.com/emoji/v2/... draggable="false" alt="🇵🇱" title="Flag of Poland" aria-label="Emoji: Flag of Poland"> per popular request:-78% for retail sales & -59% for grocery; -59% for parks; -71% for transit; and -36% for workplace. And this is what it looks like taking an average ex parks: -61% & close to Germany& #39;s -59%">
 per popular request:-78% for retail sales & -59% for grocery; -59% for parks; -71% for transit; and -36% for workplace. And this is what it looks like taking an average ex parks: -61% & close to Germany& #39;s -59%" title="Here is Poland https://abs.twimg.com/emoji/v2/... draggable="false" alt="🇵🇱" title="Flag of Poland" aria-label="Emoji: Flag of Poland"> per popular request:-78% for retail sales & -59% for grocery; -59% for parks; -71% for transit; and -36% for workplace. And this is what it looks like taking an average ex parks: -61% & close to Germany& #39;s -59%">


