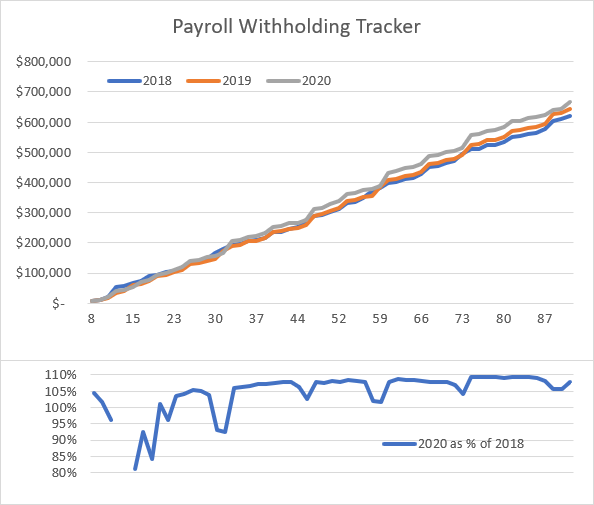
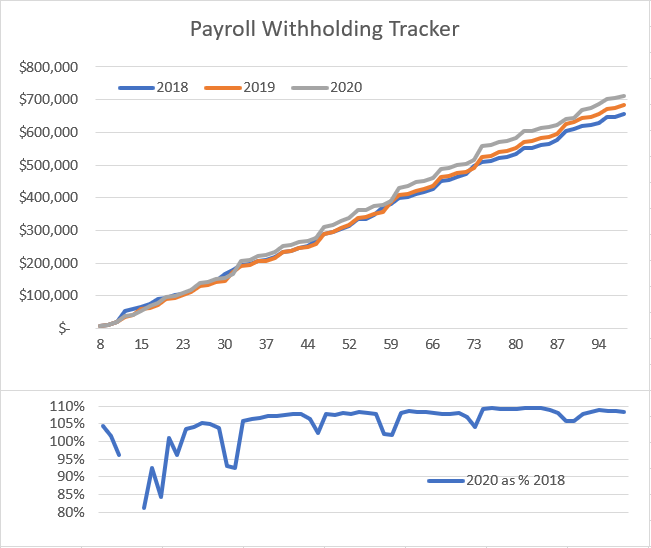
You know what is weird? that the layoffs and shelter-in-place stuff is not showing up in wage and salary withholding yet. The 2019 gov shutdown only took ~5 days to be visible. I guess there could be some offset from lay-off severance payments but this is starting to get v weird.
You know what continues to be really weird: deposits to the treasury for income and employment taxes withheld are not showing the decline in employment at all. That means essentially no cuts in large payrolls (i& #39;ll elaborate in further posts)
OK so there is 3 major deposit schedules for payroll withholding and 2 special patterns.
The first major pattern in small businesses that withhold less than $50k/yr. There& #39;s no clean way to reconcile that to wages paid without W4s but a good range is $180-270k Gross Earnings
The first major pattern in small businesses that withhold less than $50k/yr. There& #39;s no clean way to reconcile that to wages paid without W4s but a good range is $180-270k Gross Earnings
The more each employee earns the lower the total payroll will be before 50k is breached. For a median wage of $58k/yr that would be 4.5 people on the payroll.Pretty small businesses. These businesses pay on a monthly schedule, taxes are due on the 15th of month following payroll
the second major pattern is semiweekly payers. This is why withholding deposits are higher on Wednesdays and Fridays. Any firm with more than $50k/yr but less than ~$2.5mm/yr in withholding pays semiweekly. Payments are EFT so they& #39;re sent a day before they print
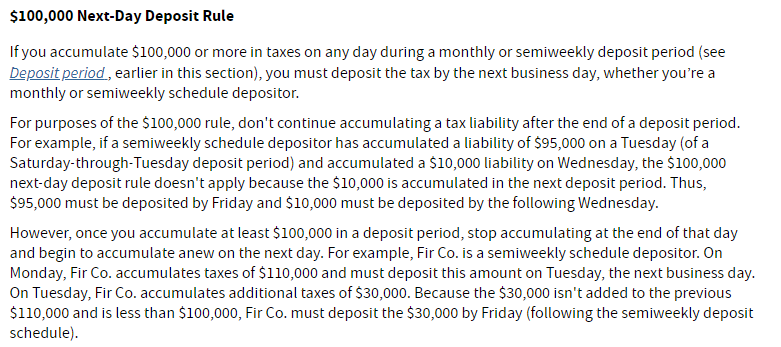
The last pattern is for really large employers, anyone withholding more than 100k in a pay period. They have to pay that money next-day, which means they key-in the EFT to the government the same day they do payroll and it prints the next day on the Treasury data.
The large filers are why monday is a big deposit day, payroll is done on friday and they have to deposit the taxes owed by monday. This means that we have a 2-day lag for largest employers (1 for EFT and 1 bc DTS is T+1), at most 5 day lag for mid-size employer and ~1m for small
On top of that there is two key patterns: the federal biweekly payroll schedule which is so big it is by far the most visible and then the private sector patterns which are mostly staggered biweekly but there& #39;s also a noticeable semimonthly pattern that shows on 15/16 and 31/1
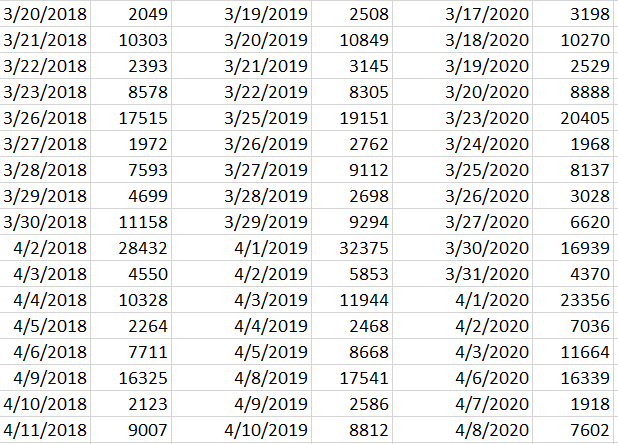
LTR here is 2018, 2019, 2020 aligned for the weekday pattern (the most prominent one, and the best to use when making daily or weekly comps). There is really not a big decline at all in any of the key patterns for large or medium employers, esp not if you consider easter& #39;s timing
So next wednesday we will get the last of the indicators because that& #39;s when the smallest business payments will be due. (unfortunate timing coinciding with the regular wednesday pattern but oh well) and we will know exactly how bad march was for any period paid on or before 3/31
So what we are likely to find out given the very very slight weakness in the daily and semiweekly data is that the employment losses were almost entirely in very small businesses and in positions of lower remuneration.
If that is true then that tells us something really important: that the stimulus can absolutely be very very accurately targeted by paying much much larger stimulus payments up front (target 15k/household) that are taxed very steeply when tax year 2020 income tax returns are due
When the data all makes its way out we are 100% going to find out that the march and april declines in personal wage and salary income were (in a macroeconomic scale) very very slight but that the people who lost their income were the lowest earners and most marginally attached
That also means the people least likely to have savings, least likely to own property, most likely to have very high MPC and most likely to have a very high portion of fixed expenses (rent, transportation, utilities). which means best bailout for landlords is checks to renters

 Read on Twitter


