Read this information:
(Hypothetical case)
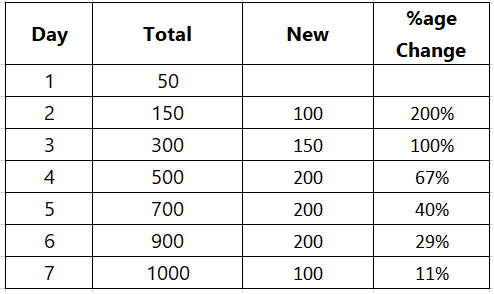
A country has 50 infected people on day 1
150 on day 2
300 on day 3
500 on day 4
700 on day 5
900 on day 6
1000 on day 7
It is apparent that that the numbers are increasing every day.
(Hypothetical case)
A country has 50 infected people on day 1
150 on day 2
300 on day 3
500 on day 4
700 on day 5
900 on day 6
1000 on day 7
It is apparent that that the numbers are increasing every day.
Now see the same information:
Absolute numbers are fine to assess the broad trend. While the absolute numbers are increasing, the rate of change indicates that the speed of the increase is slowing down.
Absolute numbers are fine to assess the broad trend. While the absolute numbers are increasing, the rate of change indicates that the speed of the increase is slowing down.
In technical analysis, Rate of Change (ROC) is a popular indicator. It shows us the rate of change in the price of an instrument. It is an important component of many indicators and also used in cycle analysis.
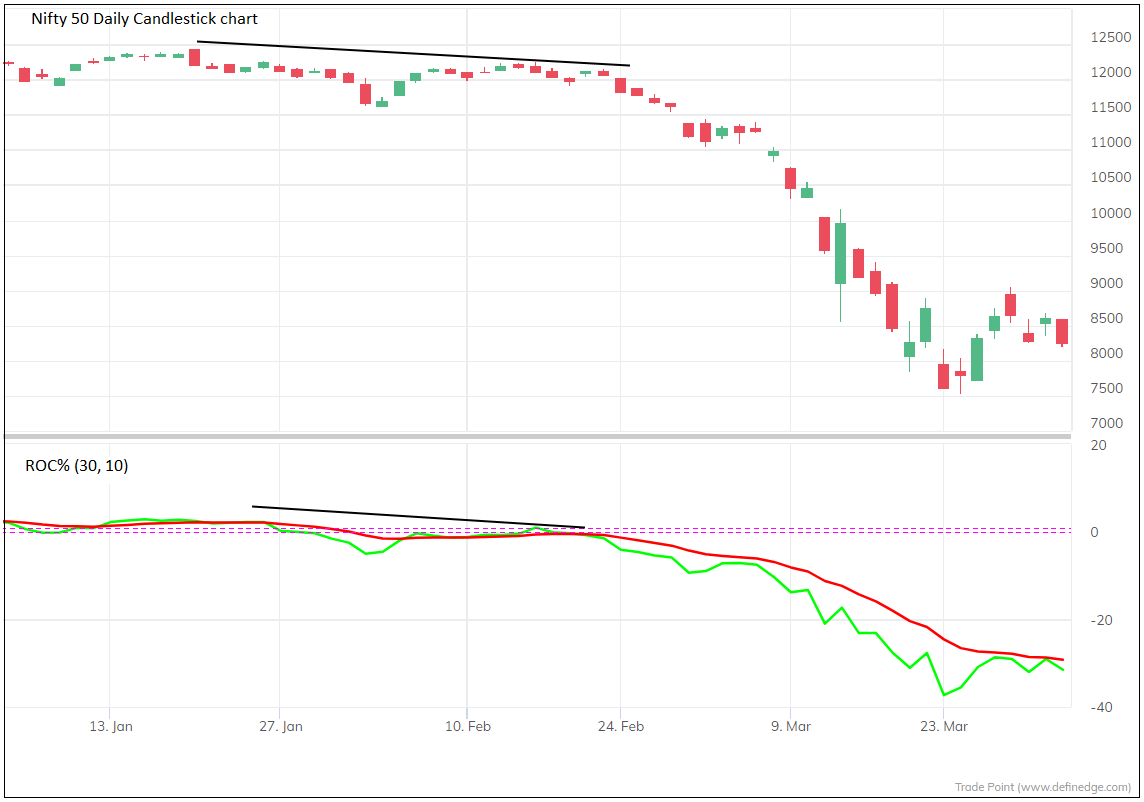
ROC below 0 indicates that the price is falling. If it is above zero, price is rising. A rising indicator is also a sign that the rate of change or the speed is increasing. In simple terms, there is a strong trend. Similarly, a falling ROC suggest falling price at a faster pace.
Now think: When an athlete or a train is running at top speed and wants to stop, ask yourself what is the first thing that is required for this to happen? Reduce the speed, right?
(Image from google)
(Image from google)
If price is rising but ROC is falling, it tells you that price is rising but at a relatively slower pace. Same way, in strong downtrend, a rising ROC tells you that price is falling but at a lower speed.
Whether this slowdown in the speed (captured by the ROC) will halt the trend temporarily or trigger a trend reversal is a totally different subject.
There are many indicators based on ROC but I will discuss three-indicators just for reference.
There are many indicators based on ROC but I will discuss three-indicators just for reference.
When we plot ROC, 10 period parameter is for short-term, 20-period for medium-term and 30-period for long-term.
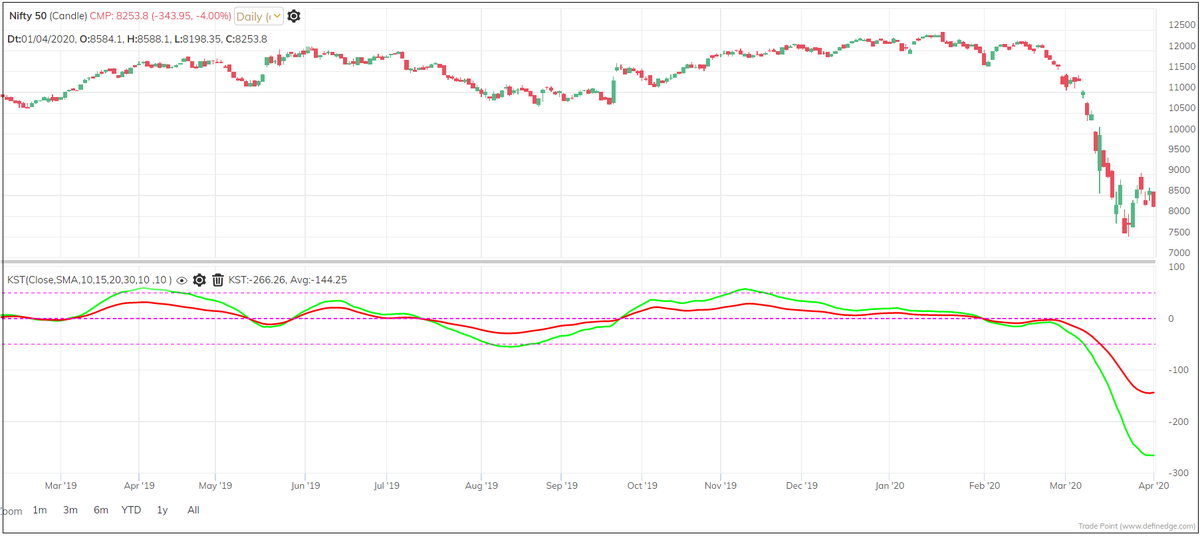
Martin Pring calculated KST (Know Sure Thing) indicator based on ROC. It is simply a weighted average of four different rate-of-change values that have been smoothed.
Martin Pring calculated KST (Know Sure Thing) indicator based on ROC. It is simply a weighted average of four different rate-of-change values that have been smoothed.
He calculated the 10, 15, 20 period ROC and smoothed them by 10-period average. Also, a 30-period ROC was calculated and smoothed by a 15-period average. Most weightage is given to 30-day ROC (long-term) and least to 10-day ROC.
The total of all these smoothed weighted ROCs is KST Indicator. A rising KST shows bullish trend, falling KST shows bearish trend.
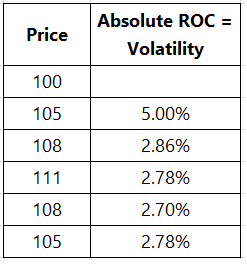
Now think about this: the ROC indicator captures the trend or direction while the absolute ROC captures volatility. Have a look at below images.
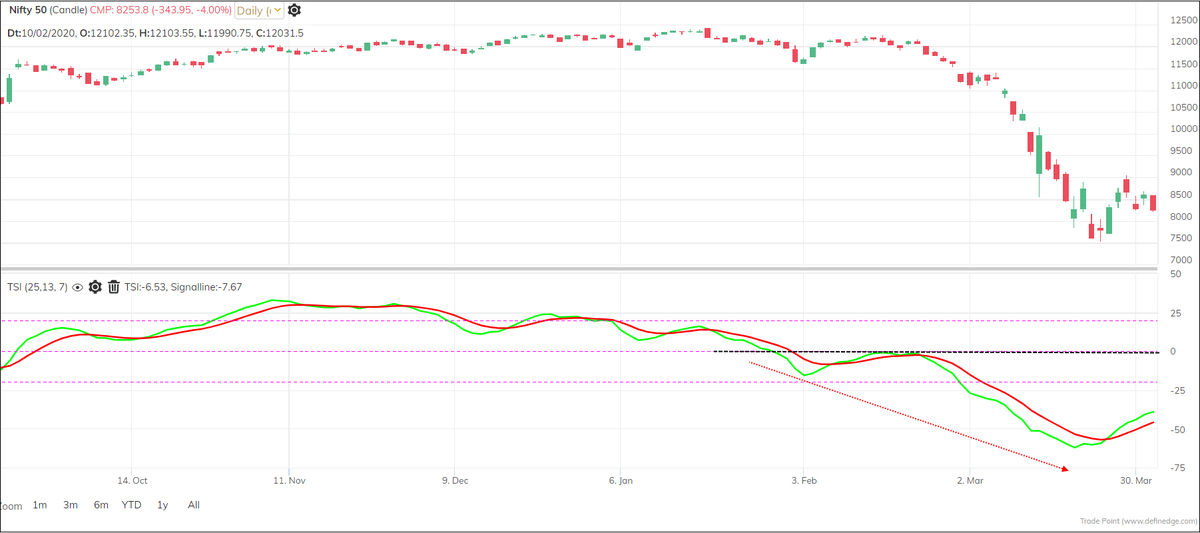
William Blau calculated daily ROC and smoothed it twice by calculating average of daily ROC and average of averaged ROC. He did same for Absolute ROC, to smooth the volatility. The smoothed trend divided by volatility is what he called True Strength Index (TSI).
Default parameters for smoothing are 25 and 13. The TSI oscillates between +100 and -100. Rising TSI above zero denotes strong positive trend and a falling TSI below zero shows strong negative trend.
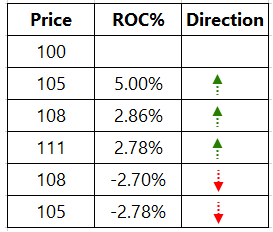
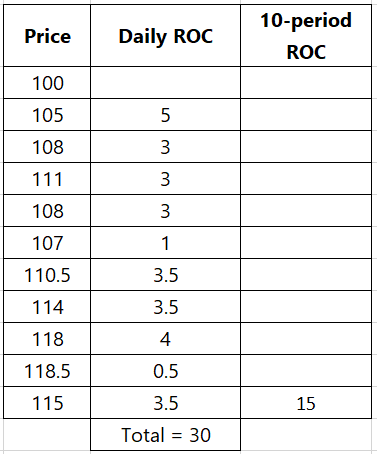
Have a look at the table. Price went up by 15 points during last 10 sessions. So ROC = +15 (Trend or direction). Price fluctuated daily during last 10 sessions and If I add all the daily ROCs of last 10 sessions it is volatility. In this case, it is 30 points.
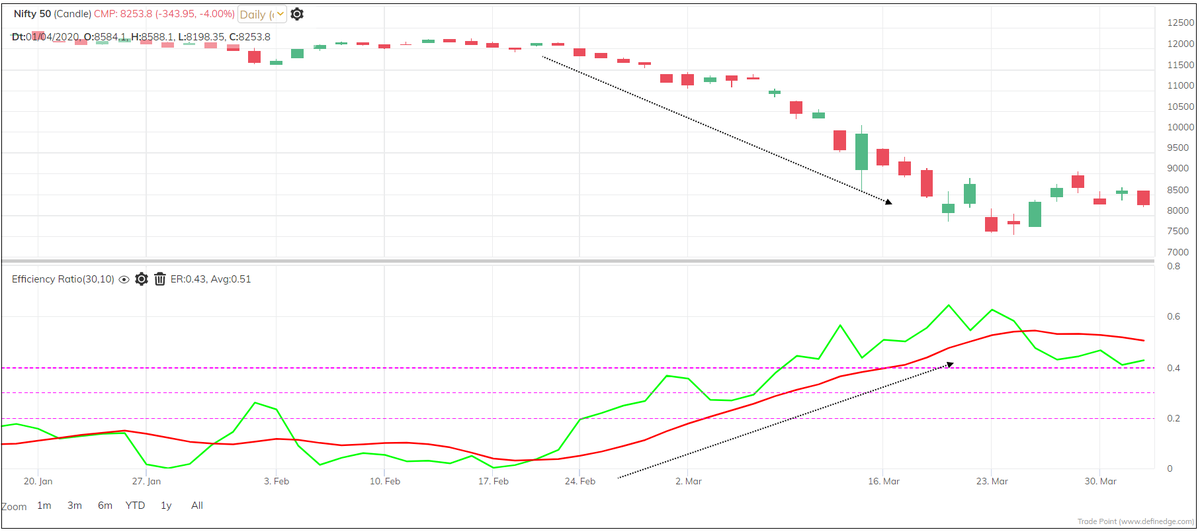
What if if divide trend by volatility? Perry Kaufman called this as Efficiency Ratio (ER).
ER = Direction / Volatility
Efficiency ratio can be a useful indicator. When ER is rising, trend in place is strong. Any other indicator can be used for identifying trend.
ER = Direction / Volatility
Efficiency ratio can be a useful indicator. When ER is rising, trend in place is strong. Any other indicator can be used for identifying trend.
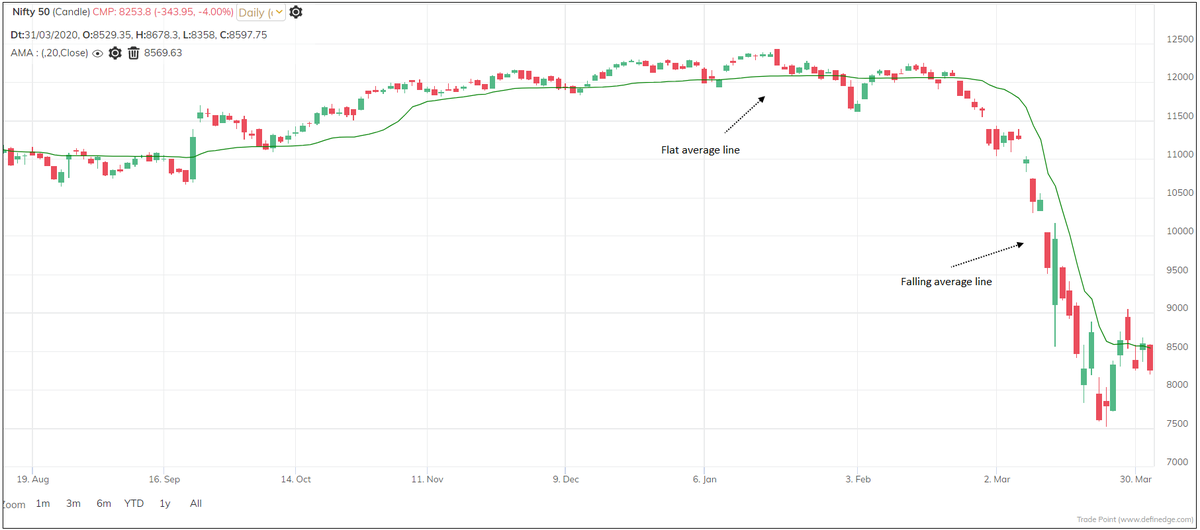
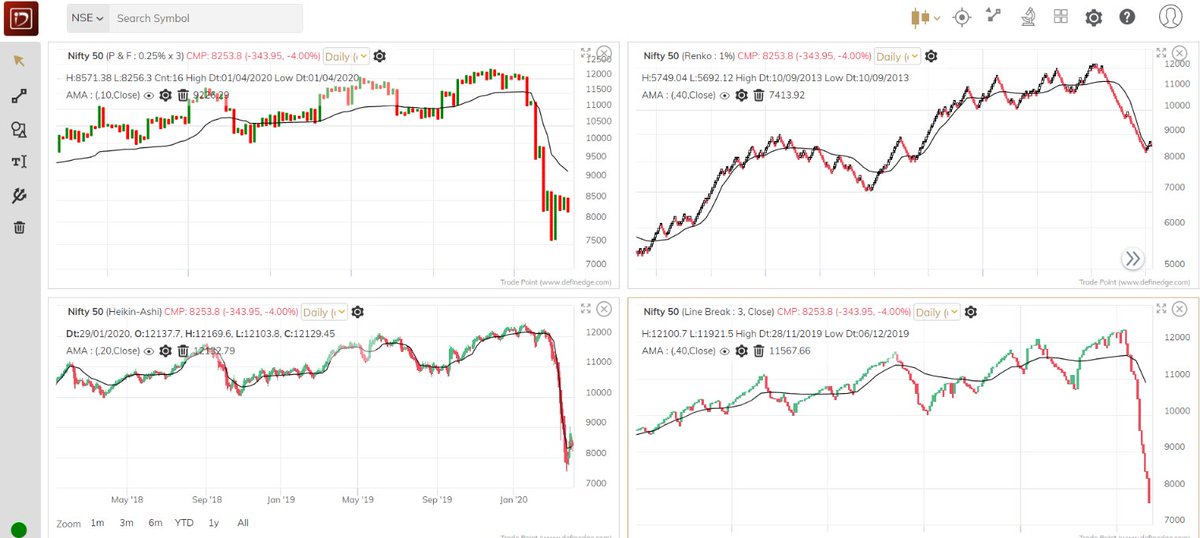
Kaufman also used this in the calculation of Adaptive Moving Average (AMA). The slope of AMA is based on Efficiency Ratio or ER. The AMA moves slowly when prices are in sideways mode and moves swiftly when price in a strong trend. AMA captures the direction and volatility.
These concepts becomes very interesting in Noiseless charts. In noiseless charts, they capture the rate of change of a swing move. The formula for all these indicators remain the same but the logic is a bit different.
The purpose of this thread is to explain the ROC concept and explain how it is used in different indicators. Understanding the logic behind the calculation of indicators can help you build conviction in using them.
It also helps you know if the indicator would be relevant for your trading style. How it would behave in different situations. This is most important for the consistency in trading.
End of Thread.
End of Thread.

 Read on Twitter
