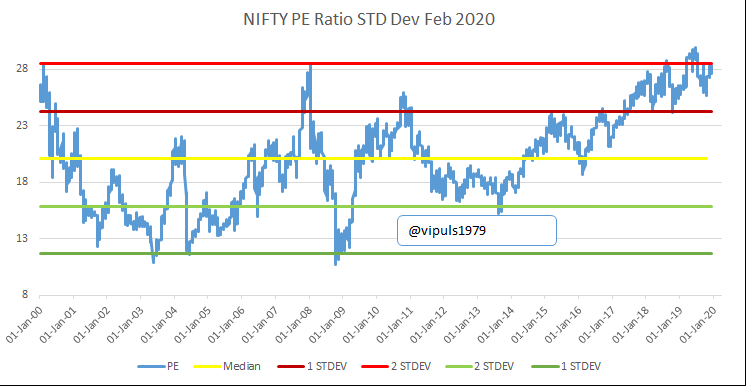
Thread on PE and Valuations of NIFTY 50 PE.
I have made it easy for beginner to understand
P/E ratio simply means how much money you are paying to generate 1% returns.
For Example: If a share is quoting at P/E 25, it means you are paying Rs 25 to earn 1 from that company.
(1/n)
I have made it easy for beginner to understand
P/E ratio simply means how much money you are paying to generate 1% returns.
For Example: If a share is quoting at P/E 25, it means you are paying Rs 25 to earn 1 from that company.
(1/n)
You must have heard abt “Over Valued”, ‘Expensive” and “Under Valued”, what is the rationale behind the above statement.
Let us explore
Imagine u purchased RBI Bond with an interest of 7.75%.
It means you pay 100 & u get ₹ 7.75 as interest credited in your bank account (2/n)
Let us explore
Imagine u purchased RBI Bond with an interest of 7.75%.
It means you pay 100 & u get ₹ 7.75 as interest credited in your bank account (2/n)
Price to Earning: Market Value / Earnings Per Share
In our GOI bond’s case: Market Value is ₹ 100 and Earning is ₹ 7.75
P/E ratio = 100 / 7.75 = 12.90
12.90 is the benchmark to compare whether markets are overvalued or undervalued.
(3/n)
In our GOI bond’s case: Market Value is ₹ 100 and Earning is ₹ 7.75
P/E ratio = 100 / 7.75 = 12.90
12.90 is the benchmark to compare whether markets are overvalued or undervalued.
(3/n)
How do we determine fair value of markets?
When invested in markets, taking risk of uncertainty, I shall get more than RBI Bonds returns a.k.a risk free returns.
Equity Returns [ 100/ Market P/E ] >Risk free return
By re-arranging the above. Market P/E < [100/RISK Free]
(4/n)
When invested in markets, taking risk of uncertainty, I shall get more than RBI Bonds returns a.k.a risk free returns.
Equity Returns [ 100/ Market P/E ] >Risk free return
By re-arranging the above. Market P/E < [100/RISK Free]
(4/n)
Gains from equity investments are in two forms; dividends and capital appreciation. Dividends are usually sticky as well as restricted to the amount that it does not impact companies earning capabilities. So if v want 2 remove impact of dividends which we will receive YoY (5/n)
Market P/E < [ 100/ (Risk Free Returns – Dividend Yield) ]
The above calculation is for Current/Historic PE ratio, I am of the opinion that while investing today v s& #39;d incorporate expected earnings growth.
Market P/E<[ 100/ (Risk Free–Dividend Yield)]x(1+earnings growth)
(6/n)
The above calculation is for Current/Historic PE ratio, I am of the opinion that while investing today v s& #39;d incorporate expected earnings growth.
Market P/E<[ 100/ (Risk Free–Dividend Yield)]x(1+earnings growth)
(6/n)
Fair Market P/E = (100/ (7.75-1.25)) X (1+12%)
Fair Market Valuation = 17.23
In the above equation, Risk Free Interest rate is considered as 7.75% RBI Bonds, dividend yield as 1.25 and expected growth from equities at 12%
If market P/E is > fair market valuation, (7/n)
Fair Market Valuation = 17.23
In the above equation, Risk Free Interest rate is considered as 7.75% RBI Bonds, dividend yield as 1.25 and expected growth from equities at 12%
If market P/E is > fair market valuation, (7/n)
it is advisable to have a larger portion to debt and when it falls above the range of 1 Standard Deviation or at fair market PE, advisable to invest more in equities
Below image depicts the PE 1 & 2 Standard Deviation from Fair Price calculated as on 28th Feb 2020
(8/n)
Below image depicts the PE 1 & 2 Standard Deviation from Fair Price calculated as on 28th Feb 2020
(8/n)
If u closely observe the chart, you will see whenever markets crossed 2 STDEV, it fell sharply.
Increase your allocation to equities when NIFTY 50 PE ratio is below fair PE (Yellow Line) & its a screaming buy when it is 2 STDEV below the fair price like in 2008-2009
(9/n)
Increase your allocation to equities when NIFTY 50 PE ratio is below fair PE (Yellow Line) & its a screaming buy when it is 2 STDEV below the fair price like in 2008-2009
(9/n)
Today NIFTY 50 PE is at 18.40 which is in reasonable valuation if compared to RBI Bonds
Have any questions happy to address those.............
Have any questions happy to address those.............

 Read on Twitter


