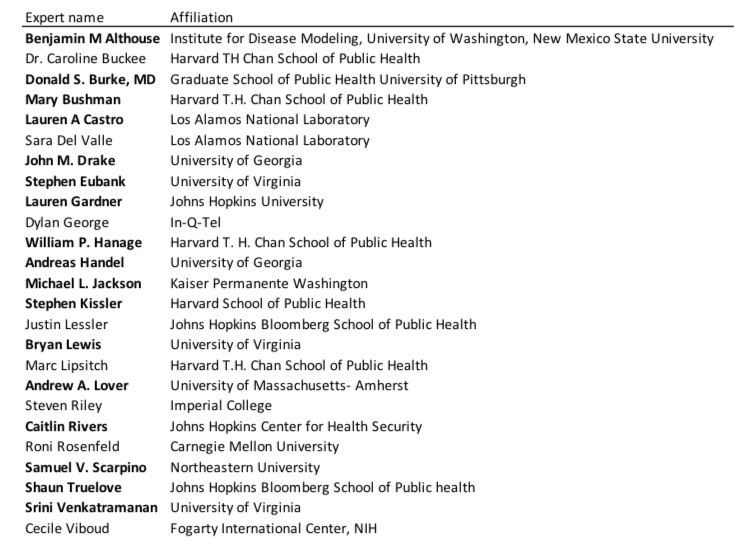
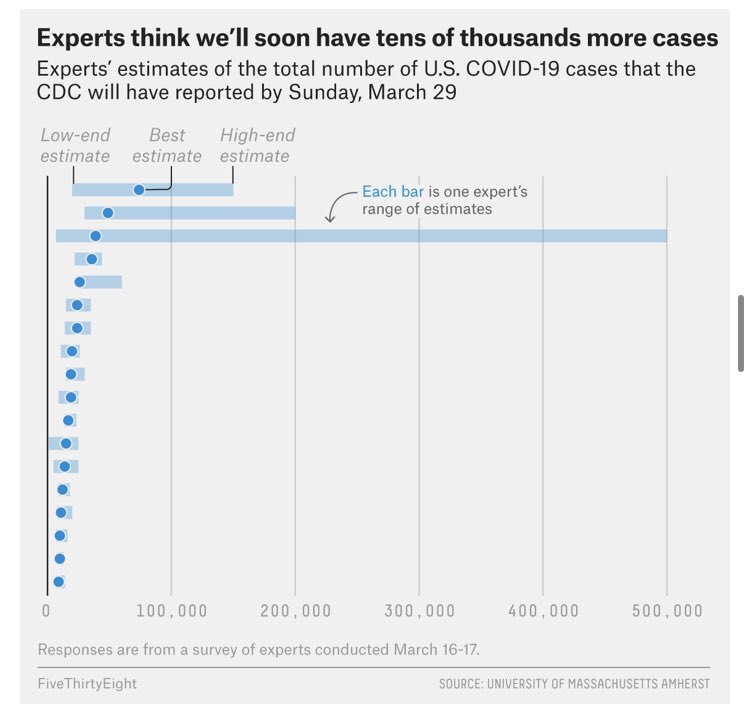
According to the survey, these experts “have spent a substantial amount of time in their professional career designing, building, and/or interpreting models to explain and understand infectious disease dynamics and/or the associated policy implications in human populations” https://twitter.com/robertwiblin/status/1244975394668806151">https://twitter.com/robertwib...
And these people didn’t forecast basic exponential growth? I notice I am confused. Plausible explanations:
1. This is an unrepresentative sample (n = 18 seems small).
2. They thought the US would do a better job with containment (who actually thought this by 03/16?).
1. This is an unrepresentative sample (n = 18 seems small).
2. They thought the US would do a better job with containment (who actually thought this by 03/16?).
3. They thought the CDC’s numbers would underestimate total cases more than they do.
4. fivethirtyeight mislabeled the graph: https://twitter.com/robertwiblin/status/1244991861174960130">https://twitter.com/robertwib...
4. fivethirtyeight mislabeled the graph: https://twitter.com/robertwiblin/status/1244991861174960130">https://twitter.com/robertwib...
A few notes:
- the survey was administered on March 16th-17th
- the comparison is the CDC’s tally of confirmed and presumptive COVID/19 cases (which might actually be an underestimate)
- there were 18 experts surveyed:
- the survey was administered on March 16th-17th
- the comparison is the CDC’s tally of confirmed and presumptive COVID/19 cases (which might actually be an underestimate)
- there were 18 experts surveyed:
Update: fivethirtyeight seems to have messed (at least some of) this up. The paper they reference ( https://works.bepress.com/mcandrew/2/download/)">https://works.bepress.com/mcandrew/... asks experts about COVID Tracker’s count ( https://covidtracking.com"> https://covidtracking.com ), whereas fivethirtyeight references the CDC’s count. @wiederkehra @jayboice any comment?
Also, fivethirtyeight references the fifth survey (from March 16-17). Clearly they’ve got access to more data, but I could only find the summary ( https://works.bepress.com/mcandrew/2/download/)">https://works.bepress.com/mcandrew/... which offers forecasts for the 23rd, not the 29th, as @robertwiblin noticed.
The sixth survey, administered March 23-24, offers forecasts for the 29th in its summary ( https://works.bepress.com/mcandrew/3/download/).">https://works.bepress.com/mcandrew/... And these forecasts are actually pretty accurate (80% CI of 66200-199500 cases).
Again, it looks like fivethirtyeight has data from the survey which *isn’t* included in the summary. But if their chart is correct, the implication is that these experts are mostly accurate a week out, but startlingly inaccurate two weeks out.
Which doesn’t make sense, because exponential curves work just as well two weeks out as they do one week out, you just have a wider confidence interval.
@wiederkehra @jayboice Where did you get the data for this article? https://fivethirtyeight.com/features/infectious-disease-experts-dont-know-how-bad-the-coronavirus-is-going-to-get-either/">https://fivethirtyeight.com/features/... I can only find the executive summary of the survey you reference.
@tomcm39 I’ve only been able to find the 2-3 page summaries of the COVID-19 expert surveys you’ve been doing. Have you published the full data anywhere?
@reichlab Same question.
Update 2: I am very confused.
538 published a second article ( https://fivethirtyeight.com/features/experts-say-the-coronavirus-outlook-has-worsened-but-the-trajectory-is-still-unclear/)">https://fivethirtyeight.com/features/... on the 26th, which covers the sixth survey, administered on the 23rd and 24th. (Summary: https://works.bepress.com/mcandrew/3/download/)">https://works.bepress.com/mcandrew/... The first 538 article we were discussing was published on the 20th.
The second 538 article says: “In past surveys, the experts have been asked to forecast numbers published by the [CDC], which tend to be lower than those from other sources. [...] This week, the survey asks experts to forecast numbers published by The COVID Tracking Project”
But the summaries for both the fifth and sixth surveys say that they asked experts about the Tracking Project’s numbers: (The page says “COVID Tracker” but it links to https://covidtracking.com"> https://covidtracking.com , not https://www.covidtracker.com"> https://www.covidtracker.com )
I’m guessing that the fifth survey also asked about the CDC’s numbers, but didn’t include responses to that in the summary, and 538 used the responses to that question. The summary for the fourth survey ( https://works.bepress.com/mcandrew/1/download/),">https://works.bepress.com/mcandrew/... admin. March 9-10, does reference CDC numbers.
So when 538 says on March 26 that they’re now reporting predictions about the Tracking Project’s numbers, not about the CDC’s numbers, either McAndrew et. al. stopped asking about CDC numbers in the sixth survey or 538 made this choice themselves. Both seem weird.
And another thing: one of the authors of the original (March 20) 538 article confirmed that they used data not published in the summary I found, and that they got the date right on the original chart: https://twitter.com/wiederkehra/status/1245040564392902659">https://twitter.com/wiederkeh...
So hypothesis #4 is out.
Also, this seems a lot less weird to me than it did two hours ago—maybe the experts surveyed originally had bad models, then updated based on case numbers that came out between the fifth and sixth surveys to produce a more accurate model. https://twitter.com/acidshill/status/1245059215049158657">https://twitter.com/acidshill...
Also, this seems a lot less weird to me than it did two hours ago—maybe the experts surveyed originally had bad models, then updated based on case numbers that came out between the fifth and sixth surveys to produce a more accurate model. https://twitter.com/acidshill/status/1245059215049158657">https://twitter.com/acidshill...
This thread has been a lesson in twitter (I created an account yesterday). It provokes rapid thinking and jumping to conclusions.
Okay, here are some more hypotheses I forgot to mention:
5. There are more degrees of freedom than we think, so @robertwiblin ‘s analysis isn’t a trivial exponential curve, it’s just lucky.
6. Experts actually *are* dumb. https://twitter.com/acidshill/status/1245041738122555393">https://twitter.com/acidshill...
5. There are more degrees of freedom than we think, so @robertwiblin ‘s analysis isn’t a trivial exponential curve, it’s just lucky.
6. Experts actually *are* dumb. https://twitter.com/acidshill/status/1245041738122555393">https://twitter.com/acidshill...
The summary of the fourth survey ( https://works.bepress.com/mcandrew/1/download/)">https://works.bepress.com/mcandrew/... says that, on March 9-10, the aggregate prediction of the 21 experts surveyed was that there would be 1819 cases (80% CI of 823-6204) reported by the CDC on March 16. The real number was 4226.
The summary of the fifth survey ( https://works.bepress.com/mcandrew/2/download/)">https://works.bepress.com/mcandrew/... says that, on March 16-17, the aggregate prediction of the 21 experts surveyed was that there would be 10567 cases (80% CI of 7061-24180) reported by the Tracking Project on March 23. The real number was 42152.
The summary of the sixth survey ( https://works.bepress.com/mcandrew/3/download/)">https://works.bepress.com/mcandrew/... says that, on March 23-24, the aggregate prediction of the 20 experts surveyed was that there would be 116900 cases (80% CI of 66200-199590) reported by the Tracking Project on March 29. The real number was 139061.
So, the six-day aggregate expert prediction was off _ times less than the real number on these dates:
March 9-10: 2.3x less
March 16-17: 4.0x less
March 23-24: 1.2x less
March 9-10: 2.3x less
March 16-17: 4.0x less
March 23-24: 1.2x less
The size of the six-day aggregate expert 80% CI was _ times the point estimate on these dates:
March 9-10: 3.0x
March 16-17: 1.6x
March 23-24: 1.1x
I *think* it makes sense to look at the CI as a multiple of the point estimate, but I’m not sure.
March 9-10: 3.0x
March 16-17: 1.6x
March 23-24: 1.1x
I *think* it makes sense to look at the CI as a multiple of the point estimate, but I’m not sure.
I’d love to get the full survey data so I can play around with this more. I’m especially interested in the two-week predictions.
One concern with this data is that each week, McAndrew and Reich surveyed a different set of experts (although there was some overlap from week to week) I don’t know how much that effects things.
(i.e. When the prediction error changes from week to week, how much of that is due to the experts changing their models, how much is due to each week’s sample being unrepresentative in different ways—and how much is due to the same models being variably inaccurate?)

 Read on Twitter


![The second 538 article says: “In past surveys, the experts have been asked to forecast numbers published by the [CDC], which tend to be lower than those from other sources. [...] This week, the survey asks experts to forecast numbers published by The COVID Tracking Project” The second 538 article says: “In past surveys, the experts have been asked to forecast numbers published by the [CDC], which tend to be lower than those from other sources. [...] This week, the survey asks experts to forecast numbers published by The COVID Tracking Project”](https://pbs.twimg.com/media/EUd0DqeUEAABO7G.jpg)


