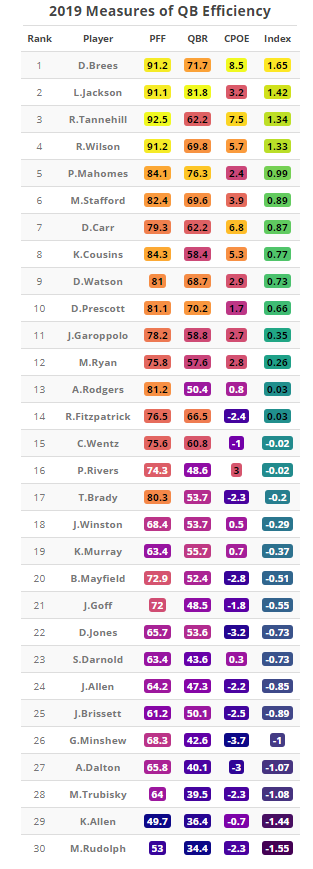
Some measures of quarterback play in 2019 (PFF grades, QBR, and CPOE).
The "Index" column represents averages over the other 3 columns, with the value being standard deviations above or below average (ie 0.0 represents being perfectly average among QBs with 320 plays).
The "Index" column represents averages over the other 3 columns, with the value being standard deviations above or below average (ie 0.0 represents being perfectly average among QBs with 320 plays).
Inspiration for this table here: https://twitter.com/MikeClayNFL/status/1244999897495019525">https://twitter.com/MikeClayN...
Playing around with different table makers in R and somehow they all look ugly, just like the efficiency of the Bills& #39; passing offense (this is reactable: https://glin.github.io/reactable/index.html)">https://glin.github.io/reactable...
This isn& #39;t the packages& #39; fault, I& #39;m just really bad at making these (this is from & #39;condformat& #39; and looks like something from a bad 1990s video game)
I think I would like this one best (& #39;formattable& #39;) if I could figure out how to get the intermediate values to be white instead of brown, but, alas, https://twitter.com/benbbaldwin/status/1245032014270599170">https://twitter.com/benbbaldw...
Ahhh now we& #39;re talking (thanks to @recspecs730 for pointing me to kableExtra: https://cran.r-project.org/web/packages/kableExtra/vignettes/awesome_table_in_html.html)">https://cran.r-project.org/web/packa...

 Read on Twitter


