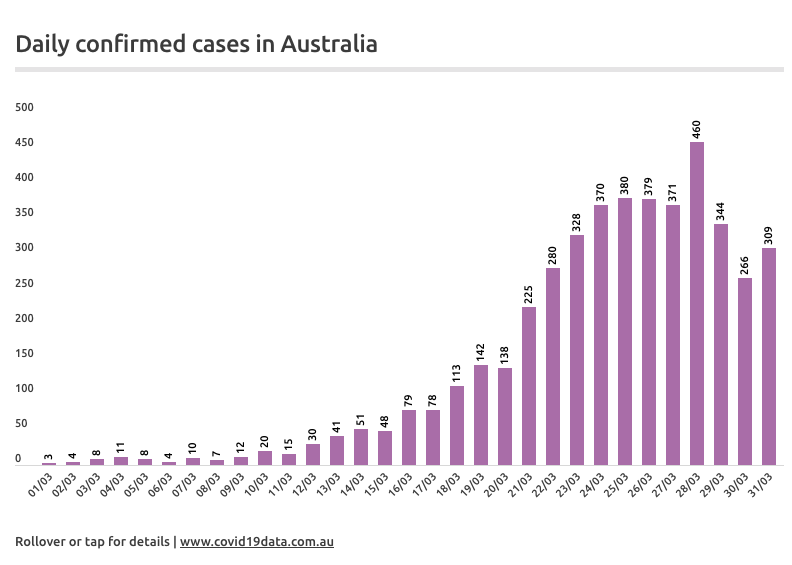
Thread. 1/12. Let’s talk about transmission sources. The growth of #COVID19 in Australia appears to have slowed with fewer confirmed cases announced for the last 3 days (yes, let& #39;s talk testing and 3-day averages soon).
#COVID19au #Covid_19australia
#COVID19au #Covid_19australia
2/12. Today was just over 2 weeks since the fed govt announced travellers arriving in Aus had to self-isolate for 14 days. And it was about 1.5 weeks since borders closed to non-residents and non-citizens. So we’re probably seeing these policies start to bite. #auspol
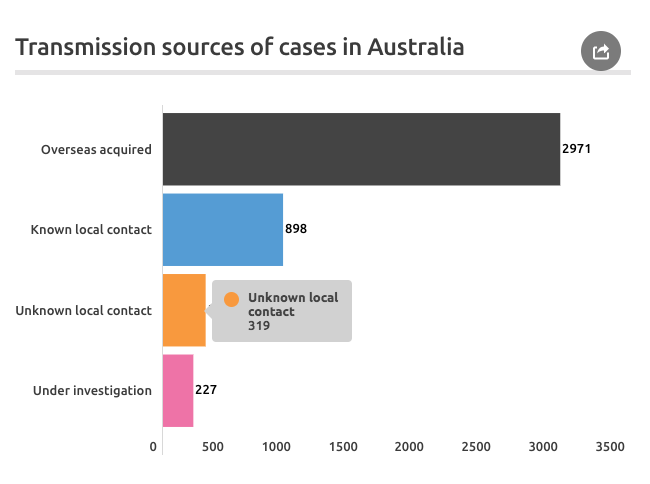
3/12. So the question is - how many of the new confirmed cases each day are linked to OS-travel, and how many are community transmissions?
4/12. Here are the numbers pulled together from each state and territory ... (caveat: these figures are a collation of data from diff places and in diff forms. An explanation of data sources is under the 2nd chart here https://www.covid19data.com.au/transmission-sources)">https://www.covid19data.com.au/transmiss...
5/12. The number of #coronavirus transmissions by unknown local contact is highlighted. The most important Q right now seems to be, is this number growing and at what rate?
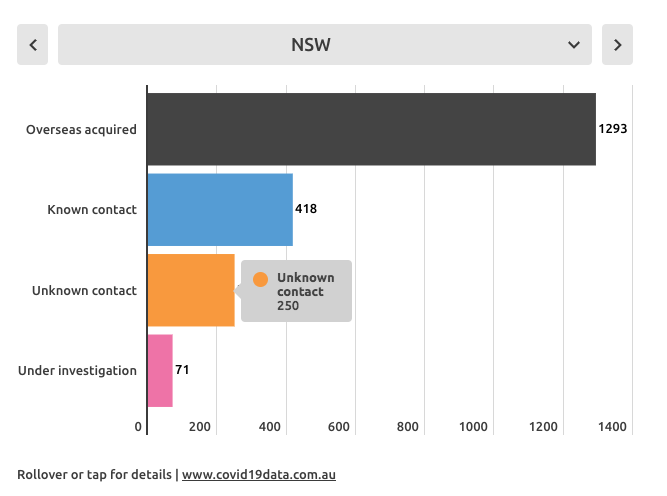
We don& #39;t know the timeline of unknown local transmissions nationally b/c QLD, SA and WA don& #39;t give the info. But we do know it for NSW, VIC, TAS, NT, ACT. (Thanks to @NSWHealth @VicGovDHHS @VictorianCHO for releasing the data and the other states for the info in press releases).
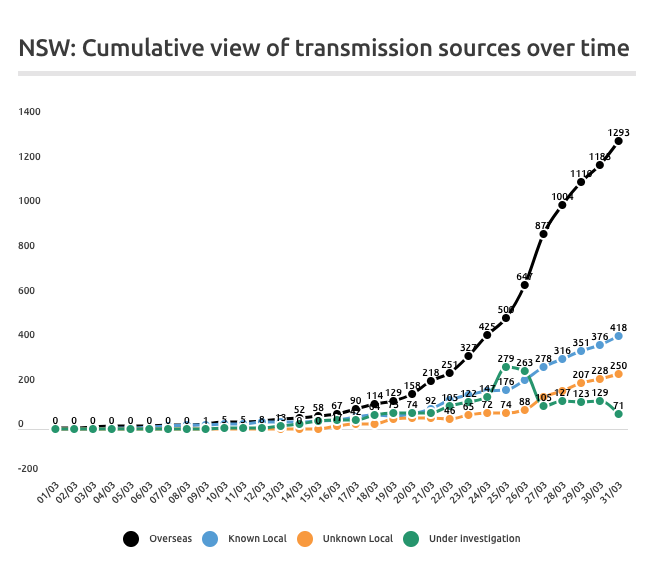
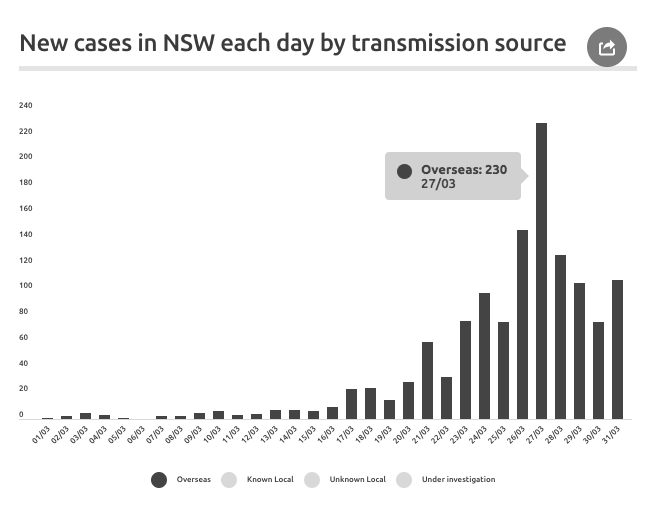
8/12. Here is a breakdown of the underlying sources of confirmed #COVID_19 cases in NSW over time: (click the image to see the legend)
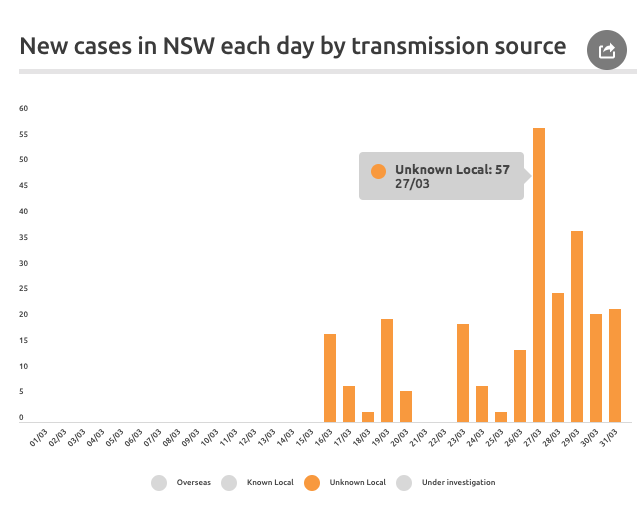
10/12. Here is the daily view of cases acquired by an unknown local contact: (note the scale is diff on this chart from that above).
*Watch this chart to see if our social distancing and shutdown interventions are working.* (there& #39;ll be a lag before we can see full effects).
*Watch this chart to see if our social distancing and shutdown interventions are working.* (there& #39;ll be a lag before we can see full effects).
11/12. It& #39;s possible to view this for NSW, VIC, TAS, NT and ACT at http://www.covid19data.com.au/transmission-sources.">https://www.covid19data.com.au/transmiss... (Tip: if you visit the site, use the icons in the chart legends to select and deselect categories and get a clearer view of them individually like I& #39;ve done above).
12/12. One more thing - health authorities are gradually releasing more and more data. I& #39;m just trying to pull it all together. Here are some good pages / dashboards:
https://www.health.gov.au/news/health-alerts/novel-coronavirus-2019-ncov-health-alert/coronavirus-covid-19-current-situation-and-case-numbers
https://www.health.gov.au/news/heal... href=" https://www.health.nsw.gov.au/Infectious/diseases/Pages/covid-19-latest.aspx
https://www.health.nsw.gov.au/Infectiou... href=" https://data.nsw.gov.au/nsw-covid-19-data">https://data.nsw.gov.au/nsw-covid... https://app.powerbi.com/view?r=eyJrIjoiODBmMmE3NWQtZWNlNC00OWRkLTk1NjYtMjM2YTY1MjI2NzdjIiwidCI6ImMwZTA2MDFmLTBmYWMtNDQ5Yy05Yzg4LWExMDRjNGViOWYyOCJ9">https://app.powerbi.com/view...
https://www.health.gov.au/news/health-alerts/novel-coronavirus-2019-ncov-health-alert/coronavirus-covid-19-current-situation-and-case-numbers
gnight. https://www.covid19data.com.au/ ">https://www.covid19data.com.au/">...
Clarification: SA / WA do now release net unknown locals (see SA here: https://www.sa.gov.au/covid-19/dashboard">https://www.sa.gov.au/covid-19/... / WA here: https://ww2.health.wa.gov.au/Articles/A_E/Coronavirus/COVID19-statistics)">https://ww2.health.wa.gov.au/Articles/... - but they haven& #39;t released transmission sources over time, so we can& #39;t get timeline views.
Update: a couple of excellent tweeters are going to help me fill in the gaps for WA. We& #39;ll get a timeline up soon.
One more update: thank you @mattlwood @PhillipMeng for going through WA cases to help me plug holes! I was wrong to write we do not know & #39;unknown locals& #39; for WA (brain explosion moment, I actually have these - no more late-night tweeting).
But there are still holes in our overall knowledge of transmission sources in WA, hence no timeline on the site. Also must clarify on this thread SA has recently started releasing this info more completely so we will track going forward.

 Read on Twitter