#Bajaj Finance
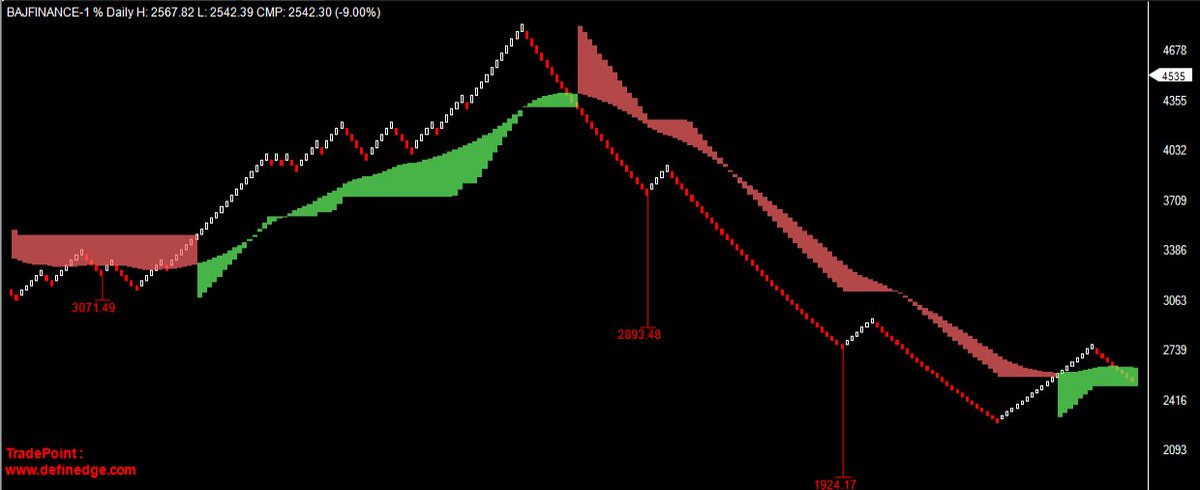
Any close below the MAST cloud i.e 2500 would not mean well for this stock. Bearish extension of 1924 still in consideration.
Any close below the MAST cloud i.e 2500 would not mean well for this stock. Bearish extension of 1924 still in consideration.
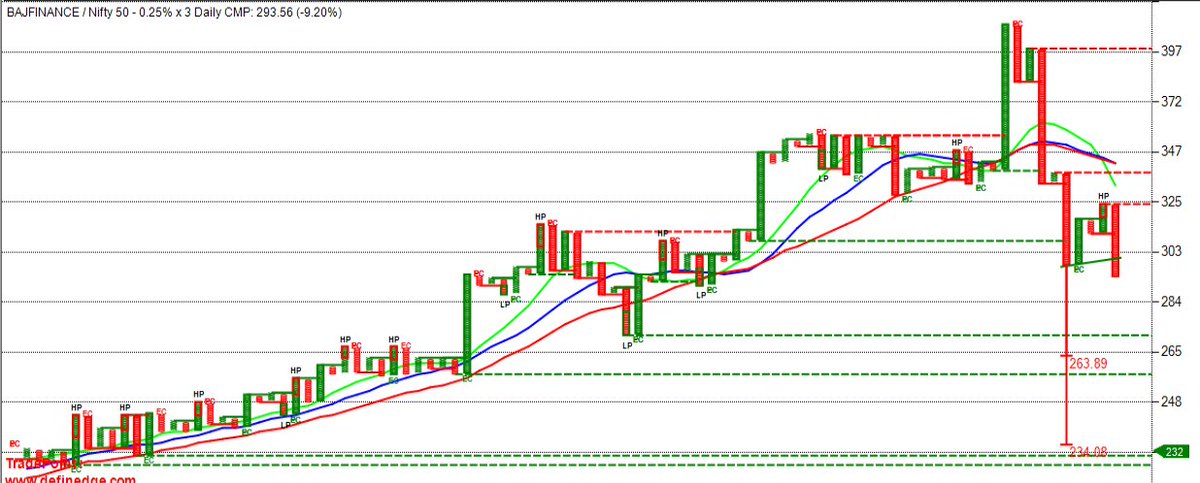
BajajFin vs Nifty 50 - Relative Strength
Underperforming Nifty50 for almost a month which is rare for it.
Underperforming Nifty50 for almost a month which is rare for it.
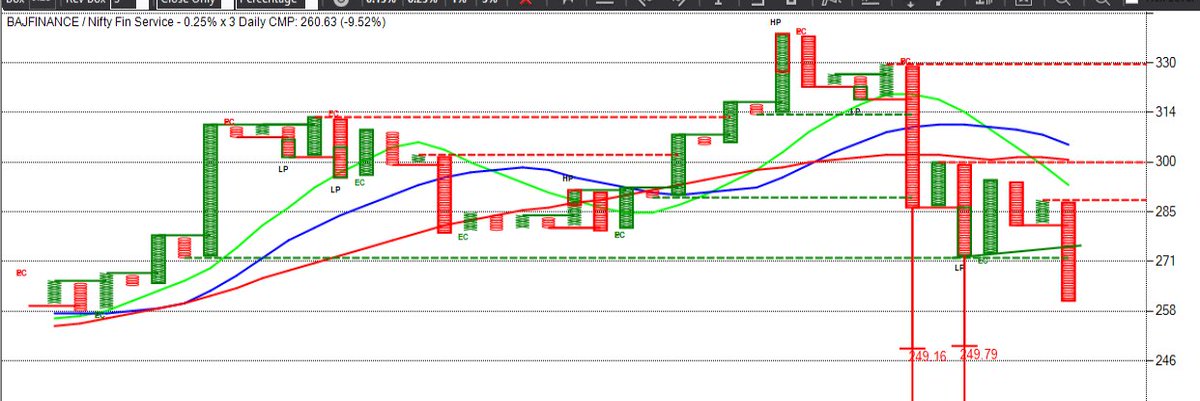
BajajFin vs Financial Index - Relative Strength
The weakness againt Financial Services index is very much obvious. The current ratio of 260 can correct further to 249. So another 5-6% fall in ratio would mean further weakness on this counter.
The weakness againt Financial Services index is very much obvious. The current ratio of 260 can correct further to 249. So another 5-6% fall in ratio would mean further weakness on this counter.
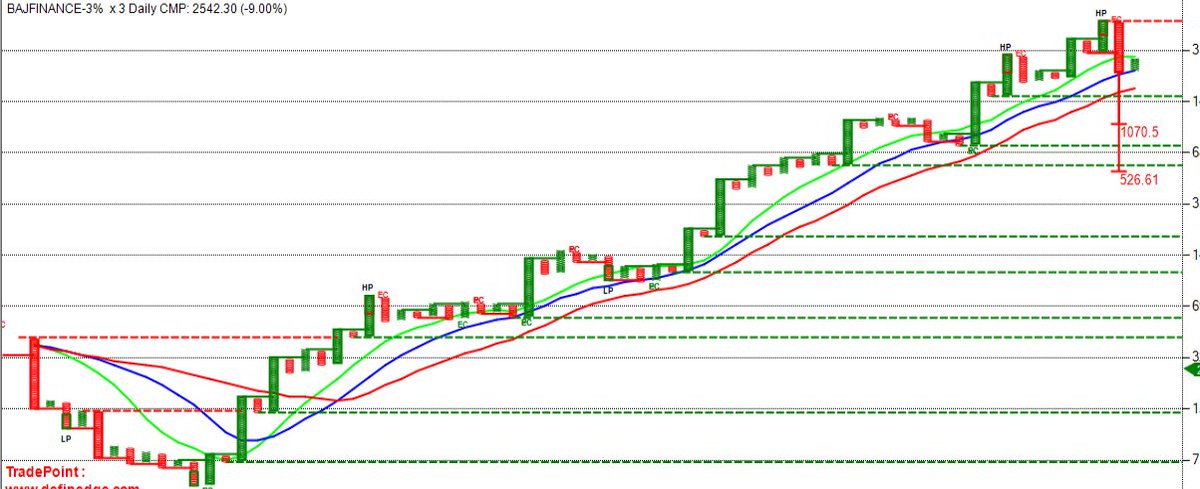
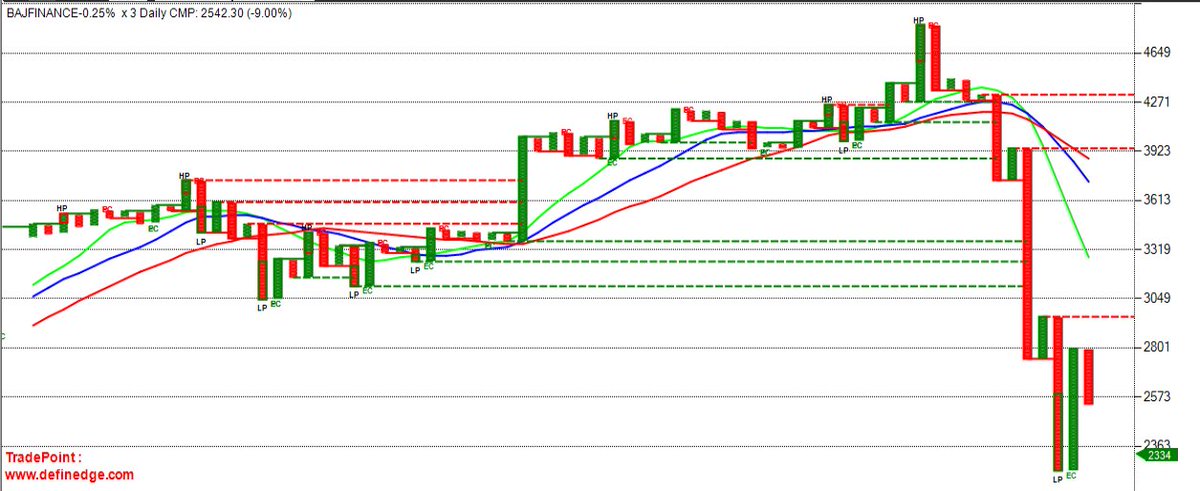
on PNF chart of 3% which is usually a long term chart.
Any close below 2241 would trigger an Bearish Anchor follow through. In that case 1070 would be in contention
Any close below 2241 would trigger an Bearish Anchor follow through. In that case 1070 would be in contention
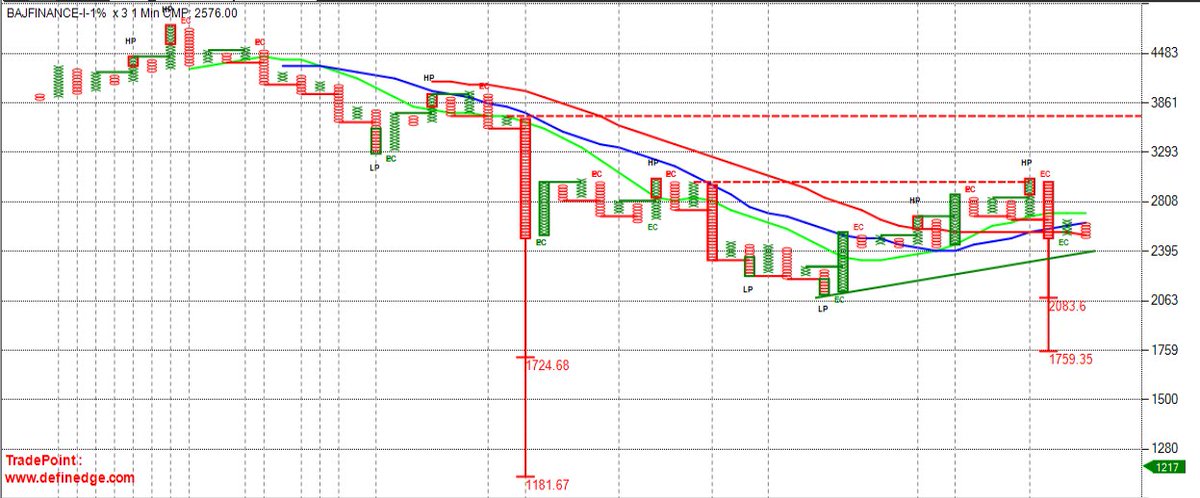
As Short term positional trading perspective on .25% Box Size on Point & Figure charts.
Any close below 2265 would imply a failure of a bullish pattern i.e Low Pole Failure and could trigger further bearishness,
Any close below 2265 would imply a failure of a bullish pattern i.e Low Pole Failure and could trigger further bearishness,

 Read on Twitter