Thread on how we count Covid-19 cases. And why I believe India may still be able to dodge this bullet. Just STAY HOME, folks, and we can beat this. https://twitter.com/ErikVoeten/status/1242241295990566912">https://twitter.com/ErikVoete...
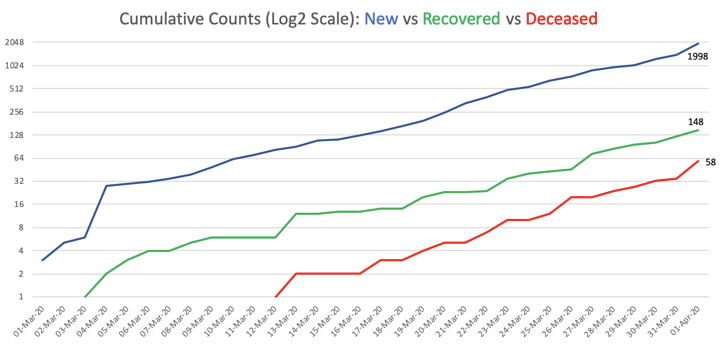
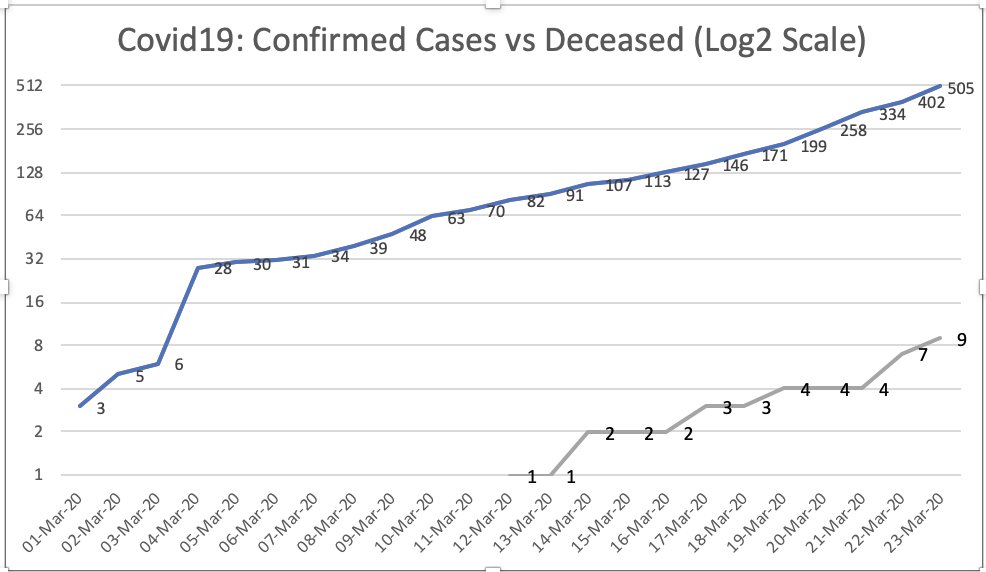
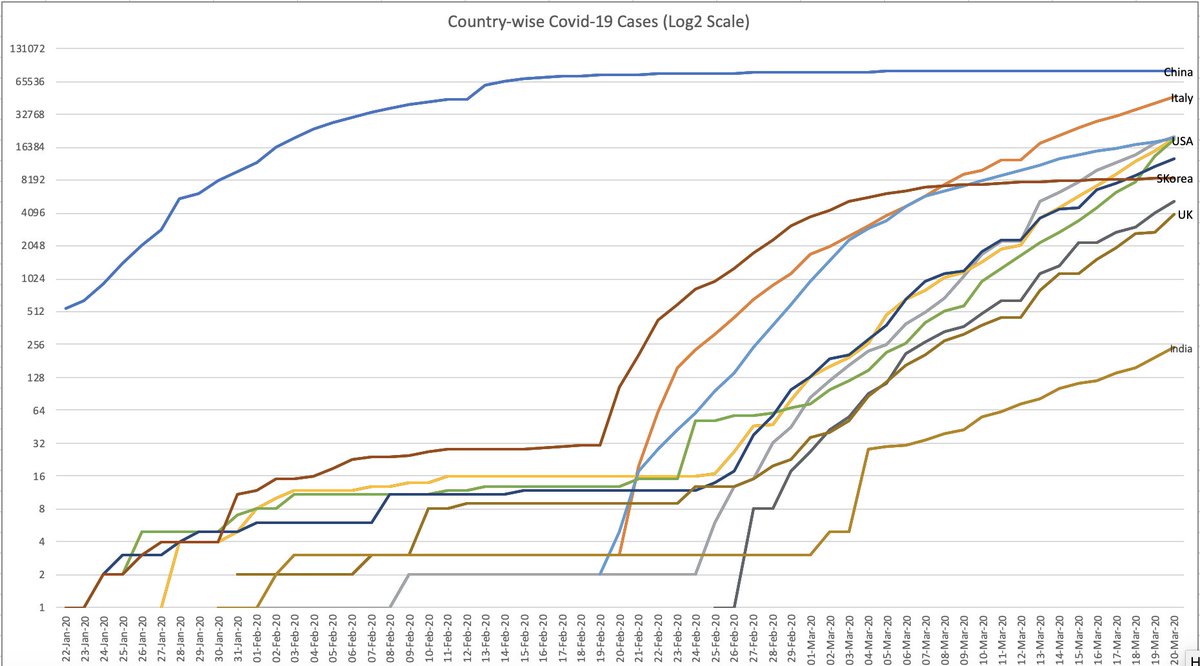
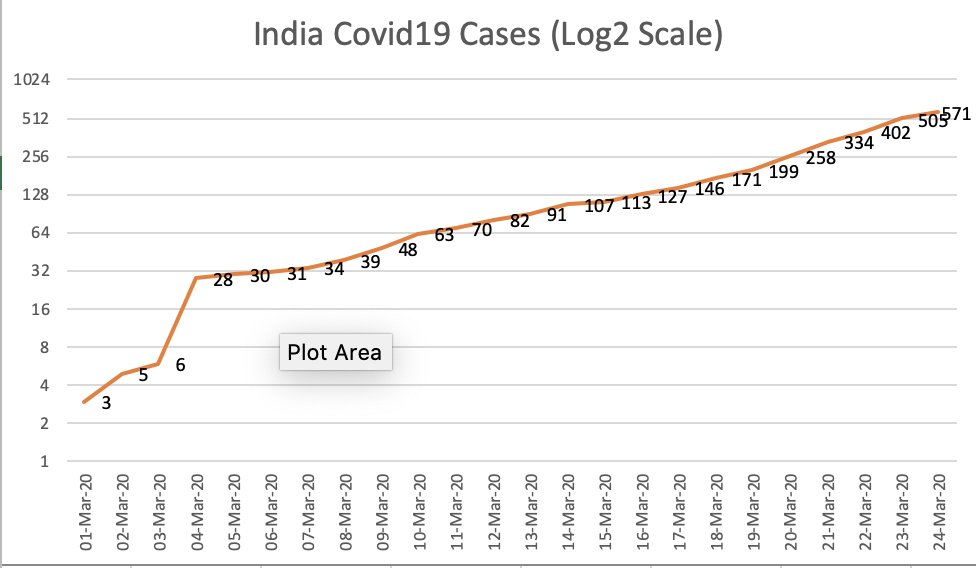
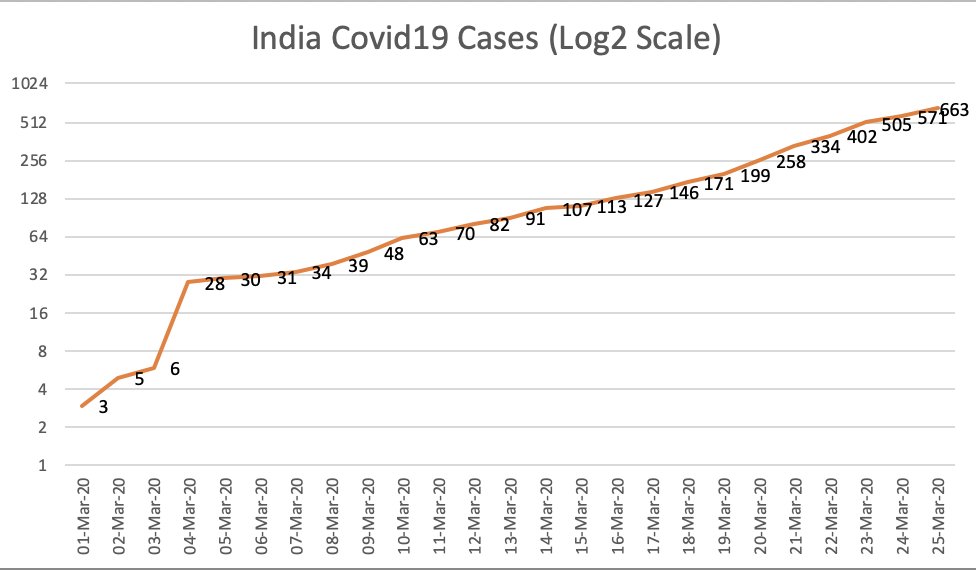
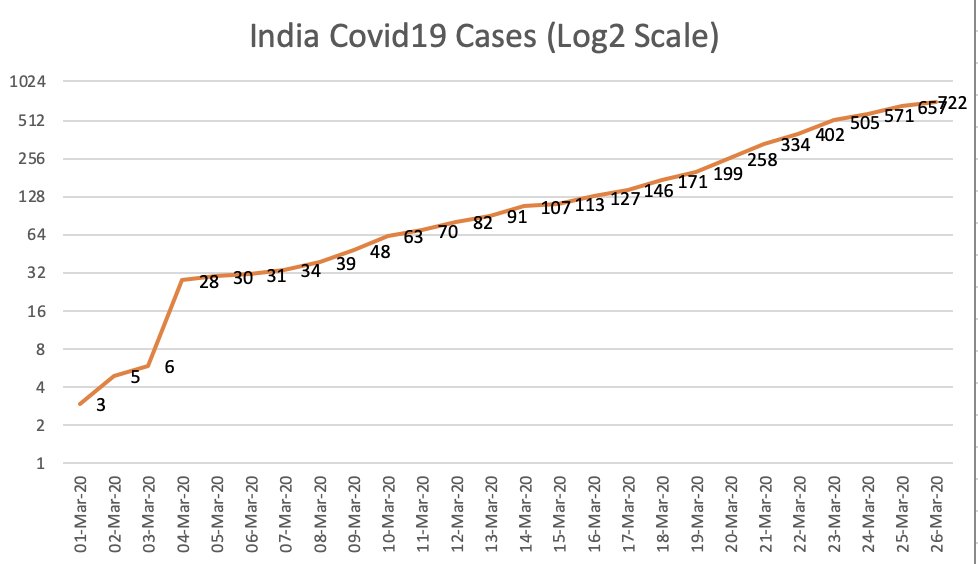
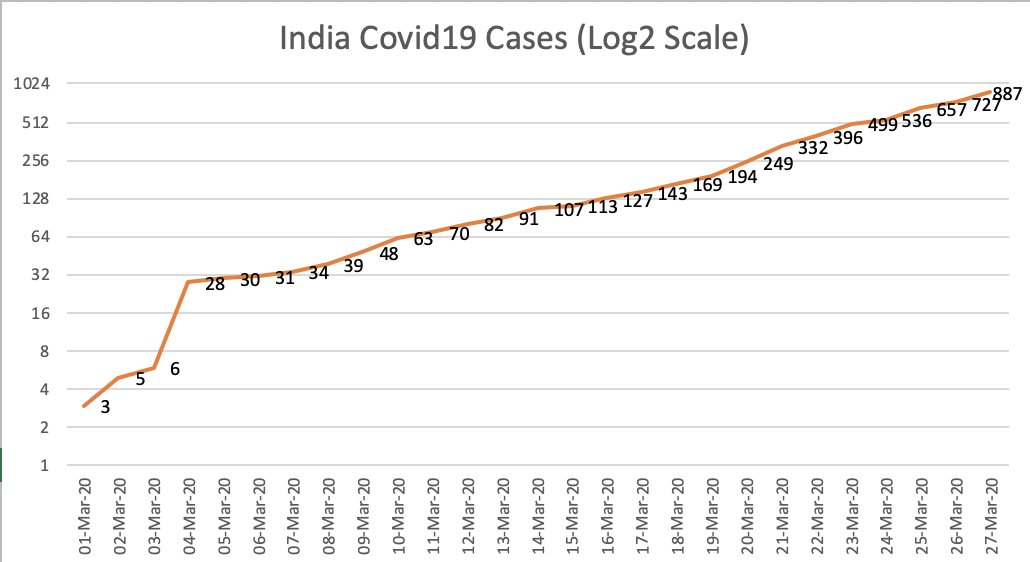
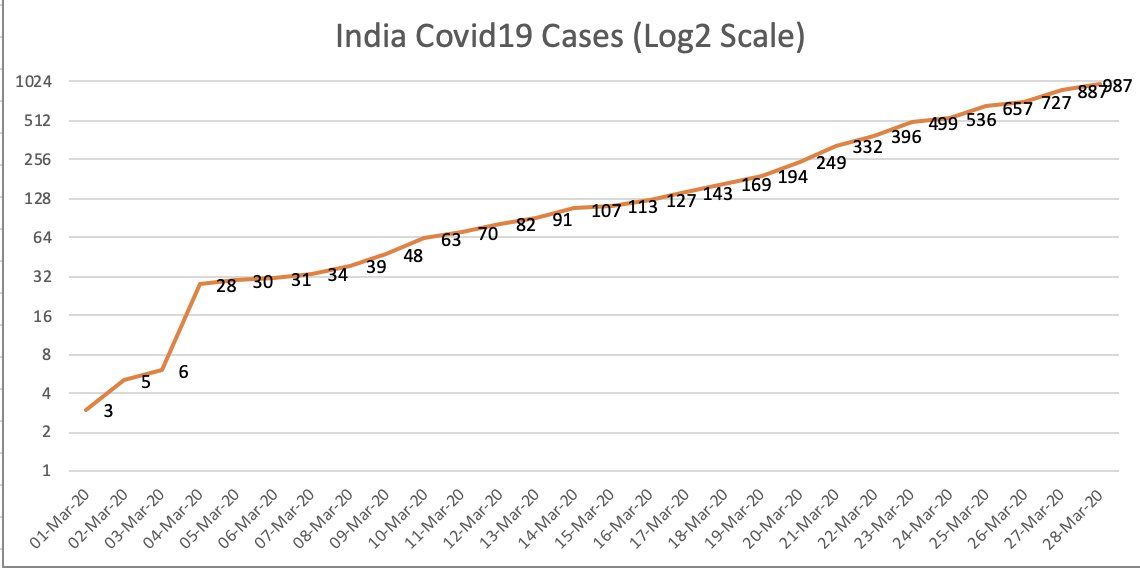
Since many asked, I have charted India& #39;s Covid-19 cases in Logarithmic scale (base2) instead of the linear scale which most dashboards are showing. This shows how quickly we are doubling.
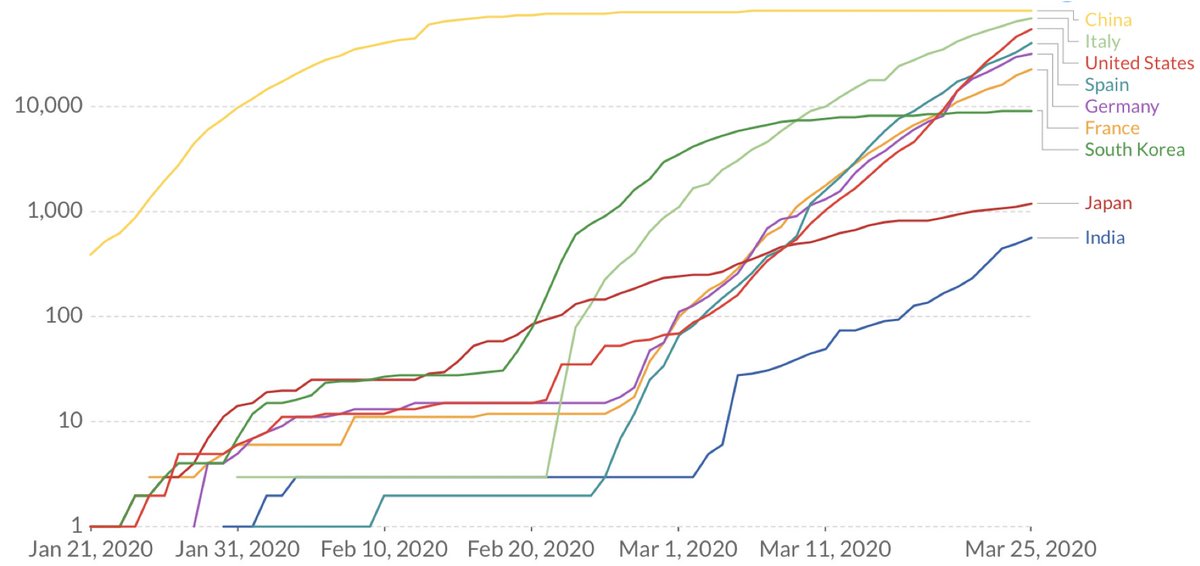
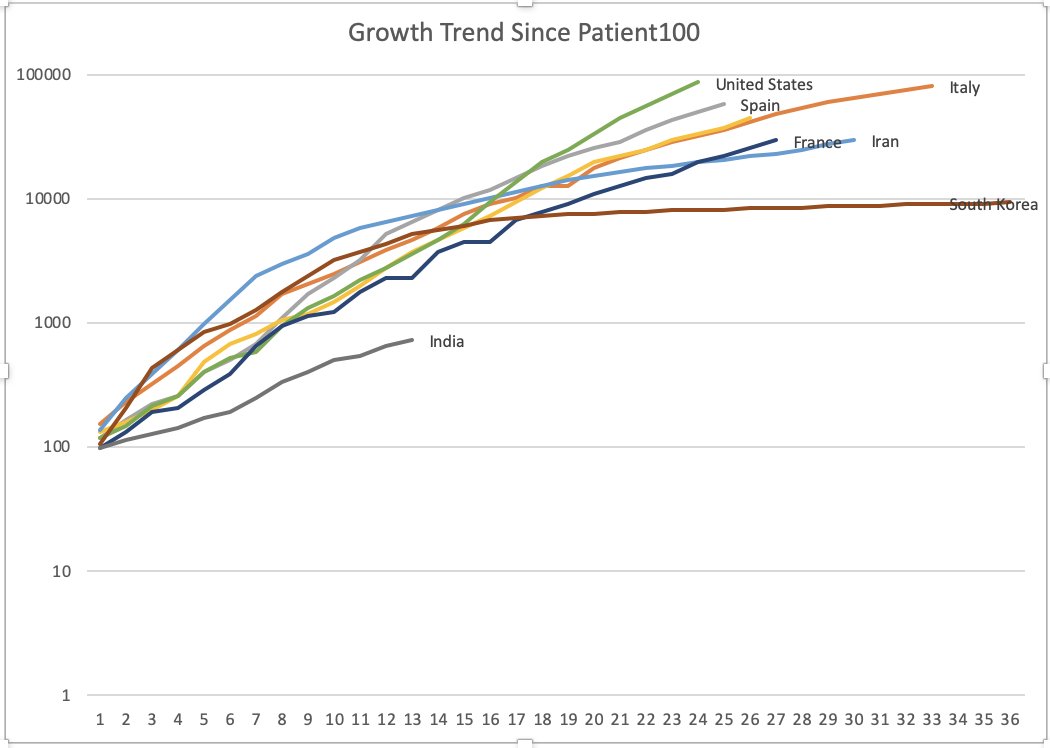
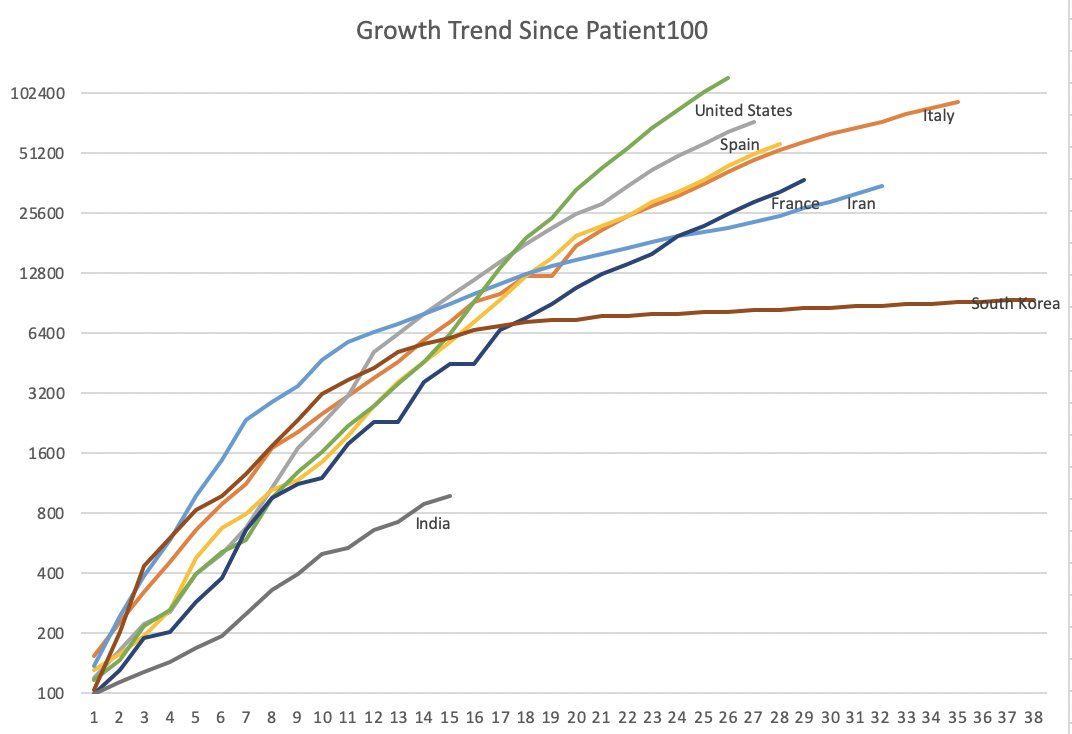
And here& #39;s a comparison of India with other countries.
(Data via Harvard Dataverse: https://dataverse.harvard.edu/dataset.xhtml?persistentId=doi%3A10.7910%2FDVN%2FL20LOT&fbclid=IwAR3syEfBfkGZ281MF5mV4m0Z8LhusKpE6qrcyyhN1XFq2na_Qf5UcK-O8ic;">https://dataverse.harvard.edu/dataset.x... There& #39;s only data available till 20Mar& #39;20).
(Data via Harvard Dataverse: https://dataverse.harvard.edu/dataset.xhtml?persistentId=doi%3A10.7910%2FDVN%2FL20LOT&fbclid=IwAR3syEfBfkGZ281MF5mV4m0Z8LhusKpE6qrcyyhN1XFq2na_Qf5UcK-O8ic;">https://dataverse.harvard.edu/dataset.x... There& #39;s only data available till 20Mar& #39;20).
My India-specific Covid-19 trackers for today.
Shows total cases in a logarithmic scale (answers "how fast are we doubling?"), and a comparison with some other countries. 1/3
Shows total cases in a logarithmic scale (answers "how fast are we doubling?"), and a comparison with some other countries. 1/3
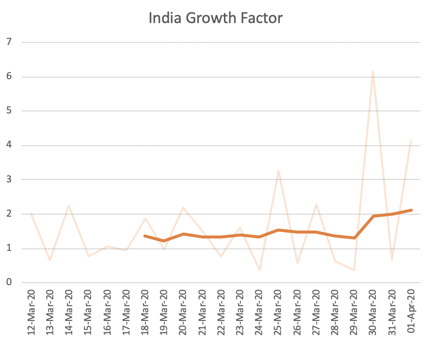
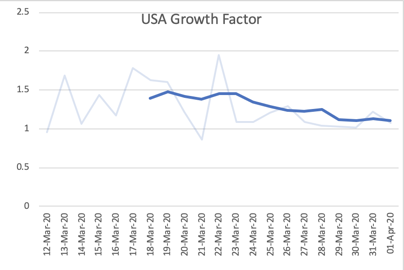
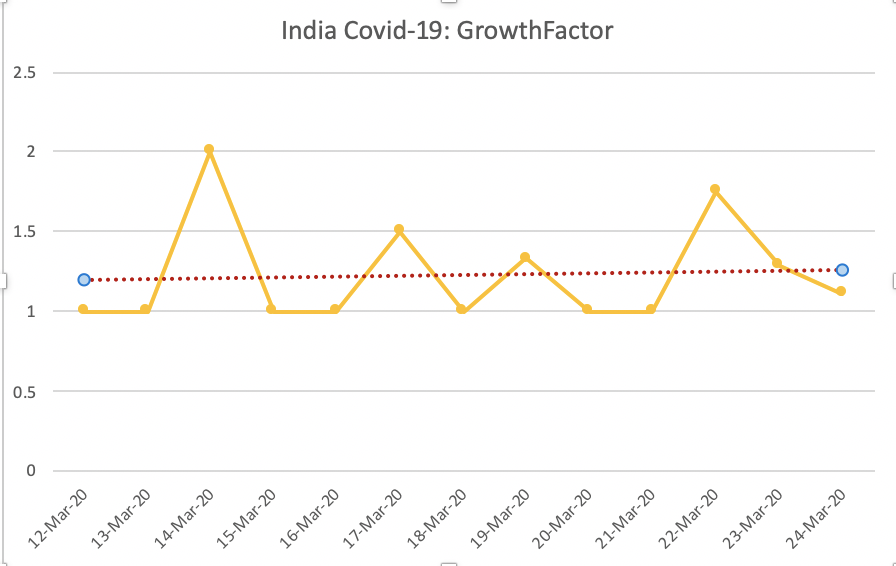
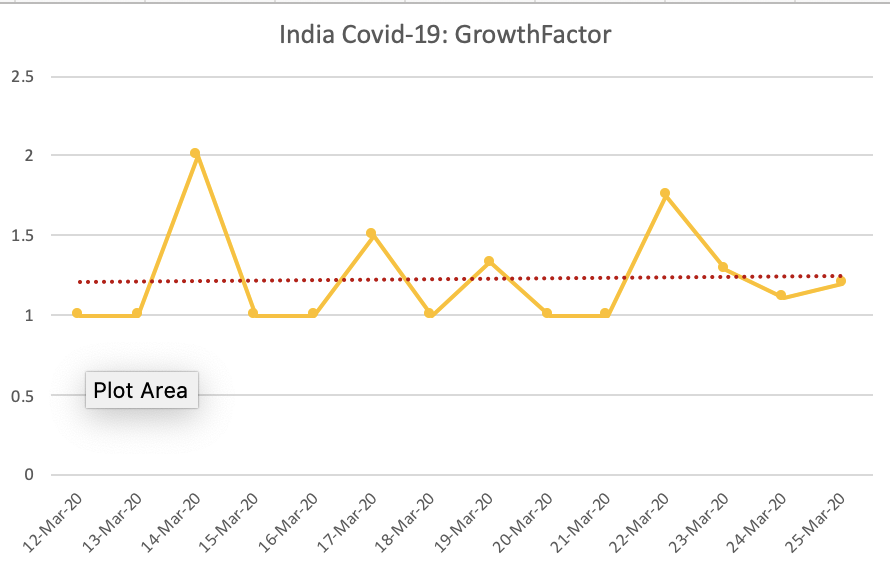
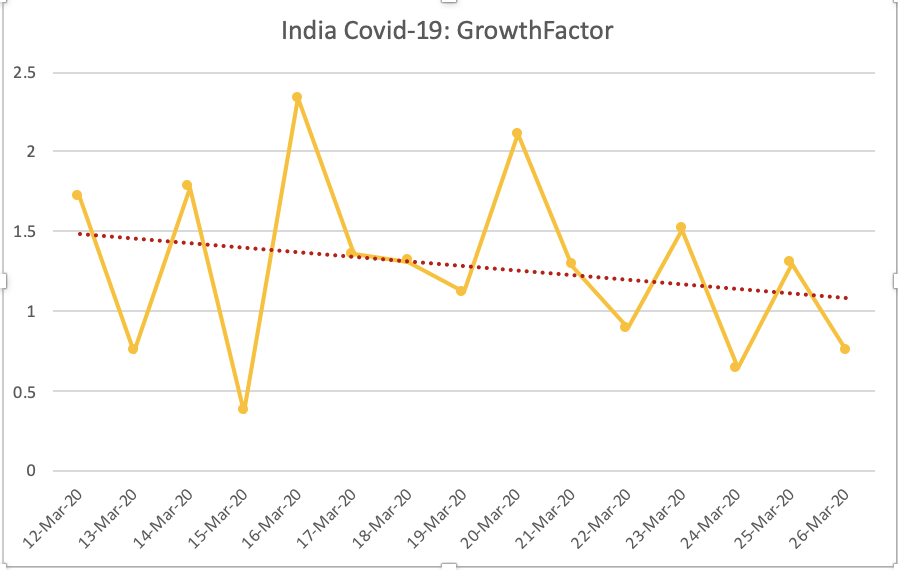
Next, the Growth Factor (simply, yesterday& #39;s new cases / the day before yesterday& #39;s). If GF>1, we& #39;re still growing. If trending towards 0, that& #39;s good. A GF constantly >1 shows exponential growth. 2/3
India-specific Covid-19 data as of EOD 25 Mar& #39;20.
The growth trends on a logarithmic scale showing how fast new cases are doubling. And a comparison with some other countries.. 1/3
The growth trends on a logarithmic scale showing how fast new cases are doubling. And a comparison with some other countries.. 1/3
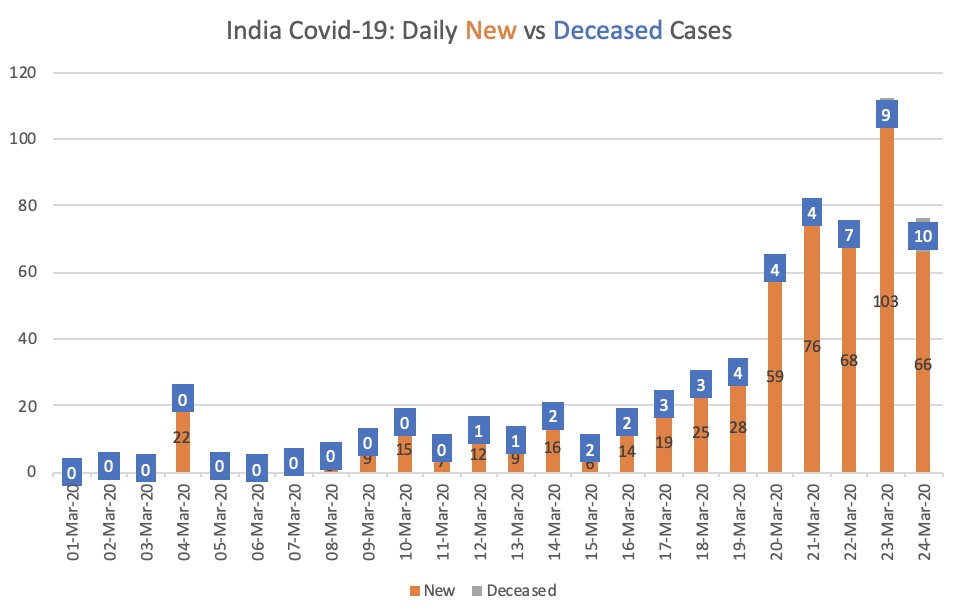
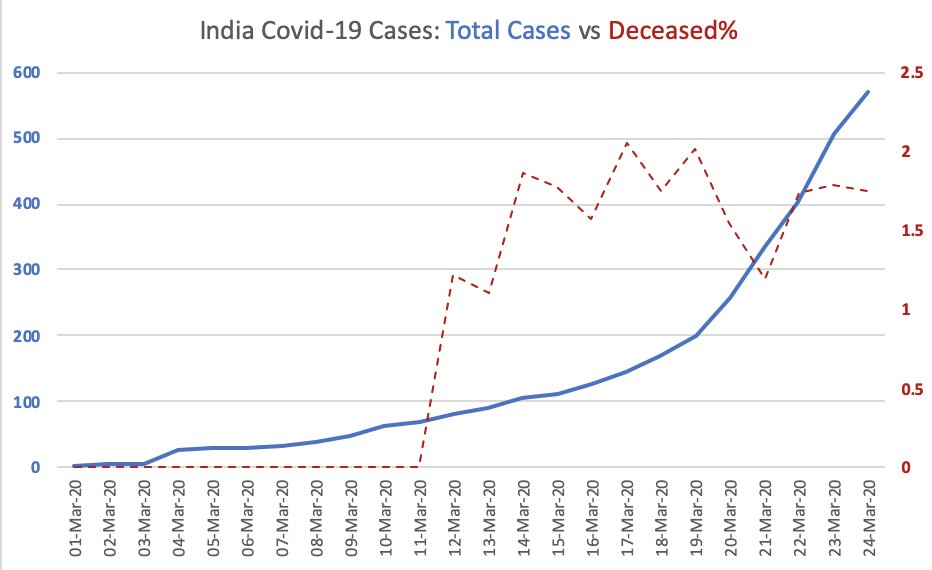
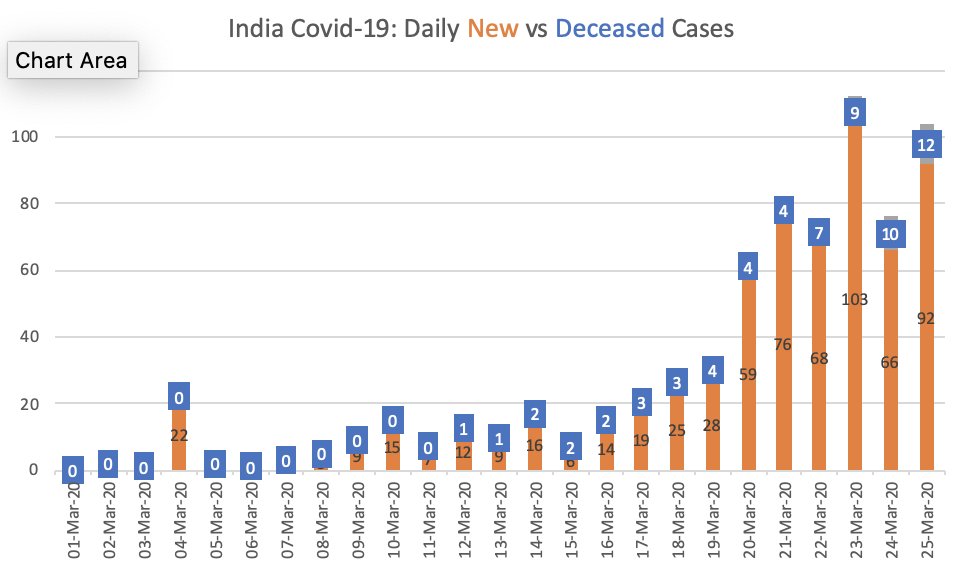
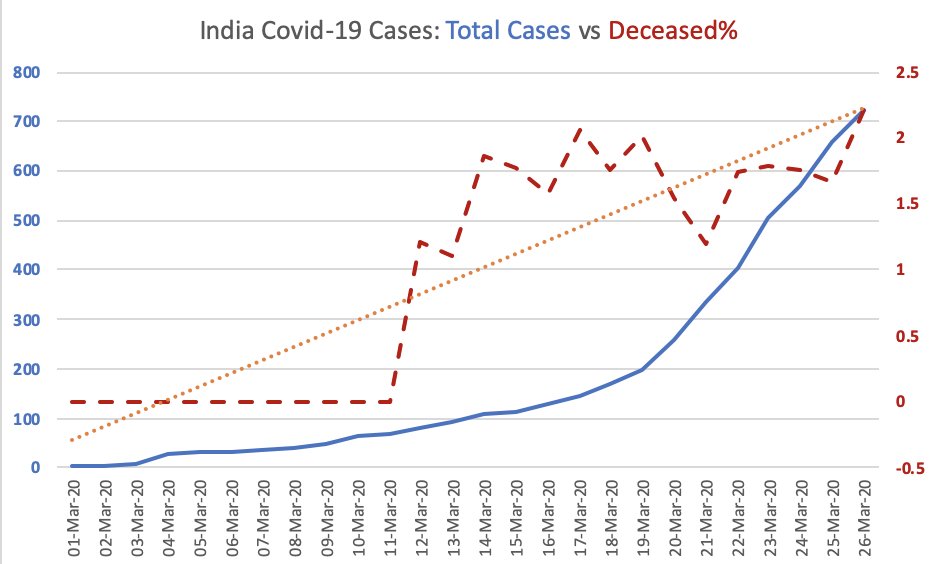
Finally, Daily new vs deceased data. And Cumulative Cases and Deceased as a % of Covid-19 cases. At present, Deceased% is just above 2% of total cases.
3/3
3/3
My India-specific Covid-19 dashboards:
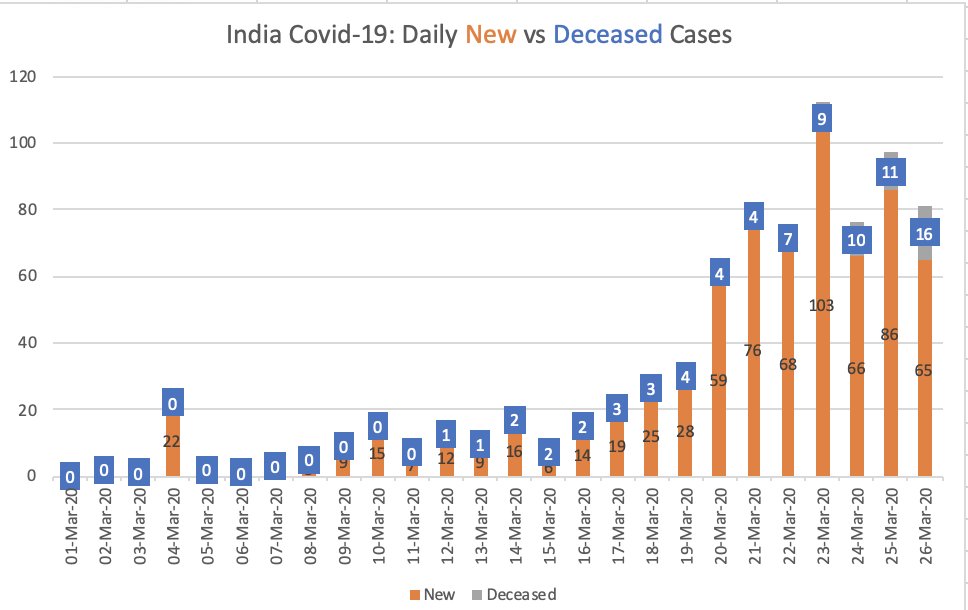
a. Raw data showing count of new cases and deceased as of 26Mar& #39;20
b. Cumulative number of cases and Deceased as a % of that. We are currently at 2%.
1/3
a. Raw data showing count of new cases and deceased as of 26Mar& #39;20
b. Cumulative number of cases and Deceased as a % of that. We are currently at 2%.
1/3
India-specific Covid-19 dashboard 2/3:
a. Growth rate on a Logarithmic scale (how fast are we doubling?)
b. Growth Factor trend. (if today& #39;s count is consistently > yesterday& #39;s we are growing; If it is equal, we are plateauing; If <1 and decreasing, good sign!)
a. Growth rate on a Logarithmic scale (how fast are we doubling?)
b. Growth Factor trend. (if today& #39;s count is consistently > yesterday& #39;s we are growing; If it is equal, we are plateauing; If <1 and decreasing, good sign!)
India-specific Covid-19 dashboard 3/3:
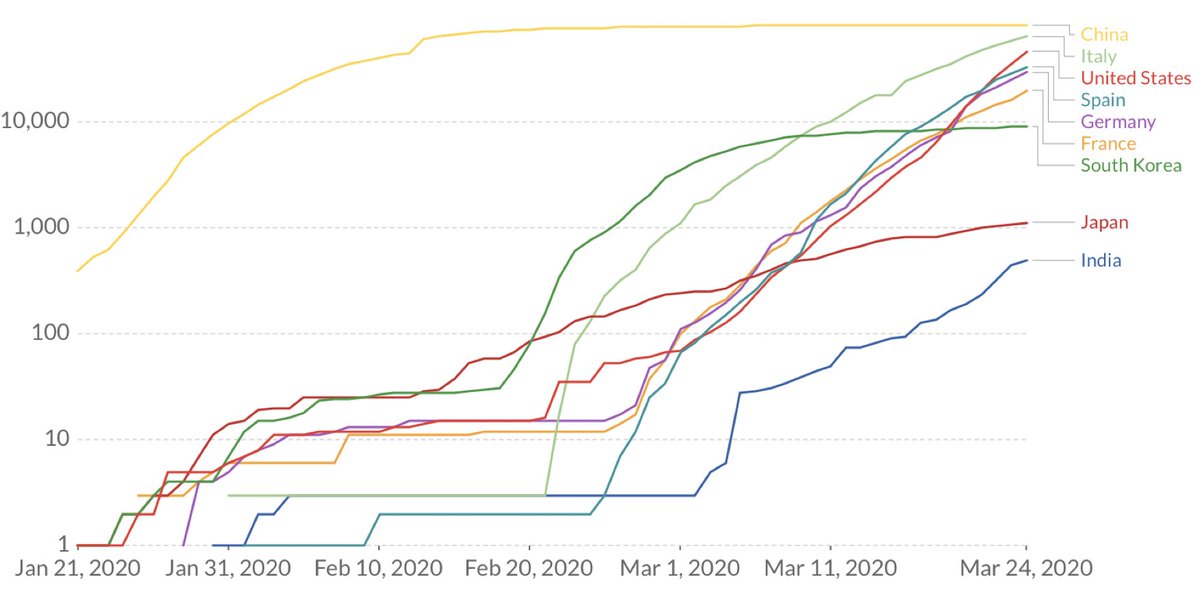
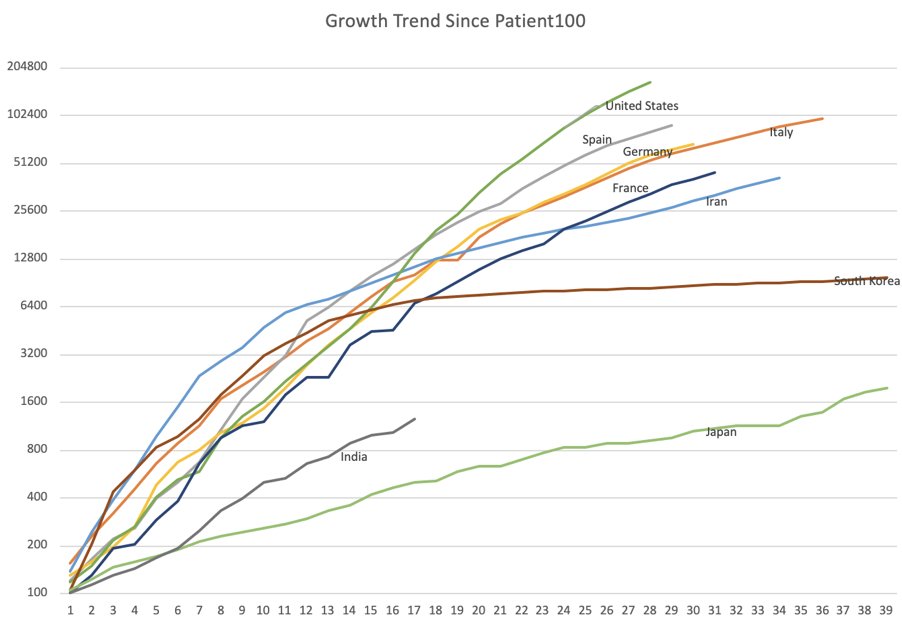
How do we compare with some other countries? This graph shows the trend since each country hit Patient #100.
How do we compare with some other countries? This graph shows the trend since each country hit Patient #100.
My India-specific Covid-19 dashboard: (1/3)
a. Raw data showing count of new cases and deceased as of 27Mar& #39;20
b. Cumulative number of cases and Fatality as a % of that (with a 2 week moving avg trendline). We are currently at slightly <2%.
[Source: http://worldometers.info"> http://worldometers.info ]
a. Raw data showing count of new cases and deceased as of 27Mar& #39;20
b. Cumulative number of cases and Fatality as a % of that (with a 2 week moving avg trendline). We are currently at slightly <2%.
[Source: http://worldometers.info"> http://worldometers.info ]
India-specific Covid-19 dashboard 2/3:
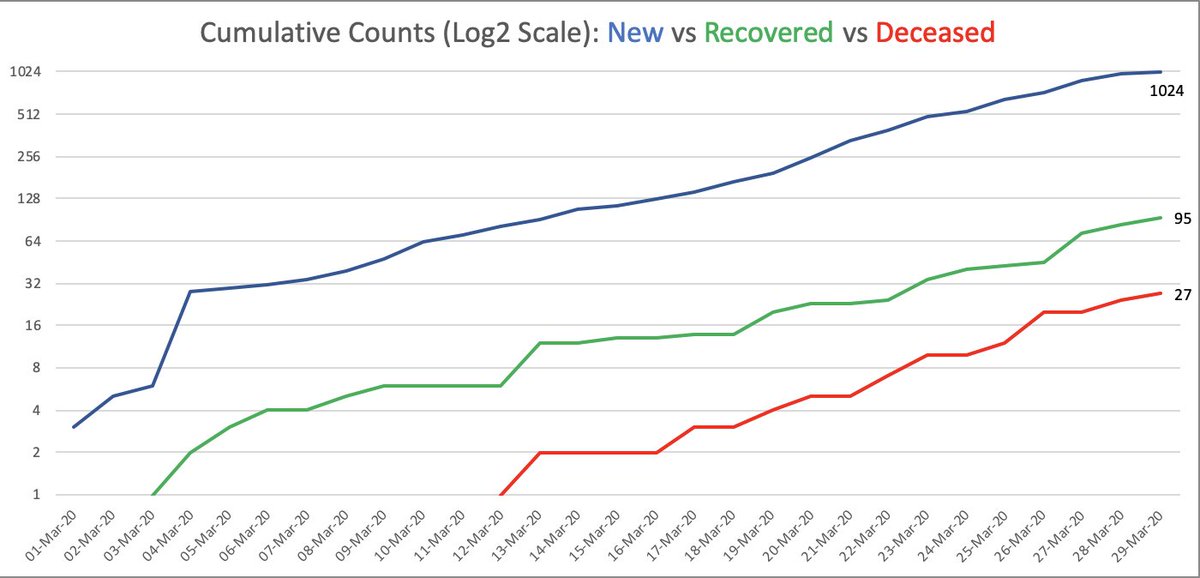
a. Growth rate on a Logarithmic scale (how fast are we doubling?)
b. How do we compare with rest of the world since Patient #100?
a. Growth rate on a Logarithmic scale (how fast are we doubling?)
b. How do we compare with rest of the world since Patient #100?
India-specific Covid-19 dashboard 3/3:
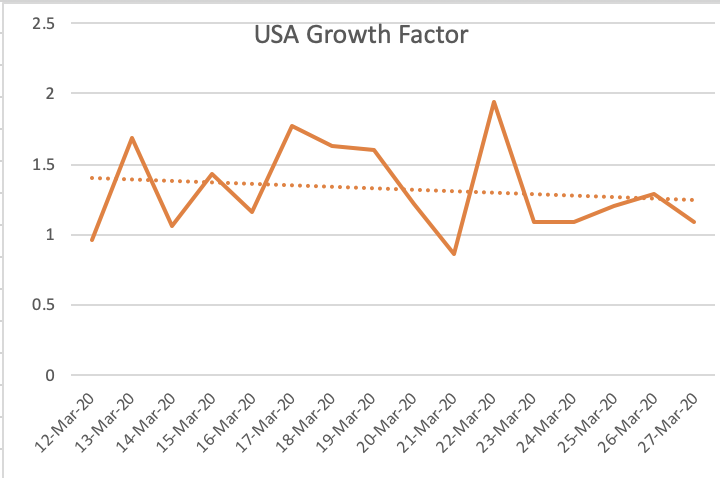
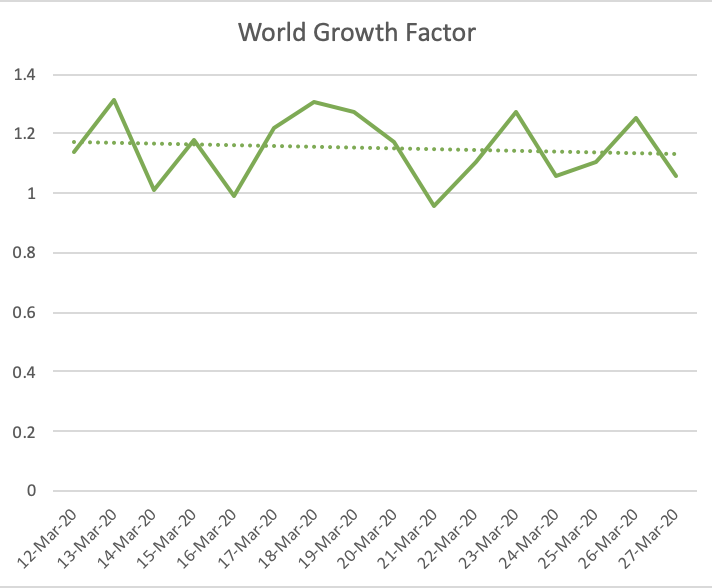
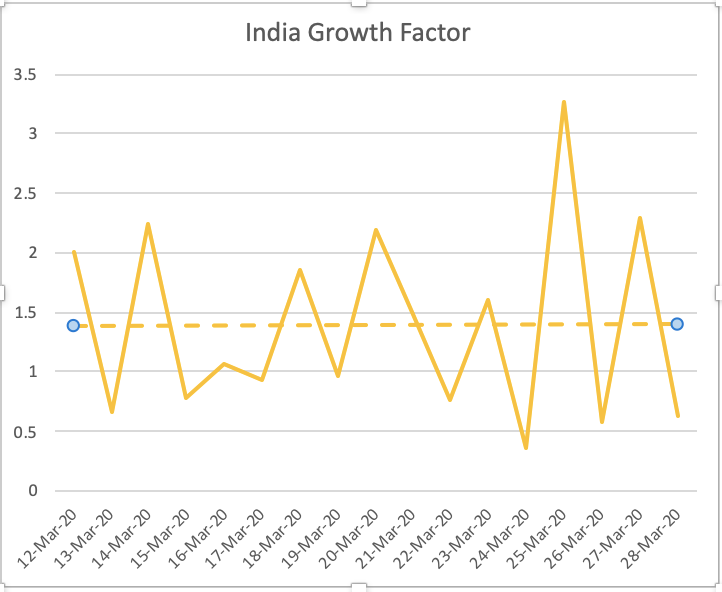
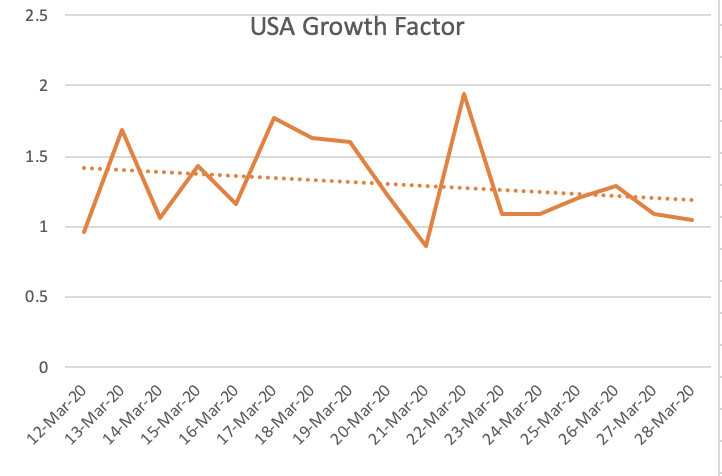
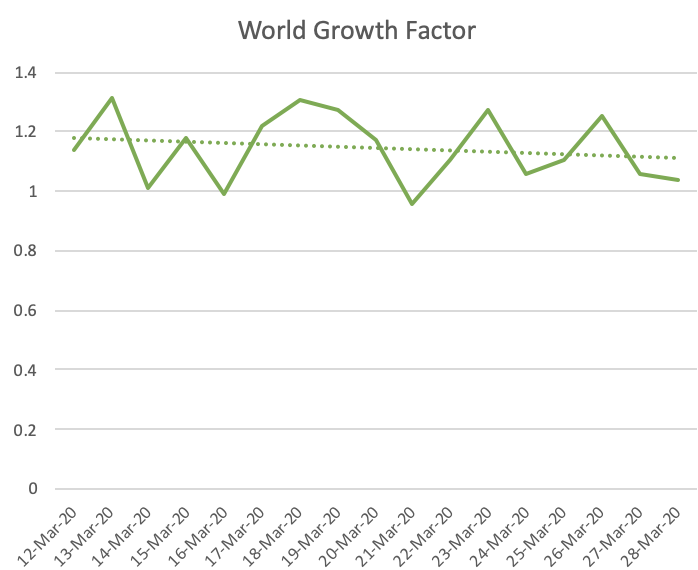
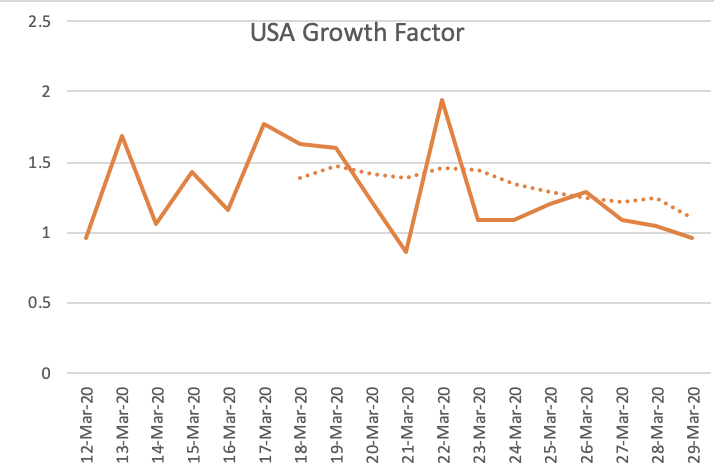
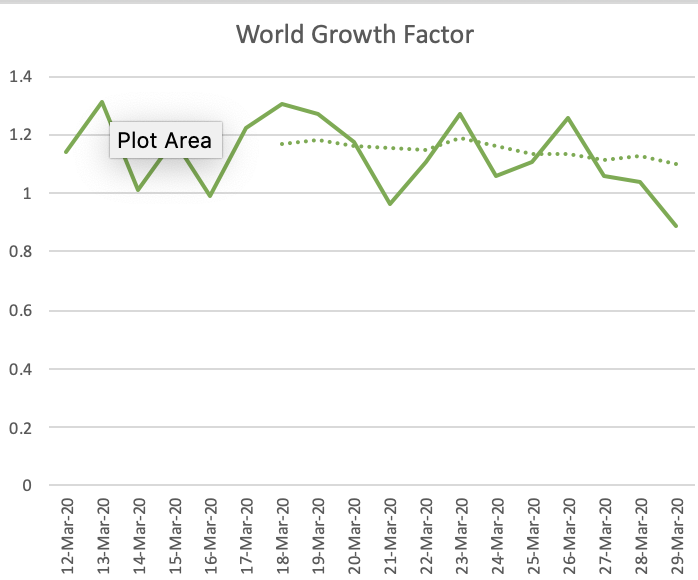
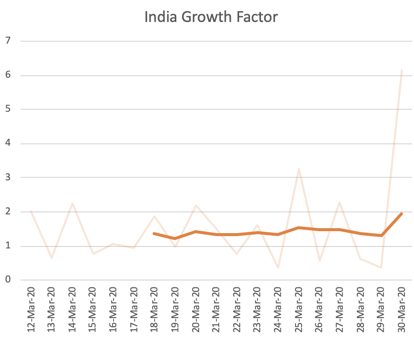
Growth Factor trend (If today& #39;s count is consistently > yesterday& #39;s we are growing; If it is equal, we are plateauing; If <1 and decreasing, good sign!)
a. India is still going up and down; Slight upward trend
b. World+USA are trending down
Growth Factor trend (If today& #39;s count is consistently > yesterday& #39;s we are growing; If it is equal, we are plateauing; If <1 and decreasing, good sign!)
a. India is still going up and down; Slight upward trend
b. World+USA are trending down
My India-specific Covid-19 dashboard 1/3:
a. Raw data showing count of new cases and deceased as of 28Mar& #39;20
b. Cumulative number of cases and Fatality as a % of that (with a 1 week moving avg trendline).
[Raw data source: http://worldometers.info"> http://worldometers.info ]
a. Raw data showing count of new cases and deceased as of 28Mar& #39;20
b. Cumulative number of cases and Fatality as a % of that (with a 1 week moving avg trendline).
[Raw data source: http://worldometers.info"> http://worldometers.info ]
Dashboard 1.1/3:
Note that based on data source, there are varying cut-off times. I know some dashboards show India at >1000. But I& #39;m sticking to http://worldometers.info"> http://worldometers.info so there is comparability.
Note that based on data source, there are varying cut-off times. I know some dashboards show India at >1000. But I& #39;m sticking to http://worldometers.info"> http://worldometers.info so there is comparability.
India-specific Covid-19 dashboard 2/3:
a. Growth rate on a Logarithmic scale (how fast are we doubling?)
b. How do we compare with rest of the world since Patient #100?
a. Growth rate on a Logarithmic scale (how fast are we doubling?)
b. How do we compare with rest of the world since Patient #100?
India-specific Covid-19 dashboard 3/3:
Growth Factor trend (If today& #39;s count is consistently > yesterday& #39;s we are growing; If it is equal, we are plateauing; If <1 and decreasing, good sign!)
a. India is still going up and down; Slight upward trend
b. World&USA are trending down
Growth Factor trend (If today& #39;s count is consistently > yesterday& #39;s we are growing; If it is equal, we are plateauing; If <1 and decreasing, good sign!)
a. India is still going up and down; Slight upward trend
b. World&USA are trending down
My India-specific Covid-19 dashboard for day ending 28Mar& #39;20 [1/3]:
a. Raw data showing count of new cases, new recoveries, new fatalities
b. Cumulative number of active cases. And Recovery% Fatality% (1 week moving avg trendline).
[Data Source http://worldometers.info"> http://worldometers.info ]
a. Raw data showing count of new cases, new recoveries, new fatalities
b. Cumulative number of active cases. And Recovery% Fatality% (1 week moving avg trendline).
[Data Source http://worldometers.info"> http://worldometers.info ]
India-specific Covid-19 dashboard [1.1/3]:
The Recovery Trend is falling and Fatality Trend is rising.
The Recovery Trend is falling and Fatality Trend is rising.
India-specific Covid-19 dashboard 2/3:
a. Growth rate on a Logarithmic scale (how fast are we doubling?)
b. How do we compare with rest of the world since Patient #100?
India is somewhere between Japan and SKorea. Can we hold to that trend?
a. Growth rate on a Logarithmic scale (how fast are we doubling?)
b. How do we compare with rest of the world since Patient #100?
India is somewhere between Japan and SKorea. Can we hold to that trend?
India-specific Covid-19 dashboard 3/3:
Growth Factor trend (If today& #39;s count is consistently > yesterday& #39;s we are growing; If it is equal, we are plateauing; If <1 and decreasing, good sign!)
a. India is still going up and down; Slight upward trend
b. World&USA are trending down
Growth Factor trend (If today& #39;s count is consistently > yesterday& #39;s we are growing; If it is equal, we are plateauing; If <1 and decreasing, good sign!)
a. India is still going up and down; Slight upward trend
b. World&USA are trending down
India-specific Covid-19 dashboard 3.1/3:
Heartening data points from the Growth Factor trends. India recorded 2 continuous days of <1.0. The World and USA data also showed <1.0 yesterday.
Heartening data points from the Growth Factor trends. India recorded 2 continuous days of <1.0. The World and USA data also showed <1.0 yesterday.
Covid-19: Country-wise fatality rates ..
https://twitter.com/ShamikaRavi/status/1244606489706160130">https://twitter.com/ShamikaRa... https://twitter.com/shamikaravi/status/1244606489706160130">https://twitter.com/shamikara...
https://twitter.com/ShamikaRavi/status/1244606489706160130">https://twitter.com/ShamikaRa... https://twitter.com/shamikaravi/status/1244606489706160130">https://twitter.com/shamikara...
And not only does Italy top this table, they have actually under-counted!
(HT @AditiRamakrish1)
https://twitter.com/rmfifthcircuit/status/1244352056326066183?s=21">https://twitter.com/rmfifthci... https://twitter.com/rmfifthcircuit/status/1244352056326066183">https://twitter.com/rmfifthci...
(HT @AditiRamakrish1)
https://twitter.com/rmfifthcircuit/status/1244352056326066183?s=21">https://twitter.com/rmfifthci... https://twitter.com/rmfifthcircuit/status/1244352056326066183">https://twitter.com/rmfifthci...
My India-specific Covid-19 dashboard for day ending 30Mar& #39;20 [1/11]:
a. Raw data showing count of new cases, new recoveries, new fatalities
b. Cumulative number of active cases. And Recovery% Fatality% (1 week moving avg trendline).
[Data Source http://worldometers.info"> http://worldometers.info ]
a. Raw data showing count of new cases, new recoveries, new fatalities
b. Cumulative number of active cases. And Recovery% Fatality% (1 week moving avg trendline).
[Data Source http://worldometers.info"> http://worldometers.info ]
2/11:
There was a sharp increase in the new cases yesterday.
The 1-week moving average of Recoveries is ~8% and seems to be trending up. But too early to tell.
The 1-week moving average of Fatalities is climbing towards 3%. Note that the world average is closer to 2%. Not good.
There was a sharp increase in the new cases yesterday.
The 1-week moving average of Recoveries is ~8% and seems to be trending up. But too early to tell.
The 1-week moving average of Fatalities is climbing towards 3%. Note that the world average is closer to 2%. Not good.
India-specific Covid-19 dashboard 3/11:
a. Growth rate on a Logarithmic scale (how fast are we doubling?)
b. How do we compare with rest of the world since Patient #100? India is somewhere between Japan and SKorea. Can we hold to that trend?
a. Growth rate on a Logarithmic scale (how fast are we doubling?)
b. How do we compare with rest of the world since Patient #100? India is somewhere between Japan and SKorea. Can we hold to that trend?
4/11:
Growth Factor trend (If today& #39;s count is consistently > yesterday& #39;s we are growing; If it is equal, we are plateauing; If <1 and decreasing, good sign!)
a. India: Yesterday& #39;s sharp increase has caused a worrying upward trend.
b. World&USA are trending down.
Growth Factor trend (If today& #39;s count is consistently > yesterday& #39;s we are growing; If it is equal, we are plateauing; If <1 and decreasing, good sign!)
a. India: Yesterday& #39;s sharp increase has caused a worrying upward trend.
b. World&USA are trending down.
5/11:
The uptick in Growth Factor is a HUGE cause for worry. India is virtually at the 1-week mark since "Janata curfew" and lockdown. And the moving avg of GF is at 2.
We HAVE flatten the curve beginning now. The GF has to be brought down to 1 very soon, and sustained there.
The uptick in Growth Factor is a HUGE cause for worry. India is virtually at the 1-week mark since "Janata curfew" and lockdown. And the moving avg of GF is at 2.
We HAVE flatten the curve beginning now. The GF has to be brought down to 1 very soon, and sustained there.
6/11:
If we don& #39;t make the lockdown work and Growth Factor remains 2, by 15Apr there& #39;ll be a surge - upto 7 Million infected! Even at 2.5% fatality, that& #39;s ~200k. And at recovery rate of only 8%, we& #39;ll have 6.5M active cases, a large number of whom will need hospitalisation.
If we don& #39;t make the lockdown work and Growth Factor remains 2, by 15Apr there& #39;ll be a surge - upto 7 Million infected! Even at 2.5% fatality, that& #39;s ~200k. And at recovery rate of only 8%, we& #39;ll have 6.5M active cases, a large number of whom will need hospitalisation.
7/11:
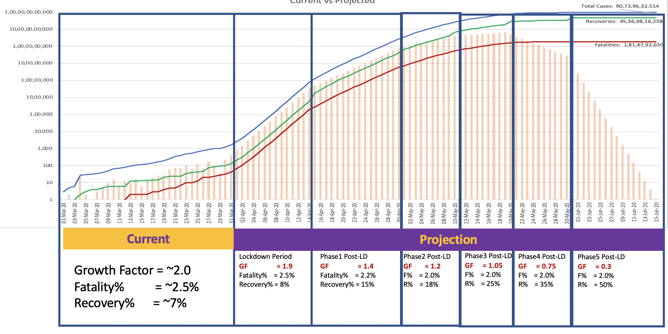
To visualize this frightening scenario, check this projection. The foreseeable future is split into 6 phases, and a slowly reducing Growth Factor, a slowly reducing fatality rate, and a nominal recovery rate are assumed.
We could hit 900Million infections, 18M fatalities.
To visualize this frightening scenario, check this projection. The foreseeable future is split into 6 phases, and a slowly reducing Growth Factor, a slowly reducing fatality rate, and a nominal recovery rate are assumed.
We could hit 900Million infections, 18M fatalities.
8/11:
I& #39;m hoping though, that we& #39;ll end up closer to the projection below. With a rapid reduction assumed during the lockdown, we can pull in the peak daily infections to end-Apr. Even then we may end up with 6 Million infections and 100k+ fatalities.
I& #39;m hoping though, that we& #39;ll end up closer to the projection below. With a rapid reduction assumed during the lockdown, we can pull in the peak daily infections to end-Apr. Even then we may end up with 6 Million infections and 100k+ fatalities.
9/11:
Of course, these are all just assumptions and a simplistic model. In reality, there are many factors at play. From low rate of testing to the stupid behaviour of politicians who cause panic migrations or allow religious congregations - a whole gamut of factors.
Of course, these are all just assumptions and a simplistic model. In reality, there are many factors at play. From low rate of testing to the stupid behaviour of politicians who cause panic migrations or allow religious congregations - a whole gamut of factors.
11/11:
Sorry for sounding alarmist. The idea is not to cause panic. The idea is to back-up the original message in this thread with some data: STAY AT HOME. MAKE THE LOCKDOWN WORK. FLATTEN THE CURVE.
Sorry for sounding alarmist. The idea is not to cause panic. The idea is to back-up the original message in this thread with some data: STAY AT HOME. MAKE THE LOCKDOWN WORK. FLATTEN THE CURVE.
My India-specific Covid-19 dashboard for day ending 31Mar& #39;20 [1/5]:
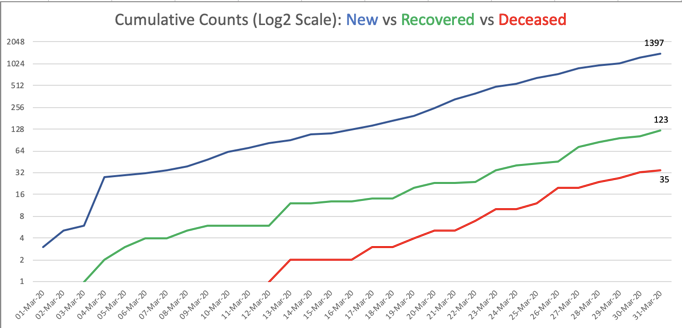
a. Raw data showing count of new cases, new recoveries, new fatalities
b. Cumulative number of active cases. And Recovery% Fatality% (1 week moving avg trendline).
[Data Source http://worldometers.info"> http://worldometers.info ]
a. Raw data showing count of new cases, new recoveries, new fatalities
b. Cumulative number of active cases. And Recovery% Fatality% (1 week moving avg trendline).
[Data Source http://worldometers.info"> http://worldometers.info ]
India-specific Covid-19 dashboard [2.1/5]:
The sharp increase seen on 30Mar is hopefully a non-recurring event. Yesterday& #39;s new cases is high too, but at least in line with the trend of the past one week.
The sharp increase seen on 30Mar is hopefully a non-recurring event. Yesterday& #39;s new cases is high too, but at least in line with the trend of the past one week.
India-specific Covid-19 dashboard [2.2/5]:
The 1-week moving average of Recoveries is ~8% and continues upward trend.
The 1-week moving average of Fatalities seems to be stabilising ~3%. For reference, USA is ~2%, the world ~5%.
The 1-week moving average of Recoveries is ~8% and continues upward trend.
The 1-week moving average of Fatalities seems to be stabilising ~3%. For reference, USA is ~2%, the world ~5%.
India-specific Covid-19 dashboard 3/5:
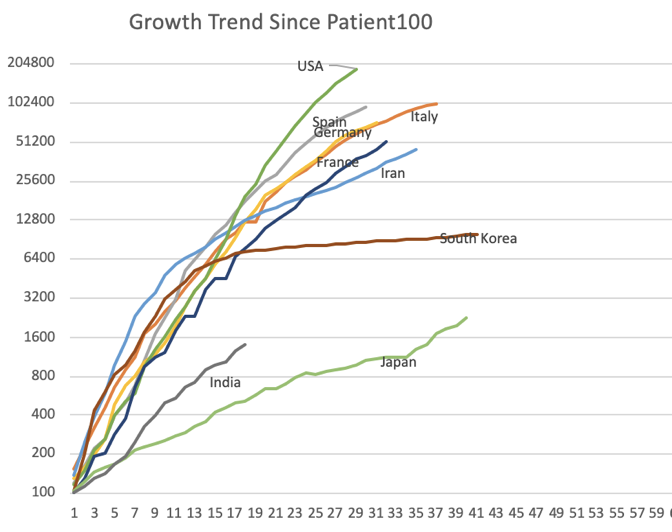
a. Growth rate on a Logarithmic scale (how fast are we doubling?)
b. How do we compare with rest of the world since Patient #100? India continues to be between Japan and SKorea. Can we hold to that trend?
a. Growth rate on a Logarithmic scale (how fast are we doubling?)
b. How do we compare with rest of the world since Patient #100? India continues to be between Japan and SKorea. Can we hold to that trend?
4/5:
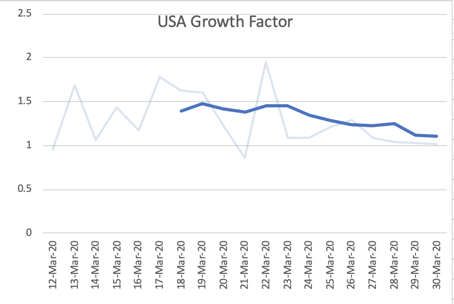
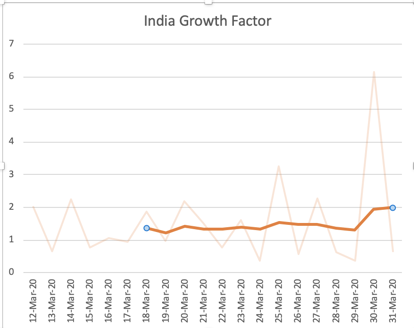
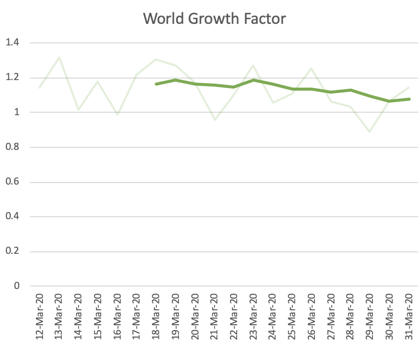
Growth Factor trend (If today& #39;s count is consistently > yesterday& #39;s we& #39;re growing; If equal,we& #39;re plateauing; If <1 and decreasing, good!)
a. India is still going up&down; the sharp increase on 30Mar has caused a worrying upward trend.
b. World+USA continue downward trend
Growth Factor trend (If today& #39;s count is consistently > yesterday& #39;s we& #39;re growing; If equal,we& #39;re plateauing; If <1 and decreasing, good!)
a. India is still going up&down; the sharp increase on 30Mar has caused a worrying upward trend.
b. World+USA continue downward trend
5/5:
Why we should act NOW to flatten the curve. If we don& #39;t reduce rate of new infections during the lockdown period, it is going to be a long hard summer.
Projections based on current growth trends and some modelled future number is cause for alarm:
Why we should act NOW to flatten the curve. If we don& #39;t reduce rate of new infections during the lockdown period, it is going to be a long hard summer.
Projections based on current growth trends and some modelled future number is cause for alarm:
My India-specific Covid-19 dashboard for day ending 1Apr& #39;20 [1/5]:
a. Raw data showing count of new cases, new recoveries, new fatalities
b. Cumulative number of active cases. And Recovery% Fatality% (1 week moving avg trendline).
[Data Source http://worldometers.info"> http://worldometers.info ]
a. Raw data showing count of new cases, new recoveries, new fatalities
b. Cumulative number of active cases. And Recovery% Fatality% (1 week moving avg trendline).
[Data Source http://worldometers.info"> http://worldometers.info ]
India-specific Covid-19 dashboard [2.1/5]:
Hopes belied by the MASSIVE increase in new cases yesterday. If the incr on 30Mar was high, yesterday& #39;s was a whopper. It is tragic that pockets of India& #39;s population plays havoc with the country strategy to fight the pandemic.
Hopes belied by the MASSIVE increase in new cases yesterday. If the incr on 30Mar was high, yesterday& #39;s was a whopper. It is tragic that pockets of India& #39;s population plays havoc with the country strategy to fight the pandemic.
India-specific Covid-19 dashboard [2.2/5]:
The 1-week moving average of Recoveries is inching towards 9% and continues upward trend.
The 1-week moving average of Fatalities seems to be stabilizing ~3%. (for ref, USA is ~2%, world ~5%), and we& #39;re moving in the wrong direction.
The 1-week moving average of Recoveries is inching towards 9% and continues upward trend.
The 1-week moving average of Fatalities seems to be stabilizing ~3%. (for ref, USA is ~2%, world ~5%), and we& #39;re moving in the wrong direction.
3/5:
a. Growth rate on a Logarithmic scale (how fast are we doubling?). The uptick due to yesterday& #39;s surge shows even on a log scale.
b. How do we compare with rest of the world since Patient #100? We& #39;re still in the "good" SKorea+Japan club, but a clear trend upwards.
a. Growth rate on a Logarithmic scale (how fast are we doubling?). The uptick due to yesterday& #39;s surge shows even on a log scale.
b. How do we compare with rest of the world since Patient #100? We& #39;re still in the "good" SKorea+Japan club, but a clear trend upwards.
4.1/5:
Growth Factor (or "Reproductive Rate" or R0 as some papers call it) .. what is it?
Essentially, it is today& #39;s count divided by yesterday& #39;s.
If today& #39;s count is consistently > yesterday& #39;s we& #39;re growing.
If equal, we& #39;re plateauing.
If <1 and decreasing, good sign!
Growth Factor (or "Reproductive Rate" or R0 as some papers call it) .. what is it?
Essentially, it is today& #39;s count divided by yesterday& #39;s.
If today& #39;s count is consistently > yesterday& #39;s we& #39;re growing.
If equal, we& #39;re plateauing.
If <1 and decreasing, good sign!
4.2/5:
On 31Mar, India& #39;s GF was a worrying 6+, but it was on a base of 37 infections. Yesterday& #39;s GF was 4, and it was on a base of 146, yielding 600 new cases!
Going forward, we have to stomach larger and larger new cases unless we act true to the purpose of the lockdown.
On 31Mar, India& #39;s GF was a worrying 6+, but it was on a base of 37 infections. Yesterday& #39;s GF was 4, and it was on a base of 146, yielding 600 new cases!
Going forward, we have to stomach larger and larger new cases unless we act true to the purpose of the lockdown.
4.3/5:
Today, India& #39;s GF moving average is over 2. Just imagine for moment that things don& #39;t change. We& #39;ll then be looking at 1200 new cases today, 2400 tomorrow.
I hope we& #39;ll bring GF firmly down to ~1.0 by the time the lockdown ends - ie., "flatten the curve" by mid-Apr.
Today, India& #39;s GF moving average is over 2. Just imagine for moment that things don& #39;t change. We& #39;ll then be looking at 1200 new cases today, 2400 tomorrow.
I hope we& #39;ll bring GF firmly down to ~1.0 by the time the lockdown ends - ie., "flatten the curve" by mid-Apr.
5/5:
Finally, do this excellent thread on the containment strategy followed by Japan. Lots of parallels in India (esp focused testing unlike SKorea& #39;s widespread testing). But as always, our implementation is fraught with uncooperative citizens. https://twitter.com/YukaKoshino/status/1245476737707921408">https://twitter.com/YukaKoshi...
Finally, do this excellent thread on the containment strategy followed by Japan. Lots of parallels in India (esp focused testing unlike SKorea& #39;s widespread testing). But as always, our implementation is fraught with uncooperative citizens. https://twitter.com/YukaKoshino/status/1245476737707921408">https://twitter.com/YukaKoshi...

 Read on Twitter


![My India-specific Covid-19 dashboard: (1/3)a. Raw data showing count of new cases and deceased as of 27Mar& #39;20b. Cumulative number of cases and Fatality as a % of that (with a 2 week moving avg trendline). We are currently at slightly <2%.[Source: http://worldometers.info ] My India-specific Covid-19 dashboard: (1/3)a. Raw data showing count of new cases and deceased as of 27Mar& #39;20b. Cumulative number of cases and Fatality as a % of that (with a 2 week moving avg trendline). We are currently at slightly <2%.[Source: http://worldometers.info ]](https://pbs.twimg.com/media/EUK2im1VAAExXfT.png)
![My India-specific Covid-19 dashboard: (1/3)a. Raw data showing count of new cases and deceased as of 27Mar& #39;20b. Cumulative number of cases and Fatality as a % of that (with a 2 week moving avg trendline). We are currently at slightly <2%.[Source: http://worldometers.info ] My India-specific Covid-19 dashboard: (1/3)a. Raw data showing count of new cases and deceased as of 27Mar& #39;20b. Cumulative number of cases and Fatality as a % of that (with a 2 week moving avg trendline). We are currently at slightly <2%.[Source: http://worldometers.info ]](https://pbs.twimg.com/media/EUK2mcPUcAE9Z3A.png)


![My India-specific Covid-19 dashboard 1/3:a. Raw data showing count of new cases and deceased as of 28Mar& #39;20b. Cumulative number of cases and Fatality as a % of that (with a 1 week moving avg trendline).[Raw data source: http://worldometers.info ] My India-specific Covid-19 dashboard 1/3:a. Raw data showing count of new cases and deceased as of 28Mar& #39;20b. Cumulative number of cases and Fatality as a % of that (with a 1 week moving avg trendline).[Raw data source: http://worldometers.info ]](https://pbs.twimg.com/media/EUP7-brU4AEVuEZ.png)
![My India-specific Covid-19 dashboard 1/3:a. Raw data showing count of new cases and deceased as of 28Mar& #39;20b. Cumulative number of cases and Fatality as a % of that (with a 1 week moving avg trendline).[Raw data source: http://worldometers.info ] My India-specific Covid-19 dashboard 1/3:a. Raw data showing count of new cases and deceased as of 28Mar& #39;20b. Cumulative number of cases and Fatality as a % of that (with a 1 week moving avg trendline).[Raw data source: http://worldometers.info ]](https://pbs.twimg.com/media/EUP8K-lUUAEXQv_.jpg)
![My India-specific Covid-19 dashboard for day ending 28Mar& #39;20 [1/3]:a. Raw data showing count of new cases, new recoveries, new fatalitiesb. Cumulative number of active cases. And Recovery% Fatality% (1 week moving avg trendline).[Data Source http://worldometers.info ] My India-specific Covid-19 dashboard for day ending 28Mar& #39;20 [1/3]:a. Raw data showing count of new cases, new recoveries, new fatalitiesb. Cumulative number of active cases. And Recovery% Fatality% (1 week moving avg trendline).[Data Source http://worldometers.info ]](https://pbs.twimg.com/media/EUVUlhOUEAY0ii6.jpg)
![My India-specific Covid-19 dashboard for day ending 28Mar& #39;20 [1/3]:a. Raw data showing count of new cases, new recoveries, new fatalitiesb. Cumulative number of active cases. And Recovery% Fatality% (1 week moving avg trendline).[Data Source http://worldometers.info ] My India-specific Covid-19 dashboard for day ending 28Mar& #39;20 [1/3]:a. Raw data showing count of new cases, new recoveries, new fatalitiesb. Cumulative number of active cases. And Recovery% Fatality% (1 week moving avg trendline).[Data Source http://worldometers.info ]](https://pbs.twimg.com/media/EUVUtFbUcAEeXqY.jpg)


![My India-specific Covid-19 dashboard for day ending 30Mar& #39;20 [1/11]:a. Raw data showing count of new cases, new recoveries, new fatalitiesb. Cumulative number of active cases. And Recovery% Fatality% (1 week moving avg trendline).[Data Source http://worldometers.info ] My India-specific Covid-19 dashboard for day ending 30Mar& #39;20 [1/11]:a. Raw data showing count of new cases, new recoveries, new fatalitiesb. Cumulative number of active cases. And Recovery% Fatality% (1 week moving avg trendline).[Data Source http://worldometers.info ]](https://pbs.twimg.com/media/EUcHi1LUcAIRt7P.jpg)
![My India-specific Covid-19 dashboard for day ending 30Mar& #39;20 [1/11]:a. Raw data showing count of new cases, new recoveries, new fatalitiesb. Cumulative number of active cases. And Recovery% Fatality% (1 week moving avg trendline).[Data Source http://worldometers.info ] My India-specific Covid-19 dashboard for day ending 30Mar& #39;20 [1/11]:a. Raw data showing count of new cases, new recoveries, new fatalitiesb. Cumulative number of active cases. And Recovery% Fatality% (1 week moving avg trendline).[Data Source http://worldometers.info ]](https://pbs.twimg.com/media/EUcHn5UUUAMg5ng.jpg)



![My India-specific Covid-19 dashboard for day ending 31Mar& #39;20 [1/5]:a. Raw data showing count of new cases, new recoveries, new fatalitiesb. Cumulative number of active cases. And Recovery% Fatality% (1 week moving avg trendline).[Data Source http://worldometers.info ] My India-specific Covid-19 dashboard for day ending 31Mar& #39;20 [1/5]:a. Raw data showing count of new cases, new recoveries, new fatalitiesb. Cumulative number of active cases. And Recovery% Fatality% (1 week moving avg trendline).[Data Source http://worldometers.info ]](https://pbs.twimg.com/media/EUfxUxZUUAETzlk.jpg)
![My India-specific Covid-19 dashboard for day ending 31Mar& #39;20 [1/5]:a. Raw data showing count of new cases, new recoveries, new fatalitiesb. Cumulative number of active cases. And Recovery% Fatality% (1 week moving avg trendline).[Data Source http://worldometers.info ] My India-specific Covid-19 dashboard for day ending 31Mar& #39;20 [1/5]:a. Raw data showing count of new cases, new recoveries, new fatalitiesb. Cumulative number of active cases. And Recovery% Fatality% (1 week moving avg trendline).[Data Source http://worldometers.info ]](https://pbs.twimg.com/media/EUfxX2cU0AAUuFn.jpg)

![My India-specific Covid-19 dashboard for day ending 1Apr& #39;20 [1/5]:a. Raw data showing count of new cases, new recoveries, new fatalitiesb. Cumulative number of active cases. And Recovery% Fatality% (1 week moving avg trendline).[Data Source http://worldometers.info ] My India-specific Covid-19 dashboard for day ending 1Apr& #39;20 [1/5]:a. Raw data showing count of new cases, new recoveries, new fatalitiesb. Cumulative number of active cases. And Recovery% Fatality% (1 week moving avg trendline).[Data Source http://worldometers.info ]](https://pbs.twimg.com/media/EUmDhPuUMAYctcm.png)
![My India-specific Covid-19 dashboard for day ending 1Apr& #39;20 [1/5]:a. Raw data showing count of new cases, new recoveries, new fatalitiesb. Cumulative number of active cases. And Recovery% Fatality% (1 week moving avg trendline).[Data Source http://worldometers.info ] My India-specific Covid-19 dashboard for day ending 1Apr& #39;20 [1/5]:a. Raw data showing count of new cases, new recoveries, new fatalitiesb. Cumulative number of active cases. And Recovery% Fatality% (1 week moving avg trendline).[Data Source http://worldometers.info ]](https://pbs.twimg.com/media/EUmDitGUUAAog80.png)
