Lot of queries on why I picked ITC on deliveries. Here is the analysis thru COI. I teach this at my workshops, but if you guys can benefit ,here it is for free.
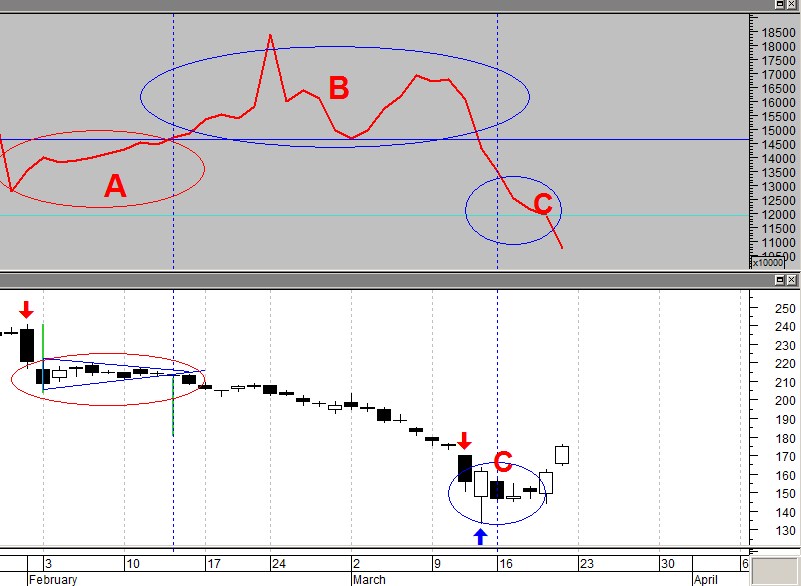
Watch the chart below, COI ( cumulative OI) on upper pane
Watch the chart below, COI ( cumulative OI) on upper pane
1. Massive buildup on OI from starting early Nov& #39;19
2. The crack comes on budget day
3. COI continues to rise fast post budget within a narrow trading range ( this is where I started shorting and warning) ( Zone A)
2. The crack comes on budget day
3. COI continues to rise fast post budget within a narrow trading range ( this is where I started shorting and warning) ( Zone A)
4. ITC continues it& #39;s journey down ( Zone B)
Rise in COI + Fall in price = Bearish ( basic analysis of OI)
5. Zone C = COI falls rapidly suggesting the multi-month shorts are getting out of the system
( This is where I get in with deliveries and warn on twitter)
Rise in COI + Fall in price = Bearish ( basic analysis of OI)
5. Zone C = COI falls rapidly suggesting the multi-month shorts are getting out of the system
( This is where I get in with deliveries and warn on twitter)
6. See now the COI down to NOV levels, normal
Now for some points :
1. My style of analysis is reactive to data, not predictive. Hence I cannot give a target on ITC. When data changes, I will get out
Now for some points :
1. My style of analysis is reactive to data, not predictive. Hence I cannot give a target on ITC. When data changes, I will get out
There is another trick to identify whether shorts or longs are winning the battle, but that& #39;s proprietary and hence won& #39;t divulge . Not showing any of my systems for a secondary confirmation or stop.
But this is the crux from where the analysis starts, then it& #39;s fine tuned .
But this is the crux from where the analysis starts, then it& #39;s fine tuned .
Here& #39;s how it looks with a system ( secondary confirmation, this system is quantitative in nature, nothing to do with OI). Hence, the shorts were confirmed from two styles of analysis. Now the longs were also confirmed by both
Last but not the least, OI/COI analysis is an art and not a perfect science. My style I have devised myself on basics

 Read on Twitter


