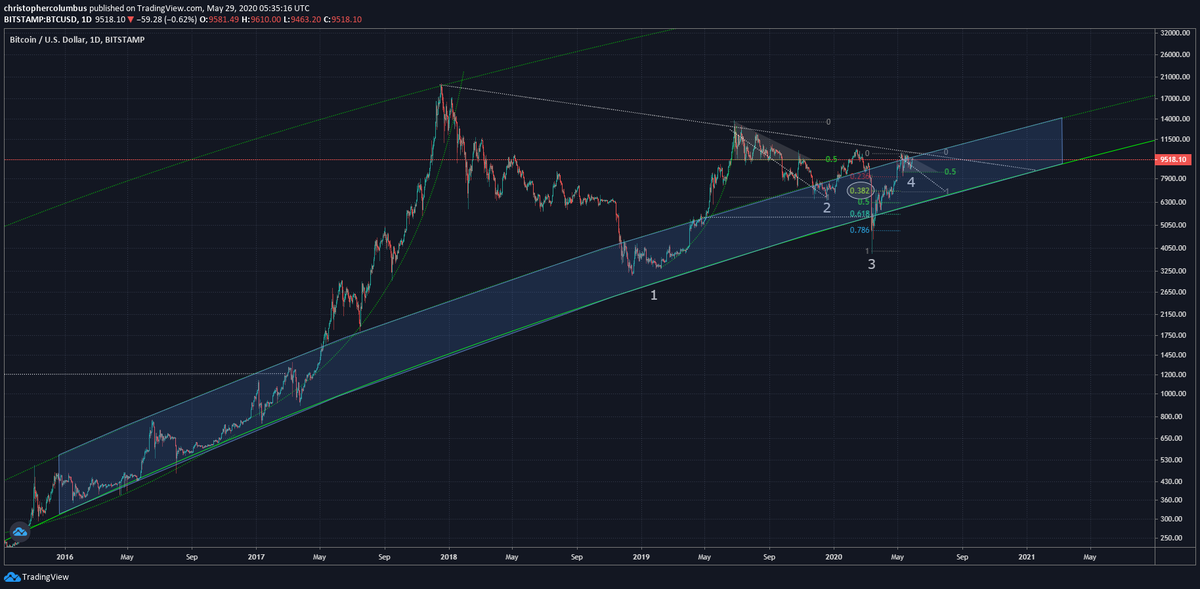
From alts page.
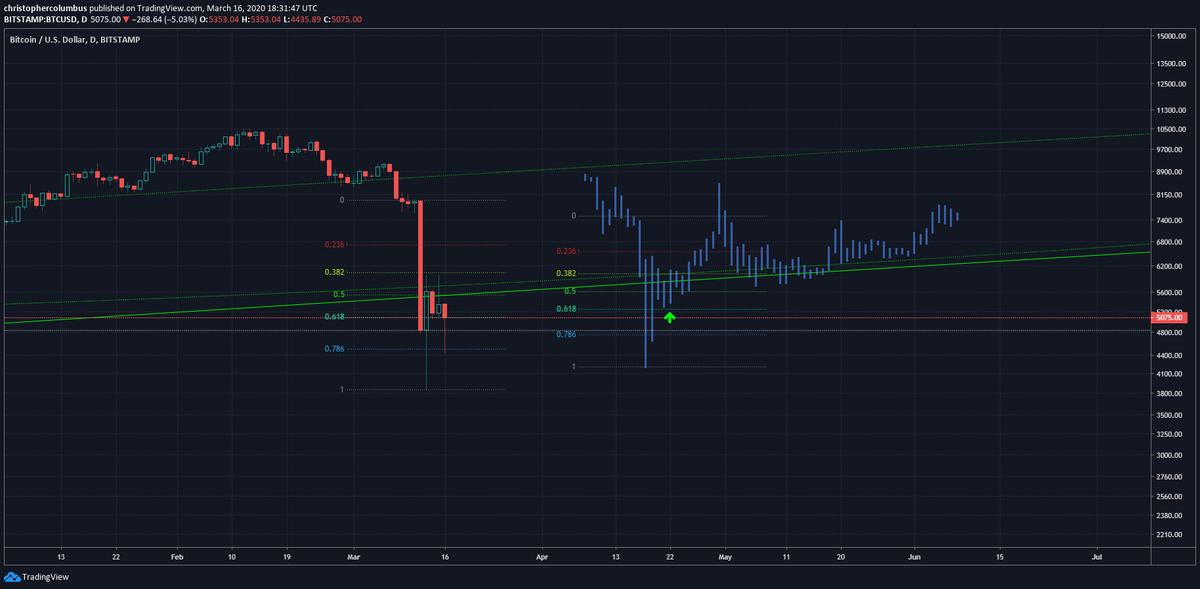
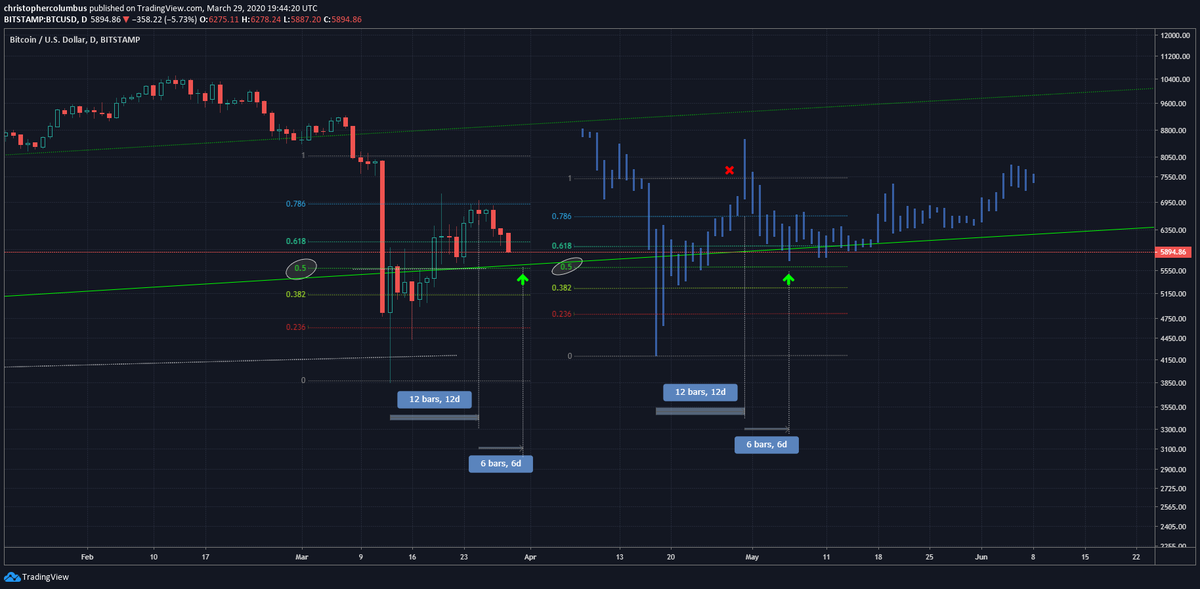
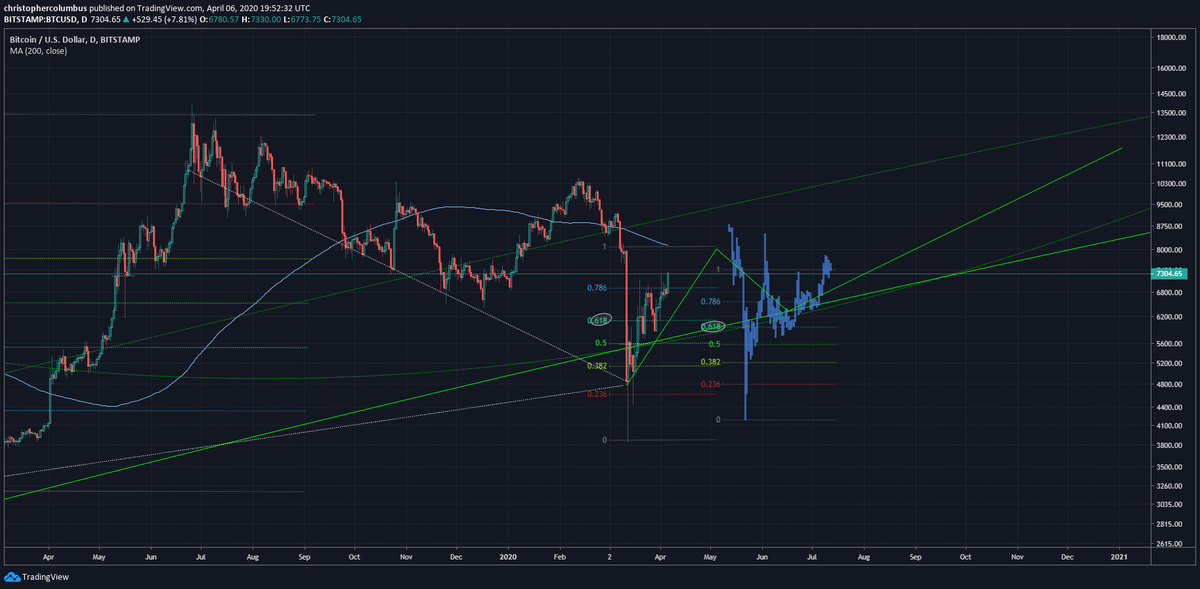
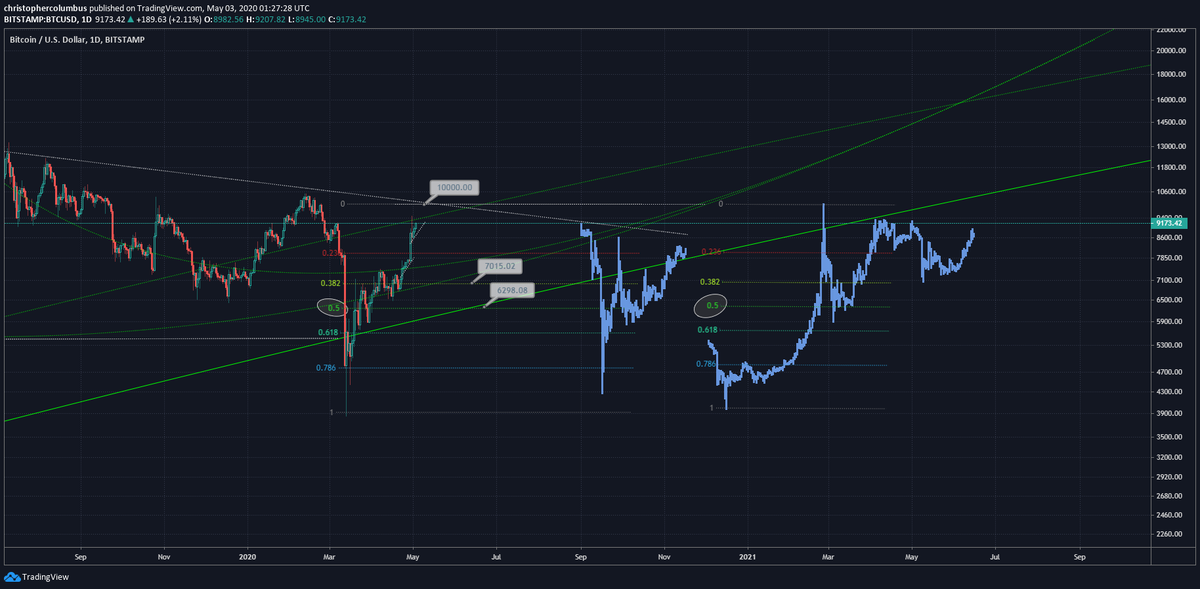
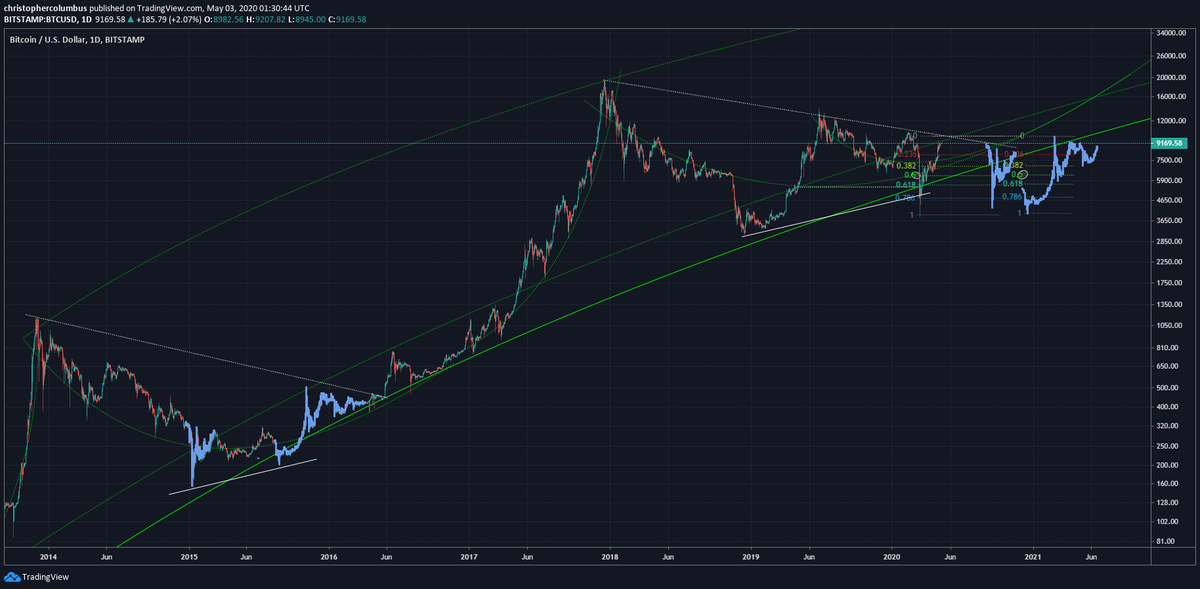
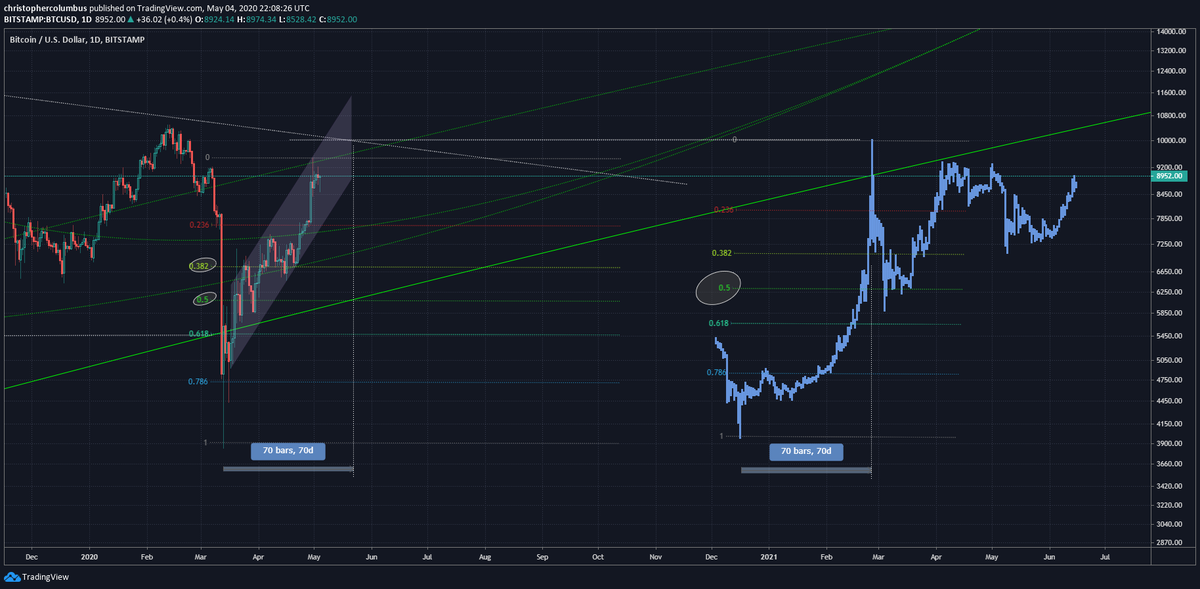
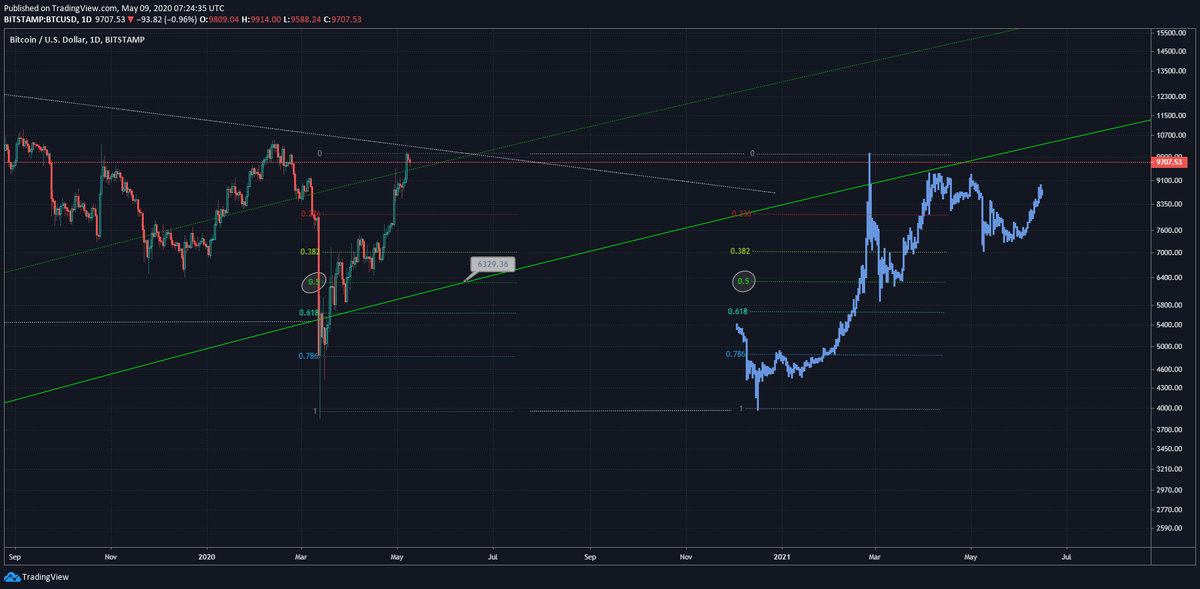
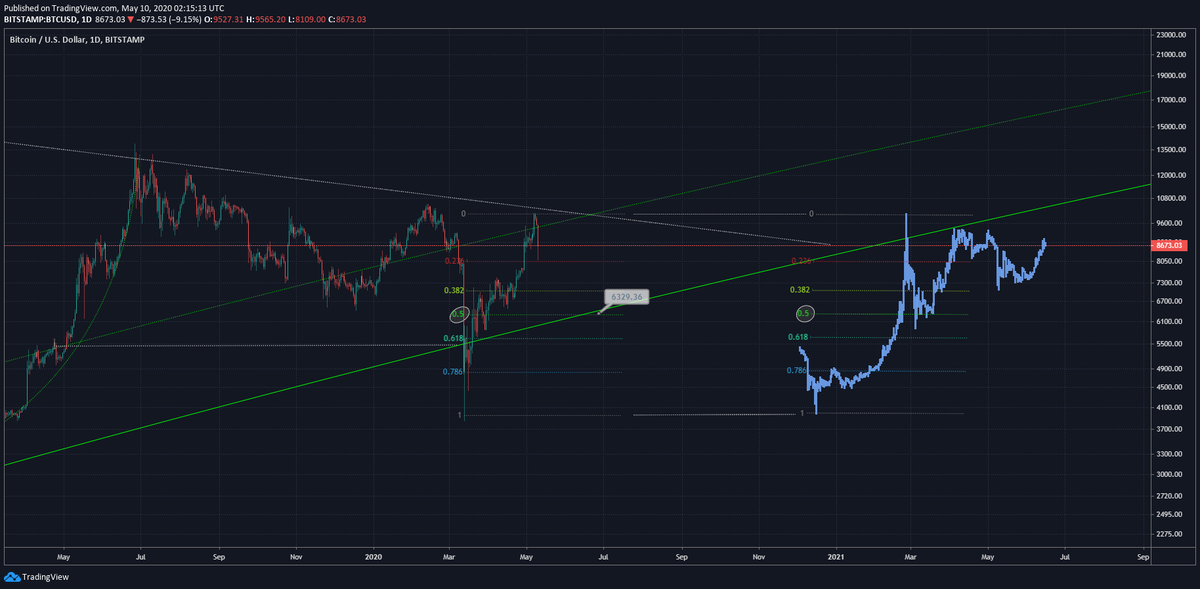
Looking good so far. This chart compares the capitulation of the previous bottom [Jan 2015] to the present one.
Looking good so far. This chart compares the capitulation of the previous bottom [Jan 2015] to the present one.
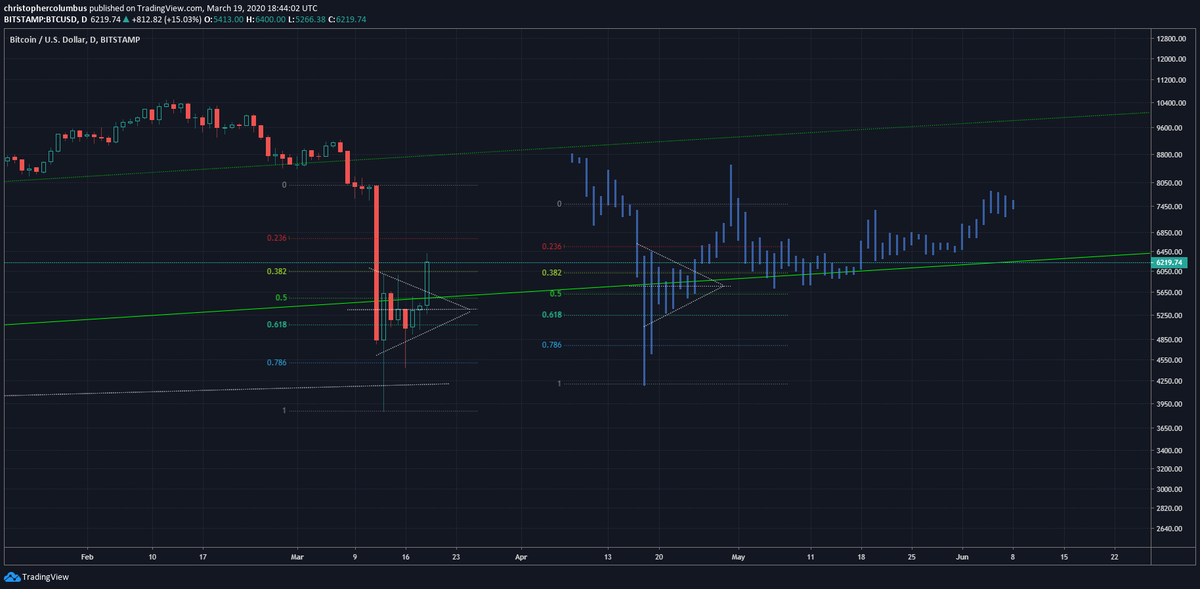
Fractal predicted price would hold yesterday at peak bearishness, and sure enough [from alts page]....
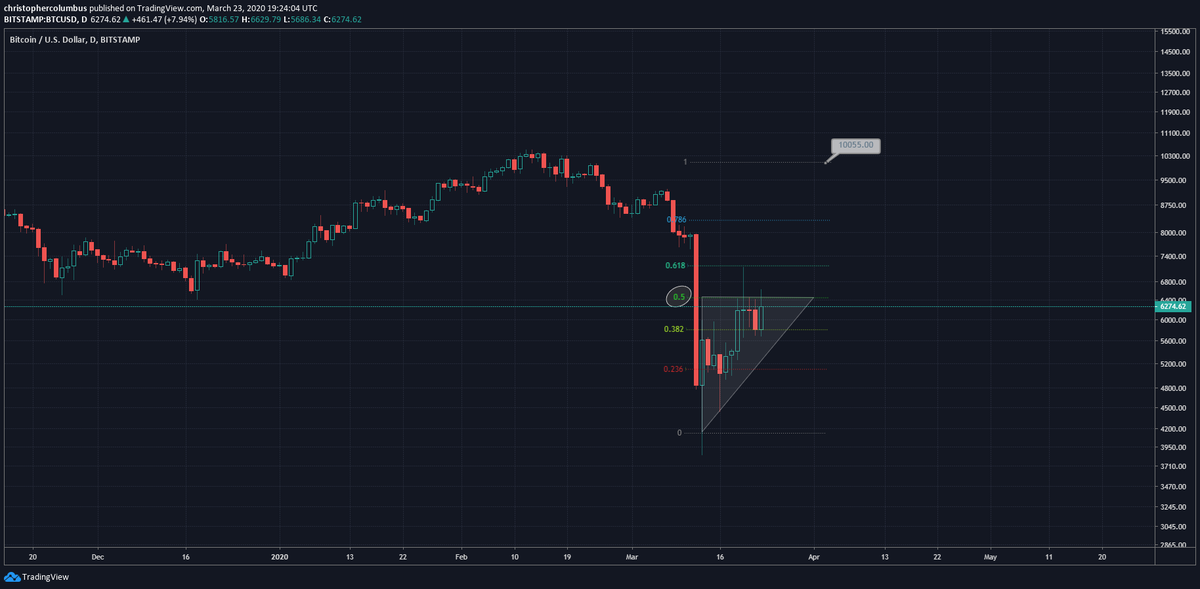
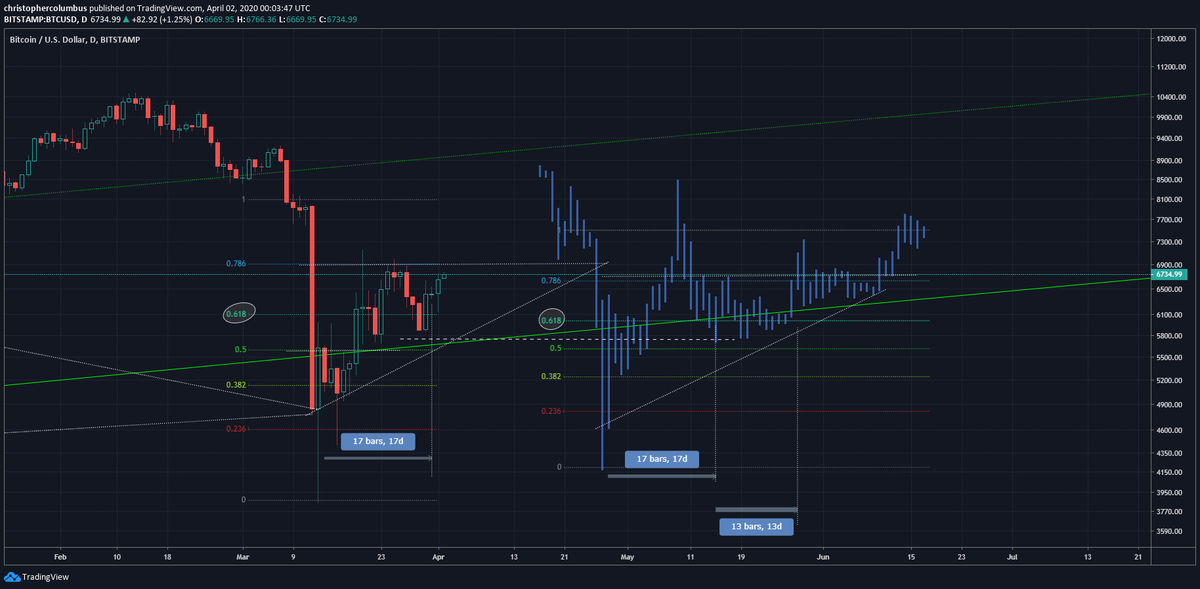
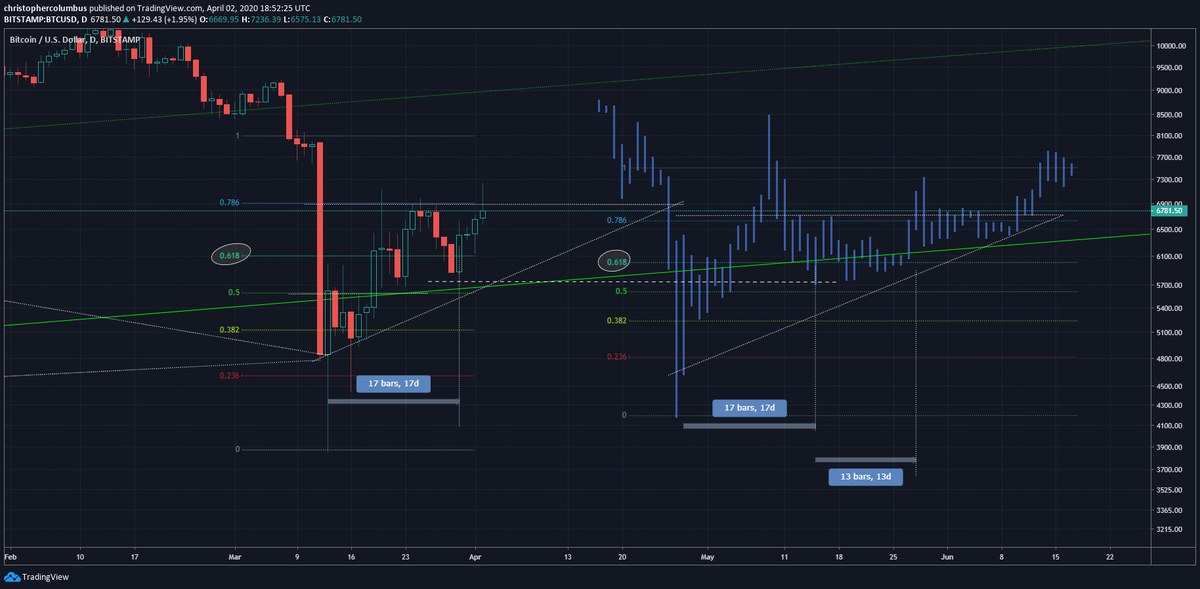
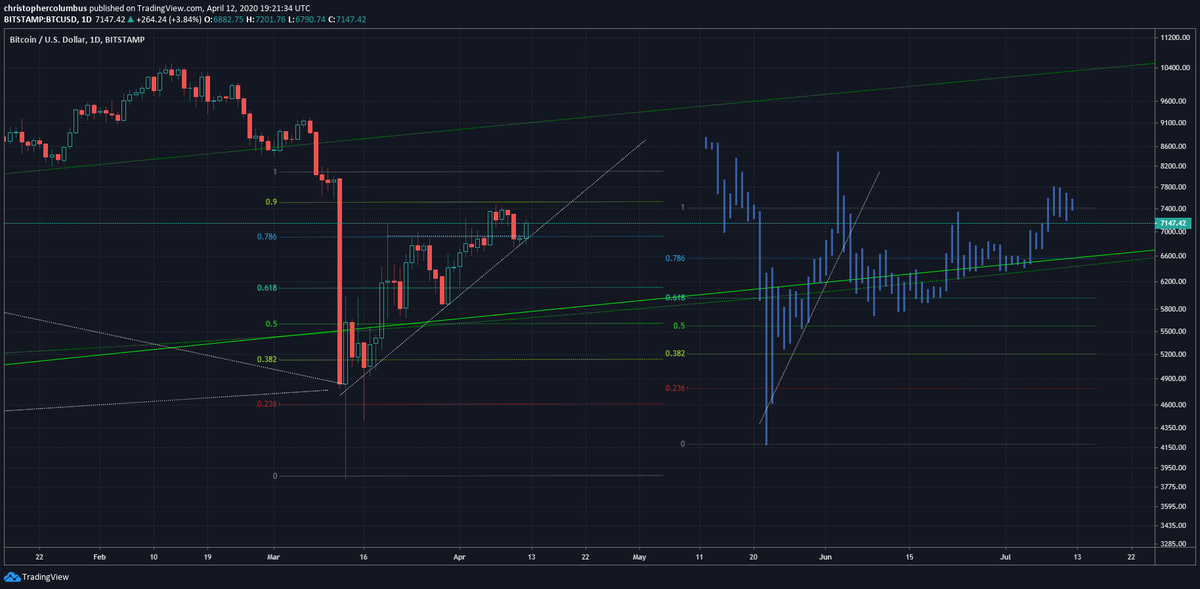
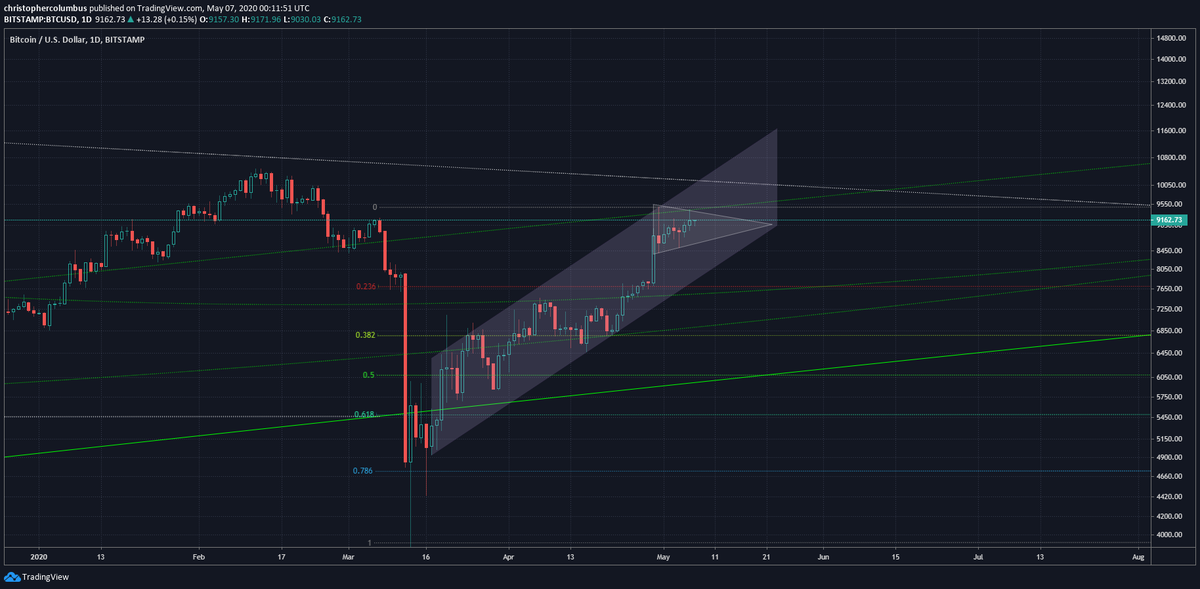
The obvious pattern to draw here is the ascending triangle....
Would a day trade it with leverage? No.
Would I average in if I didn& #39;t already have a position? Yes.
Would a day trade it with leverage? No.
Would I average in if I didn& #39;t already have a position? Yes.
Didn& #39;t get the one day spike. Looking for support at 5.5K.
BTC short term [more speculative]
Thinking price may oscillate around the 0.61 level for a couple of weeks before moving higher...
Thinking price may oscillate around the 0.61 level for a couple of weeks before moving higher...
Three weeks later and the capitulation has retraced 78%... in the top band. Sure, BTC will sell off on a liquidation event [as an asset], but what many are missing is that it is also a desirable currency/ form of liquidity. People will also buy it just as they& #39;d buy USD and gold.
The idea of an ascending triangle further supported here... could involve a bit more time to fully play out though...
Based on my larger macro views, I think price will continue up to the 200 MDA and then correct back to the curve over the following few months. Second half of this year, which I& #39;ve maintained for quite some time, the sustainable cyclical move up along the curve...
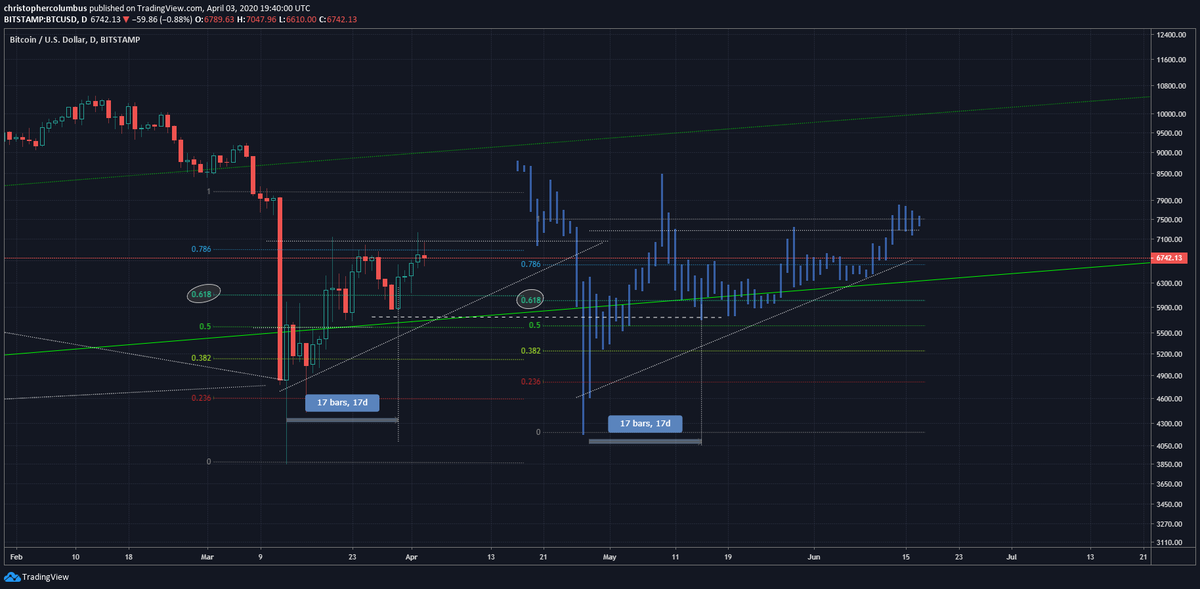
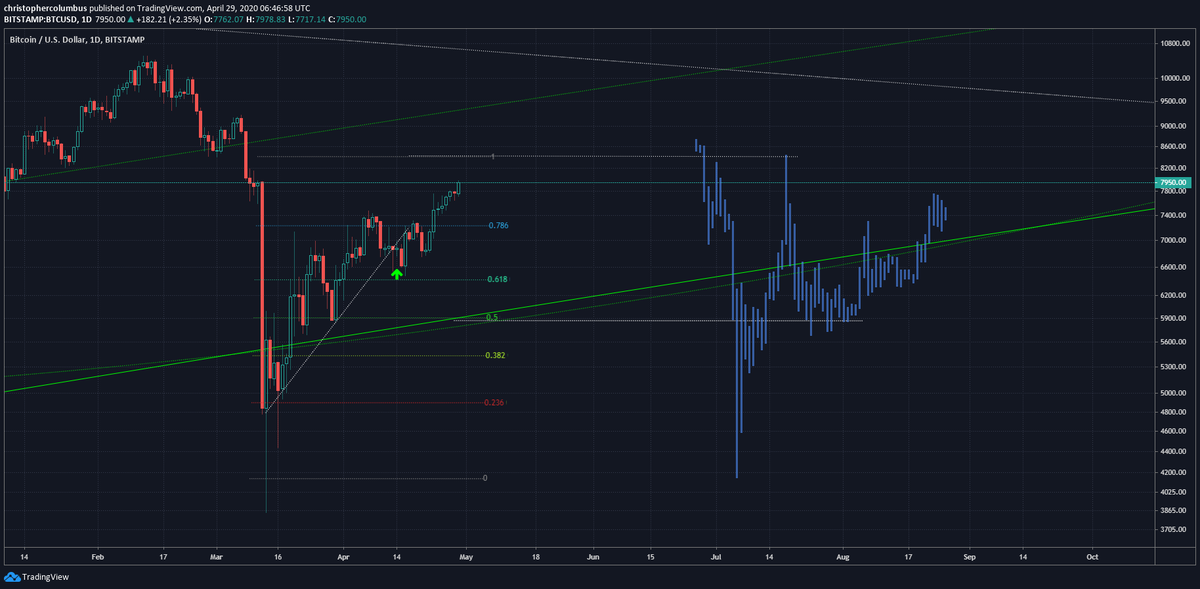
The inevitable short term unpredictability - comparison with a previous capitulation [Jan 2015] still alive...
This fractal has held up for a good month and a half now. Not going to pretend I got it perfectly though questioning it where the arrow& #39;s located. May go a bit higher before the consolidation...
BTC short term
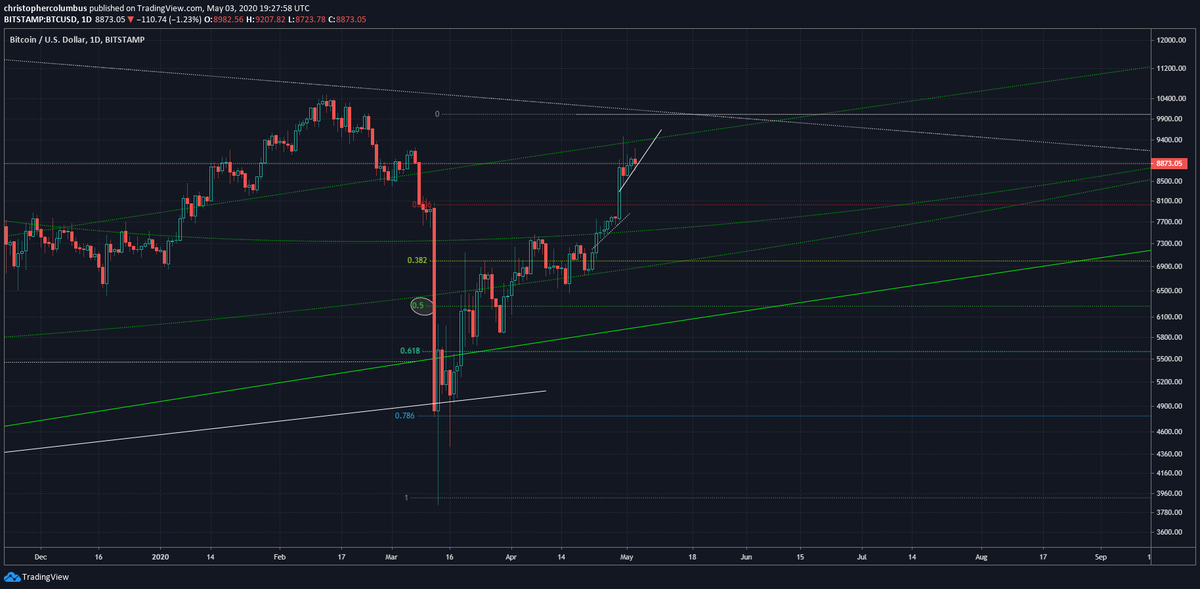
Medium term channel would need to break to near confirm a turnaround. Room for a further spike to 10K odd.
Medium term channel would need to break to near confirm a turnaround. Room for a further spike to 10K odd.
BTC shorter term
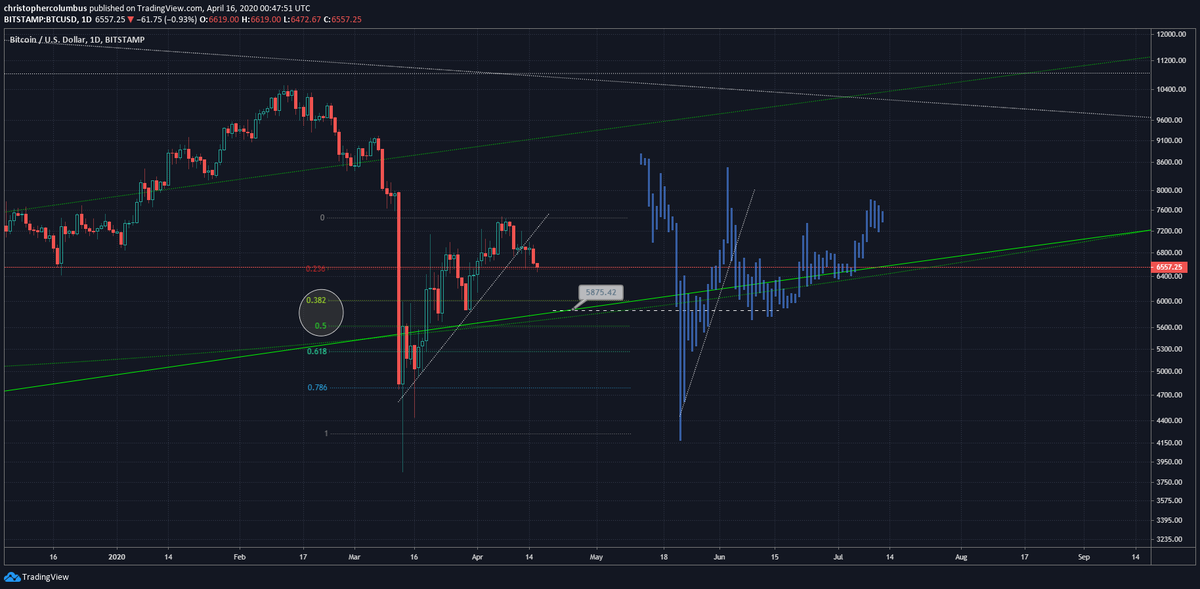
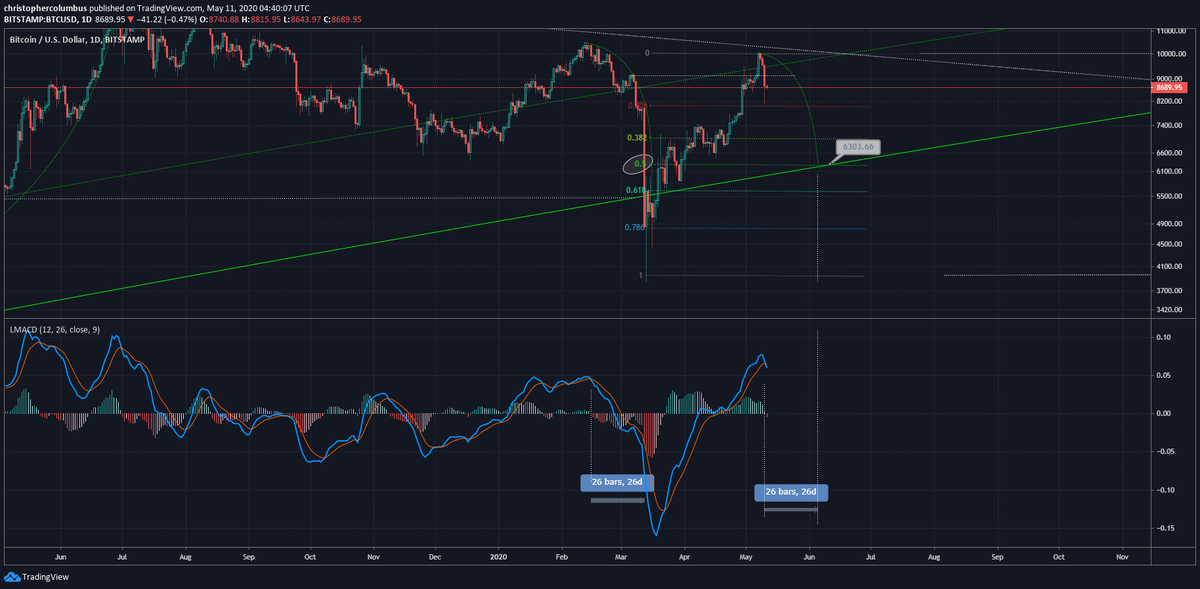
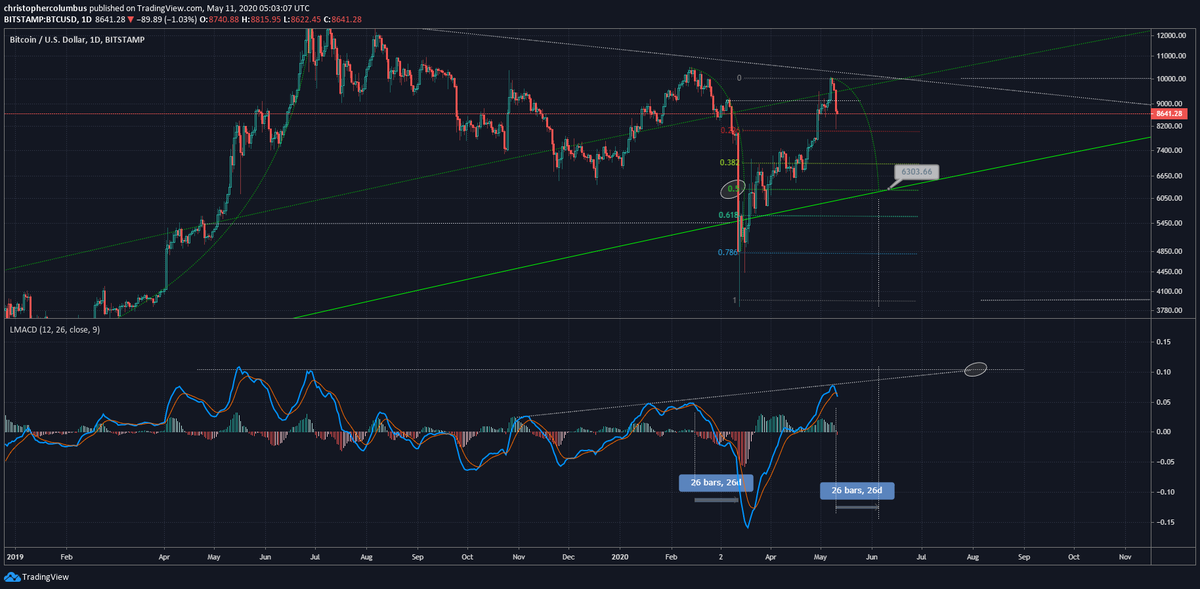
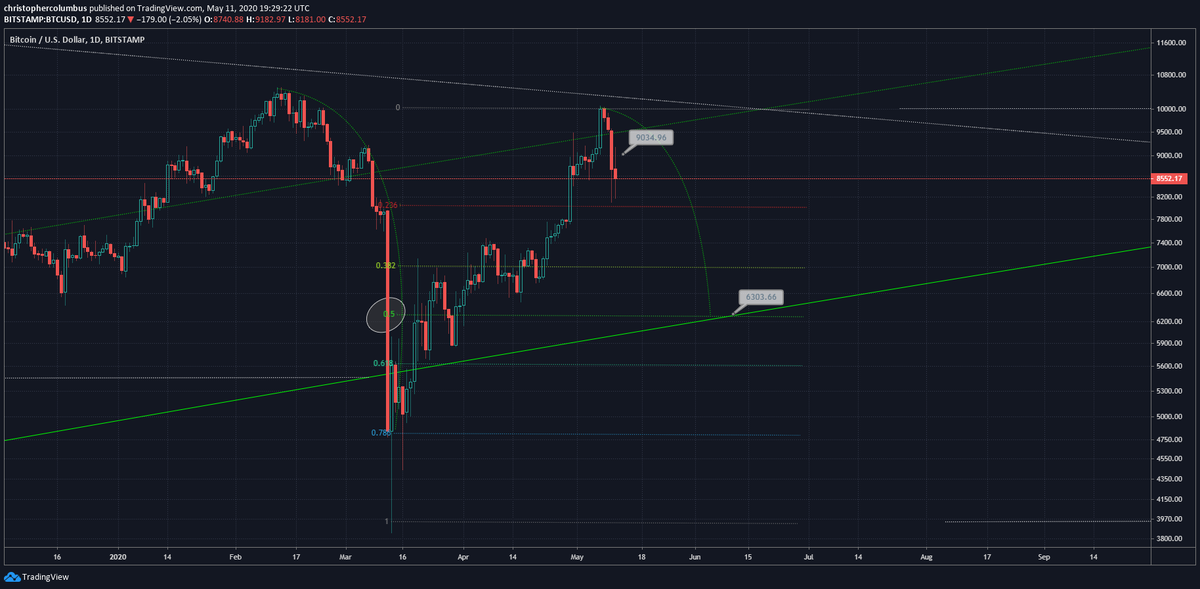
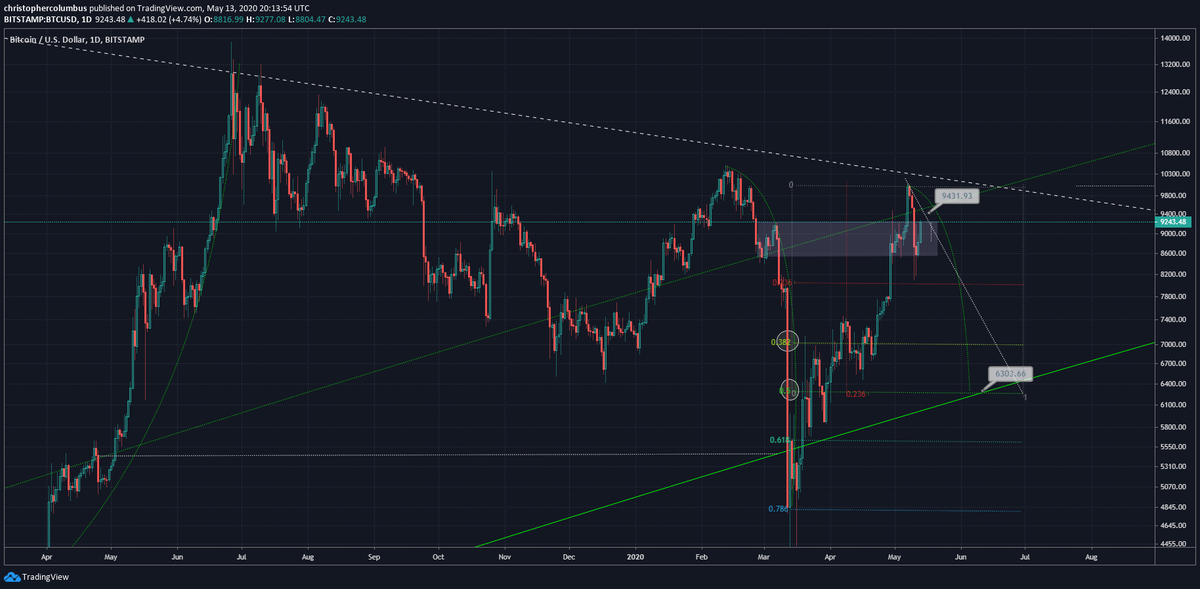
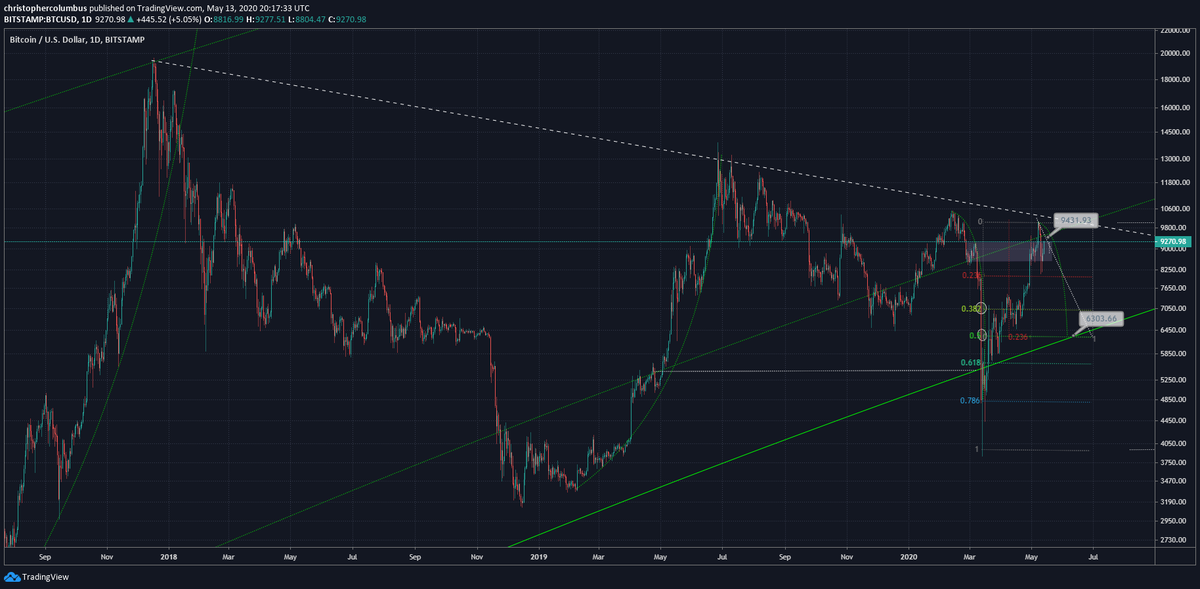
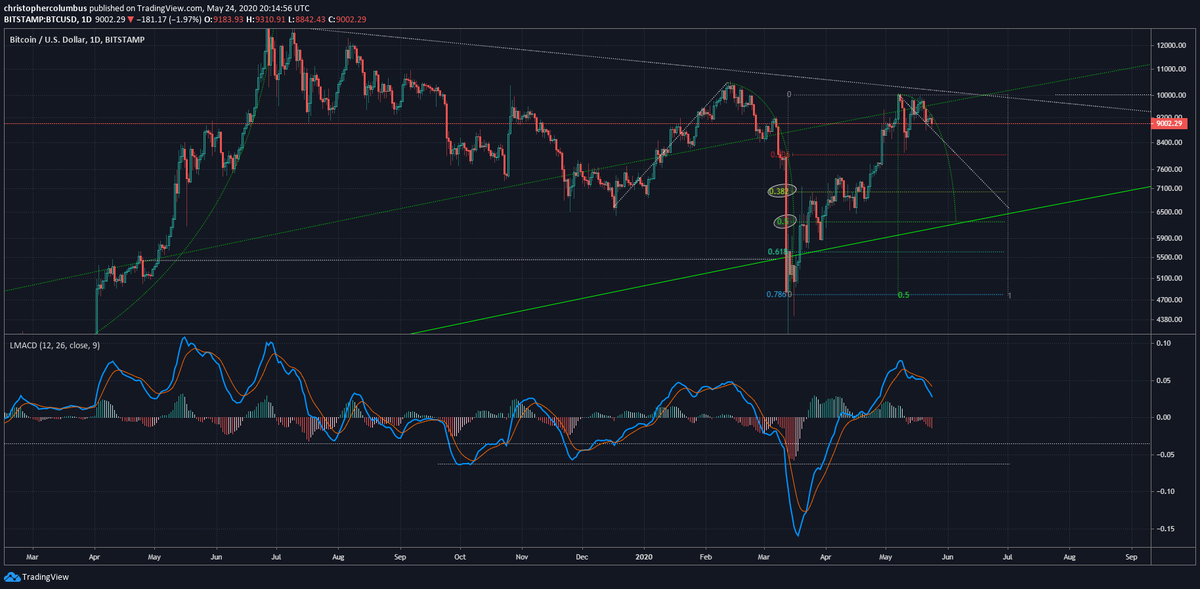
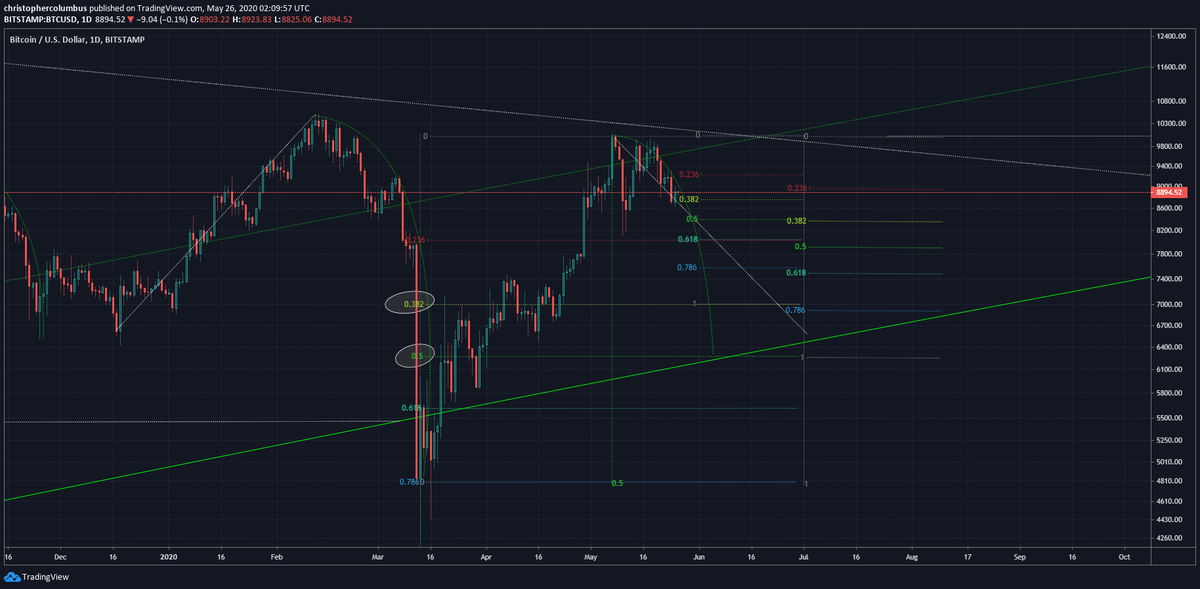
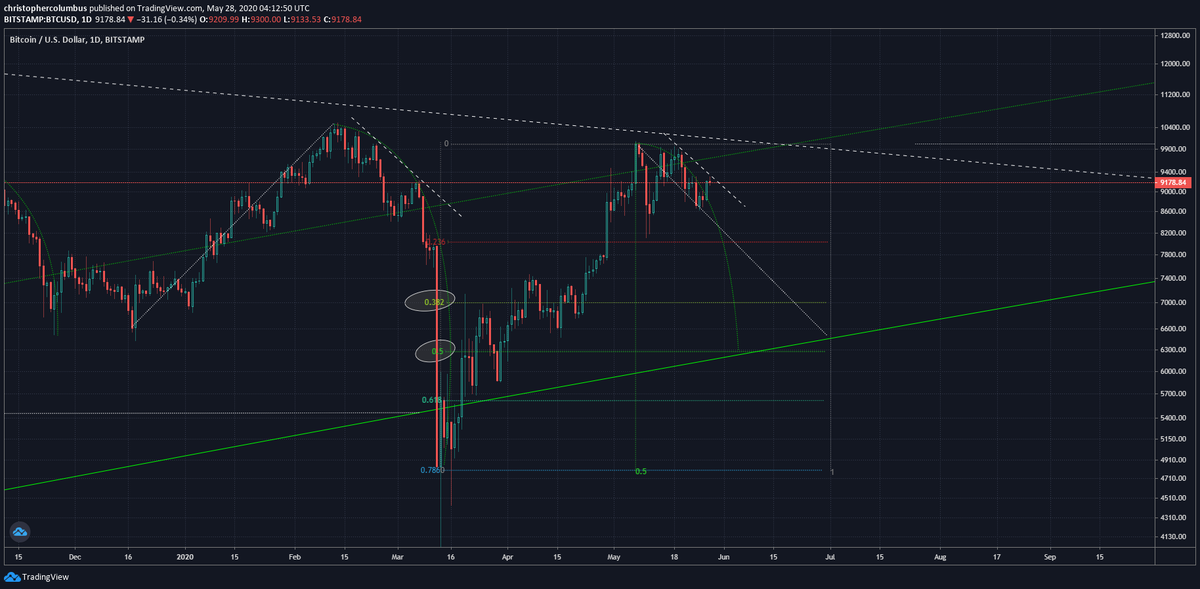
If the fractals continue to hold, time to start think about consolidation levels. 50% consolidation in real terms would put BTC in the 6K range. All good for going forward...
If the fractals continue to hold, time to start think about consolidation levels. 50% consolidation in real terms would put BTC in the 6K range. All good for going forward...
Reminder: a little lower, and back in the buy zone, where you& #39;re best to average in over a reasonable period of time imo....
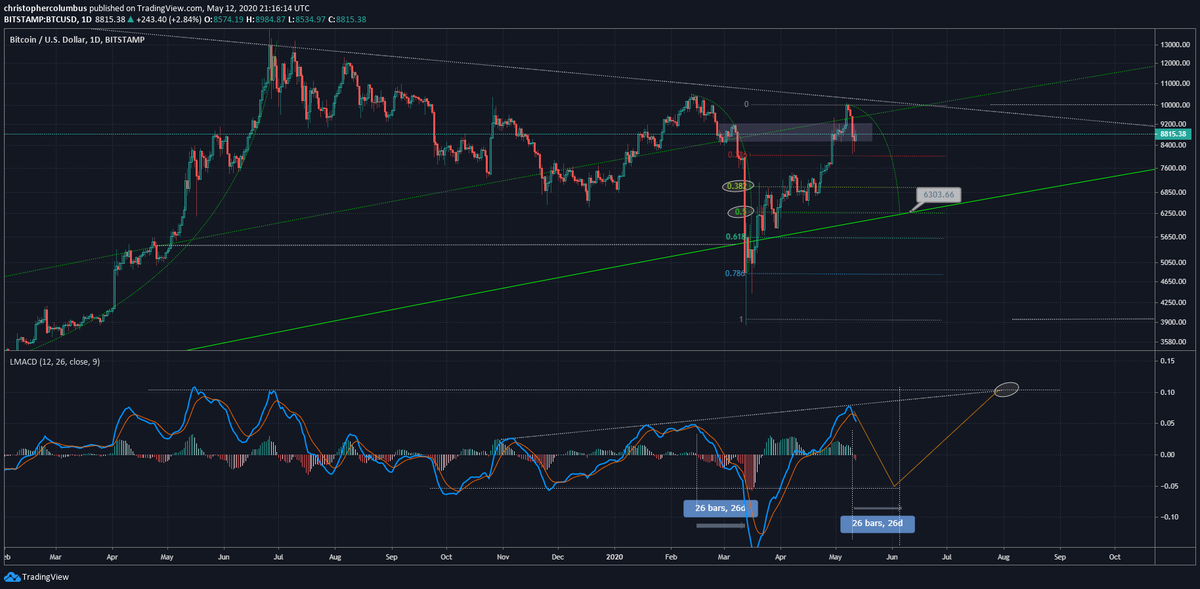
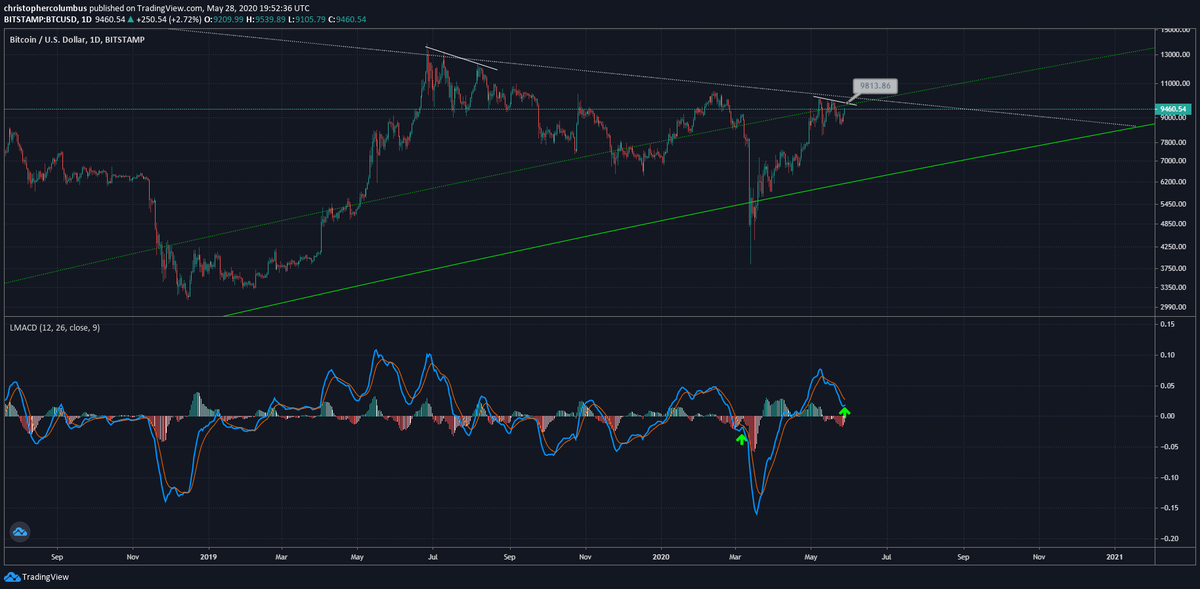
MACD crossing into the corrective mode.... and from a higher position than last time, where 26 days followed before the move back up. Wouldn& #39;t be surprised to see a bounce to 9K here though...
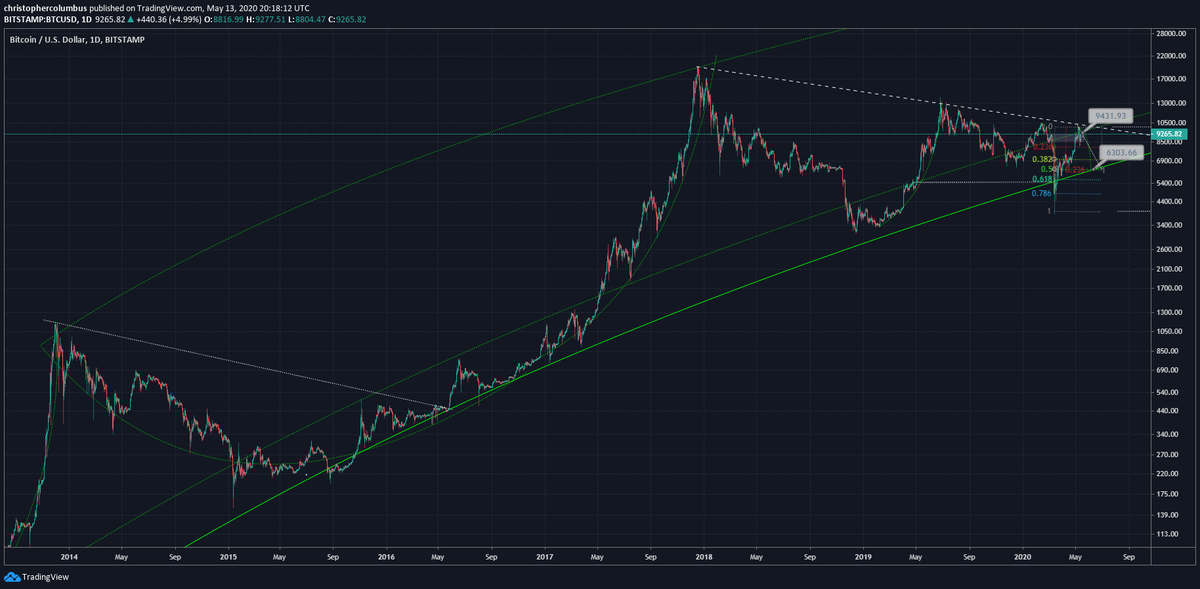
Massive volatility coming into the business end of the medium term triangle formed. Zoomed out view gives the context of major lines.
Technically, in the buy-zone.
Short term - consolidation, medium/ long term - bullish.
Technically, in the buy-zone.
Short term - consolidation, medium/ long term - bullish.
Reminder
The shorter term and the longer term.
You can make shorter term predictions [which I do on threads like this], but there is always less probability of them being confirmed than the longer term predictions.
The shorter term and the longer term.
You can make shorter term predictions [which I do on threads like this], but there is always less probability of them being confirmed than the longer term predictions.
Due to this, I keep the buy zone [shaded area] on all BTC charts. Currently, BTC is right at the top of the buy zone.
Poll - should one buy at the top of the buy zone or not?
Poll - should one buy at the top of the buy zone or not?
Nearly two thirds answering not to buy.
A question such as this though is a false dichotomy - whether or not you buy here depends on your circumstances, risk tolerances, and current positions [or absence of them].
A question such as this though is a false dichotomy - whether or not you buy here depends on your circumstances, risk tolerances, and current positions [or absence of them].
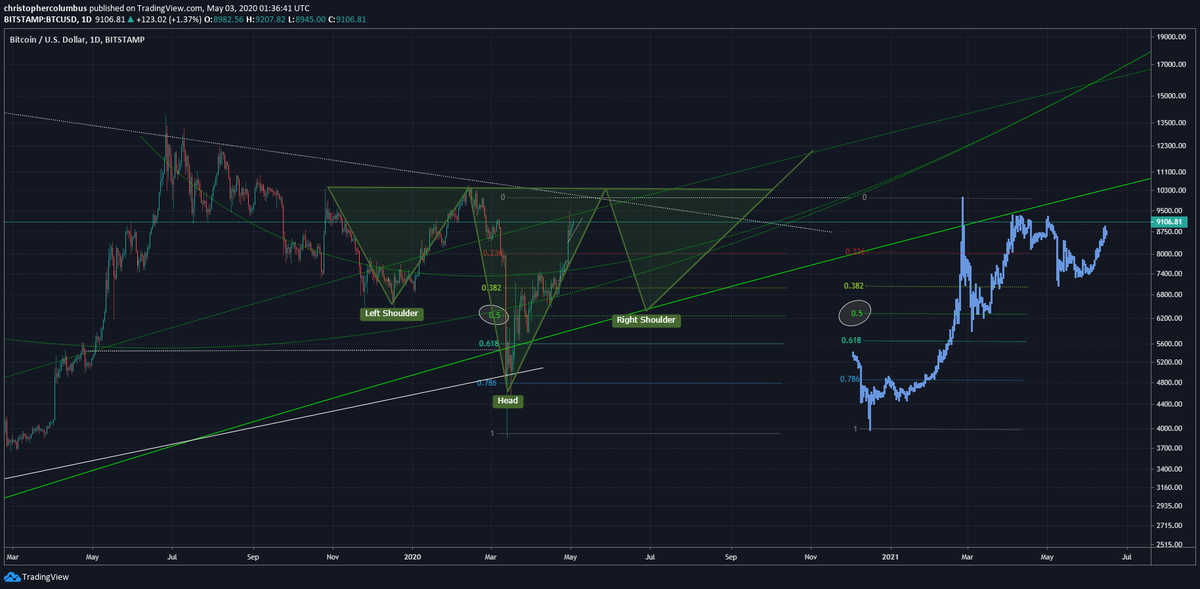
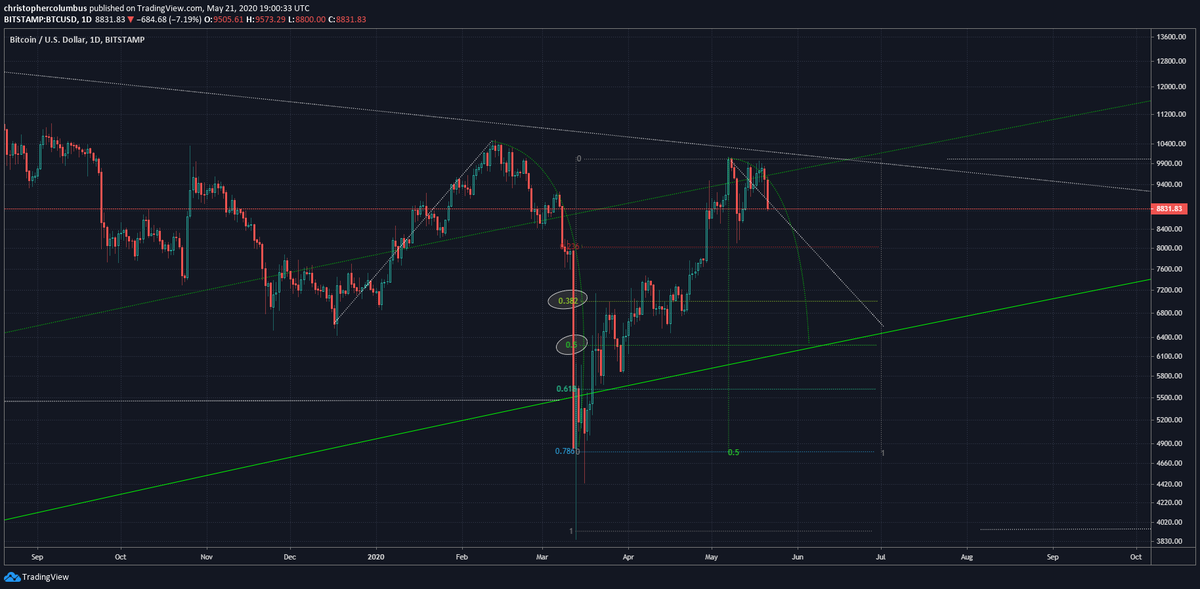
Has anyone drawn a descending triangle yet? This would double up nicely with the .38 fib [just taking price into the 6K range], and triple up with the larger reverse head and shoulders drawn a month ago above.
Reminder: though this thread has been pretty good in calling the price direction over the past couple of months, it is nevertheless a more speculative thread as is focused on the shorter term. And so traders, not investors, are going to be more interested in it...
The thread is about giving those that might be interested in my trading/ alts page [subscription based] an insight into my accuracy and style....

 Read on Twitter
![From alts page.Looking good so far. This chart compares the capitulation of the previous bottom [Jan 2015] to the present one. From alts page.Looking good so far. This chart compares the capitulation of the previous bottom [Jan 2015] to the present one.](https://pbs.twimg.com/media/ETLj3a2UMAAlRWR.png)
![From alts page.Looking good so far. This chart compares the capitulation of the previous bottom [Jan 2015] to the present one. From alts page.Looking good so far. This chart compares the capitulation of the previous bottom [Jan 2015] to the present one.](https://pbs.twimg.com/media/ETN8d7wUMAEJmzh.png)
![Fractal predicted price would hold yesterday at peak bearishness, and sure enough [from alts page].... Fractal predicted price would hold yesterday at peak bearishness, and sure enough [from alts page]....](https://pbs.twimg.com/media/ET0SHIJUEAAEHC9.png)
![BTC short term [more speculative]Thinking price may oscillate around the 0.61 level for a couple of weeks before moving higher... BTC short term [more speculative]Thinking price may oscillate around the 0.61 level for a couple of weeks before moving higher...](https://pbs.twimg.com/media/EUe8GzyWAAUNqQ5.png)
![Three weeks later and the capitulation has retraced 78%... in the top band. Sure, BTC will sell off on a liquidation event [as an asset], but what many are missing is that it is also a desirable currency/ form of liquidity. People will also buy it just as they& #39;d buy USD and gold. Three weeks later and the capitulation has retraced 78%... in the top band. Sure, BTC will sell off on a liquidation event [as an asset], but what many are missing is that it is also a desirable currency/ form of liquidity. People will also buy it just as they& #39;d buy USD and gold.](https://pbs.twimg.com/media/EUnopJhUYAElvgO.png)
![The inevitable short term unpredictability - comparison with a previous capitulation [Jan 2015] still alive... The inevitable short term unpredictability - comparison with a previous capitulation [Jan 2015] still alive...](https://pbs.twimg.com/media/EWUgsslUEAAGdmN.png)

![ReminderThe shorter term and the longer term.You can make shorter term predictions [which I do on threads like this], but there is always less probability of them being confirmed than the longer term predictions. ReminderThe shorter term and the longer term.You can make shorter term predictions [which I do on threads like this], but there is always less probability of them being confirmed than the longer term predictions.](https://pbs.twimg.com/media/EYUw-2GUcAALKM4.png)
![Has anyone drawn a descending triangle yet? This would double up nicely with the .38 fib [just taking price into the 6K range], and triple up with the larger reverse head and shoulders drawn a month ago above. Has anyone drawn a descending triangle yet? This would double up nicely with the .38 fib [just taking price into the 6K range], and triple up with the larger reverse head and shoulders drawn a month ago above.](https://pbs.twimg.com/media/EZIbCkWU0AAYhQ7.png)
