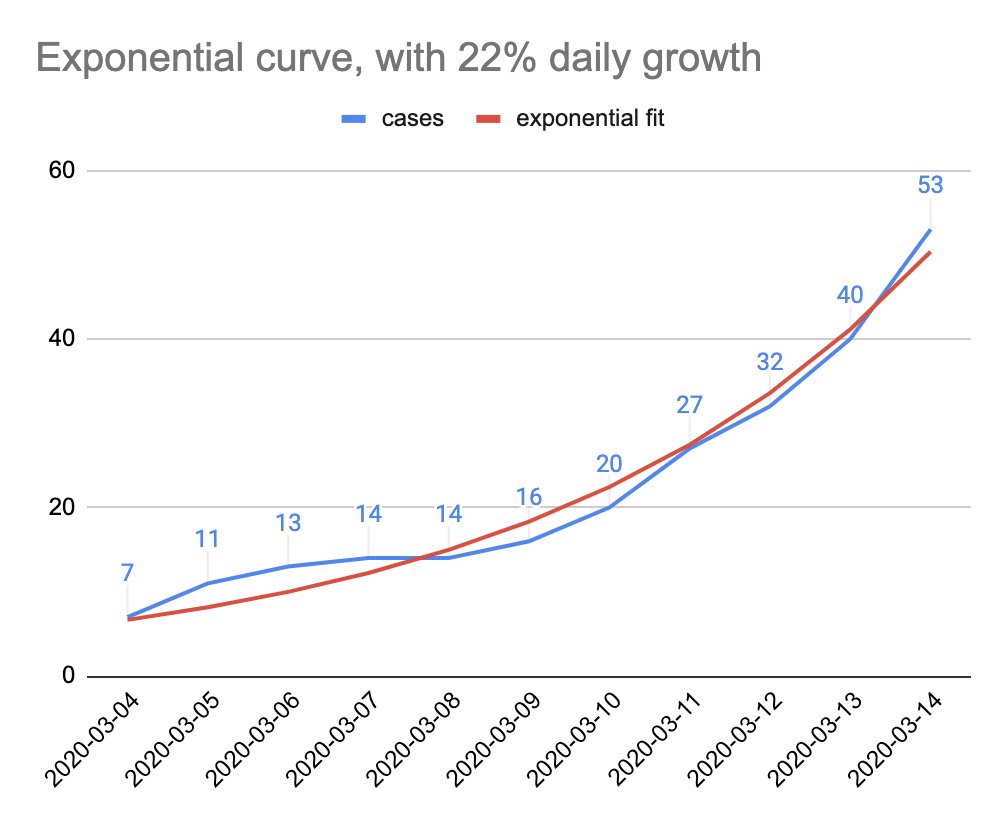
Los Angeles isn& #39;t getting much attention from data people anywhere, so in case you& #39;re wondering, Los Angeles #coronavirus cases are following exponential growth.
Reported numbers show 22% daily growth, assuming testing limits are not altering shape of the curve.
(R^2 = .978)
Reported numbers show 22% daily growth, assuming testing limits are not altering shape of the curve.
(R^2 = .978)
For those of you who are interested in doing your own analysis, data set + sources are here: http://bit.ly/lacovid19 ">https://bit.ly/lacovid19...
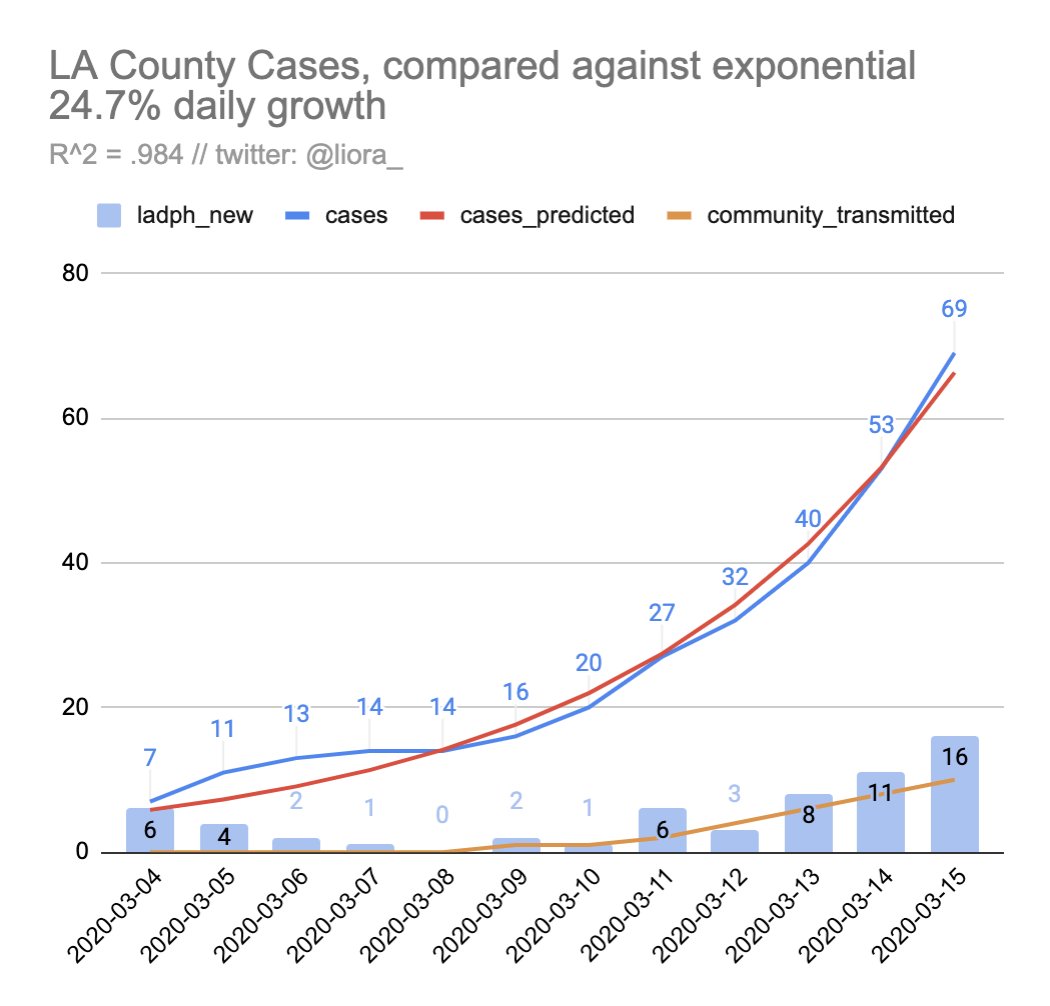
March 15th data for Los Angeles County coronavirus cases.
24.7% daily growth rate
@lapublichealth
Data: http://bit.ly/lacovid19 ">https://bit.ly/lacovid19...
24.7% daily growth rate
@lapublichealth
Data: http://bit.ly/lacovid19 ">https://bit.ly/lacovid19...
Possible explanations for <25% growth rate in LA, when other countries are showing ~33%.
1) More spread out as a metro
2) Better weather
3) Social distancing
4) Testing constraints
5) Angelenos taking hygiene seriously (seems unlikely to be the cause) https://twitter.com/NAChristakis/status/1237825846024511491">https://twitter.com/NAChrista...
1) More spread out as a metro
2) Better weather
3) Social distancing
4) Testing constraints
5) Angelenos taking hygiene seriously (seems unlikely to be the cause) https://twitter.com/NAChristakis/status/1237825846024511491">https://twitter.com/NAChrista...
Note that the social distancing isn& #39;t so hot right now.
Maybe I& #39;m being greedy but only 38%? Come on LA we are better than this. https://twitter.com/ShaiDardashti/status/1238642577873596417">https://twitter.com/ShaiDarda...
Maybe I& #39;m being greedy but only 38%? Come on LA we are better than this. https://twitter.com/ShaiDardashti/status/1238642577873596417">https://twitter.com/ShaiDarda...
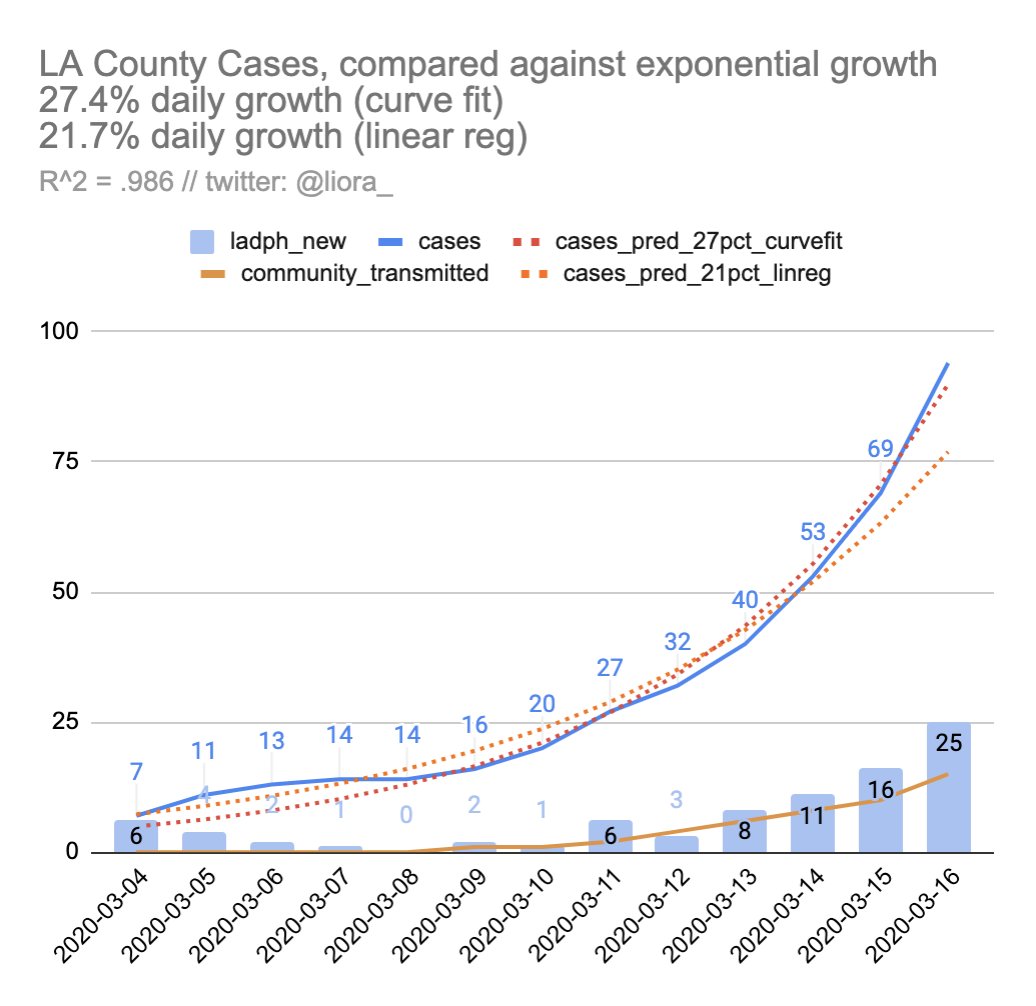
March 16th data for Los Angeles County coronavirus cases.
27.4% daily growth rate using a curve fit (present-bias)
21.7% using a linear regression (historical bias)
compare to ~33% daily growth rate in US & other countries.
Data: http://bit.ly/lacovid19 ">https://bit.ly/lacovid19... | @lapublichealth
27.4% daily growth rate using a curve fit (present-bias)
21.7% using a linear regression (historical bias)
compare to ~33% daily growth rate in US & other countries.
Data: http://bit.ly/lacovid19 ">https://bit.ly/lacovid19... | @lapublichealth
March 17: LA& #39;s not following a smooth exponential curve.
Daily Growth:
33.5% (curve fit - present-bias)
23.4% (linear regression)
More testing makes growth rate looks higher. On one hand, closer to ~33% national rate. On the other hand, unlikely to actually be changing.
Daily Growth:
33.5% (curve fit - present-bias)
23.4% (linear regression)
More testing makes growth rate looks higher. On one hand, closer to ~33% national rate. On the other hand, unlikely to actually be changing.
@lapublichealth did not update community transmit count for today yet.

 Read on Twitter


