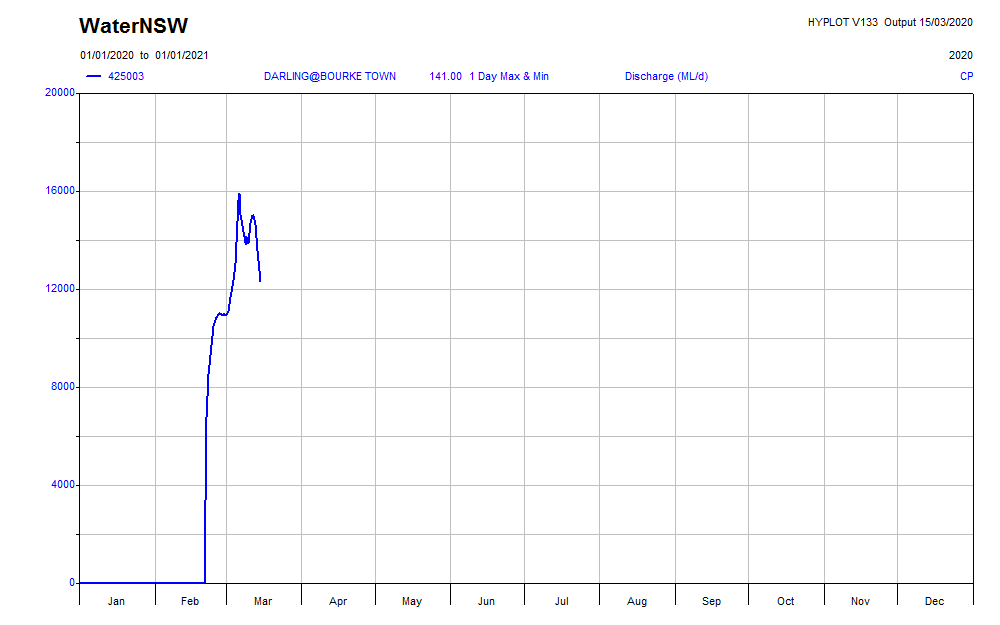
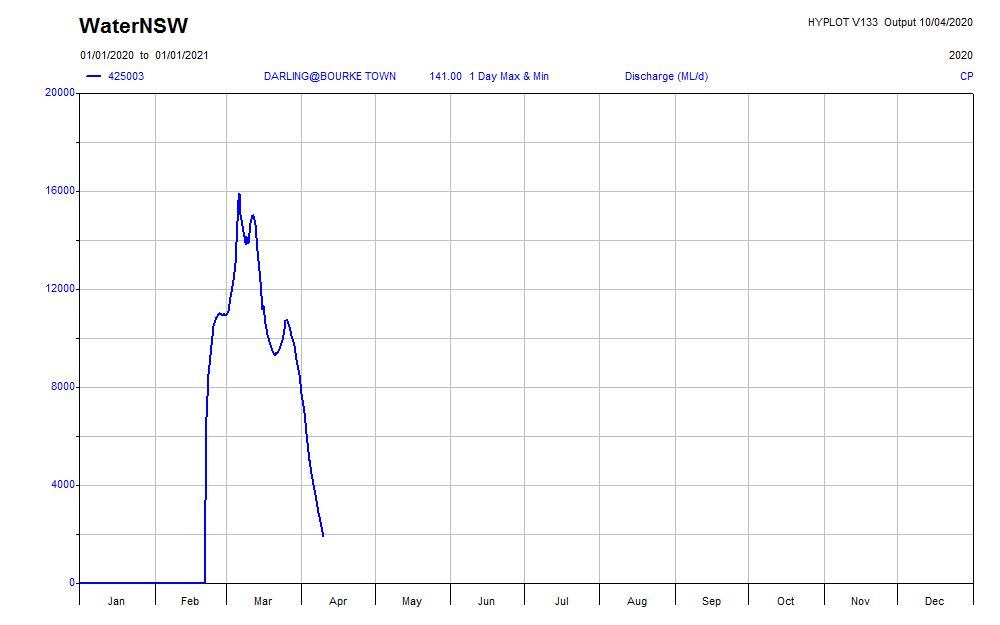
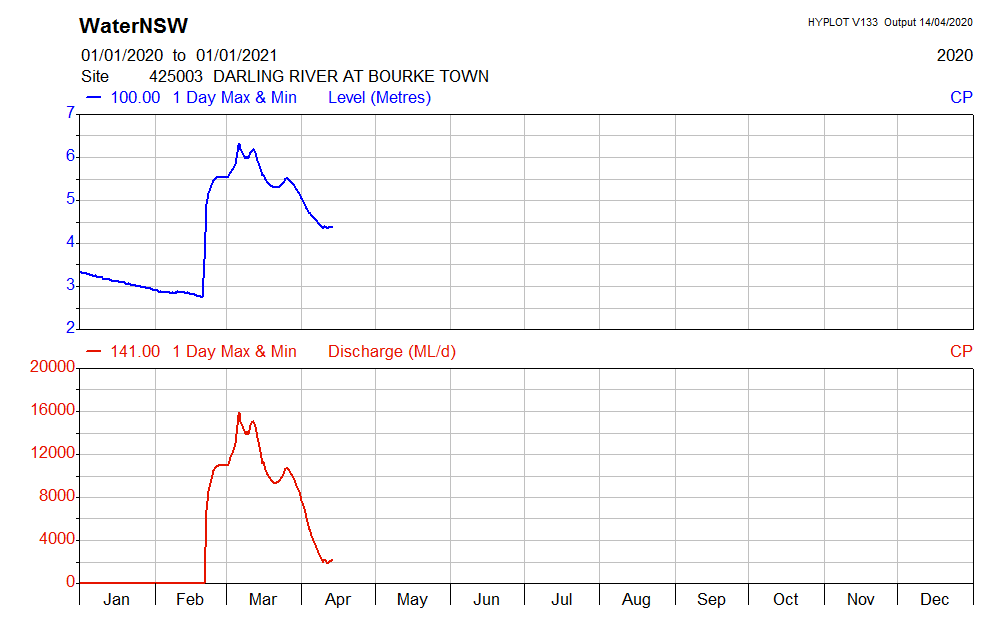
The hydrograph at Bourke is now well defined. Might be time to do the calculation: How much water has reached the lower Baaka vs how much has been retained in public and private storages?
The aggregate flow passing Bourke is currently 487 GL.
https://realtimedata.waternsw.com.au?ppbm=425003&rs&1&rscf_org"> https://realtimedata.waternsw.com.au?ppbm=425003&rs&1&rscf_orgrealtimedata.waternsw.com.au/?ppbm=425003&r
The aggregate flow passing Bourke is currently 487 GL.
https://realtimedata.waternsw.com.au?ppbm=425003&rs&1&rscf_org"> https://realtimedata.waternsw.com.au?ppbm=425003&rs&1&rscf_orgrealtimedata.waternsw.com.au/?ppbm=425003&r
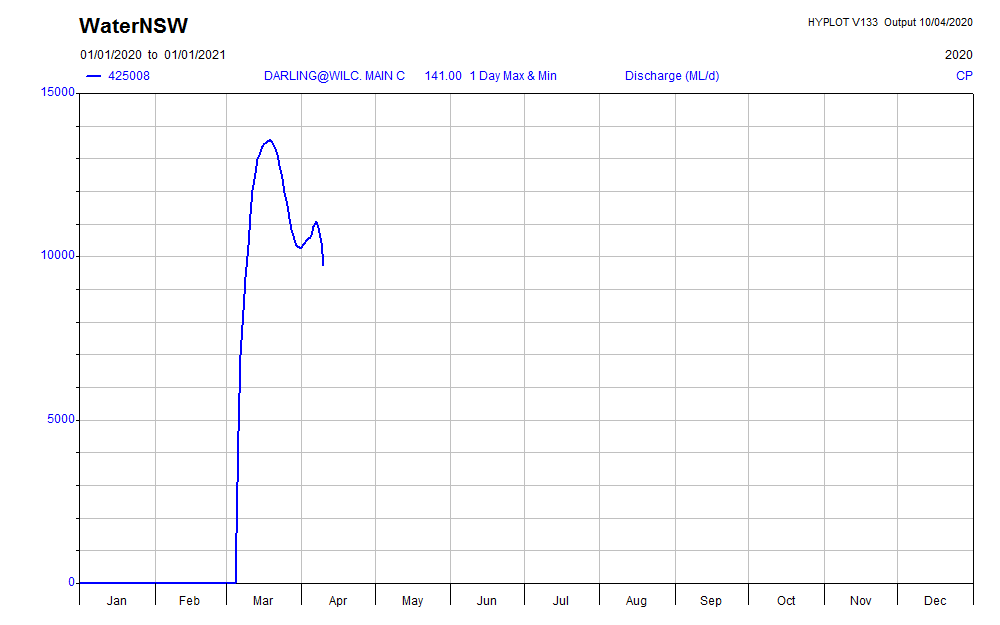
...And downstream at Wilcannia, it currently looks like this. The aggregate flow to date there is 401 GL, but there& #39;s obviously a bit to come yet.
BTW, that sharp peak and dip in the top of the Bourke hydrograph is reportedly due to local irrigators pumping the shit out of it. Big western rivers don& #39;t naturally behave like that.
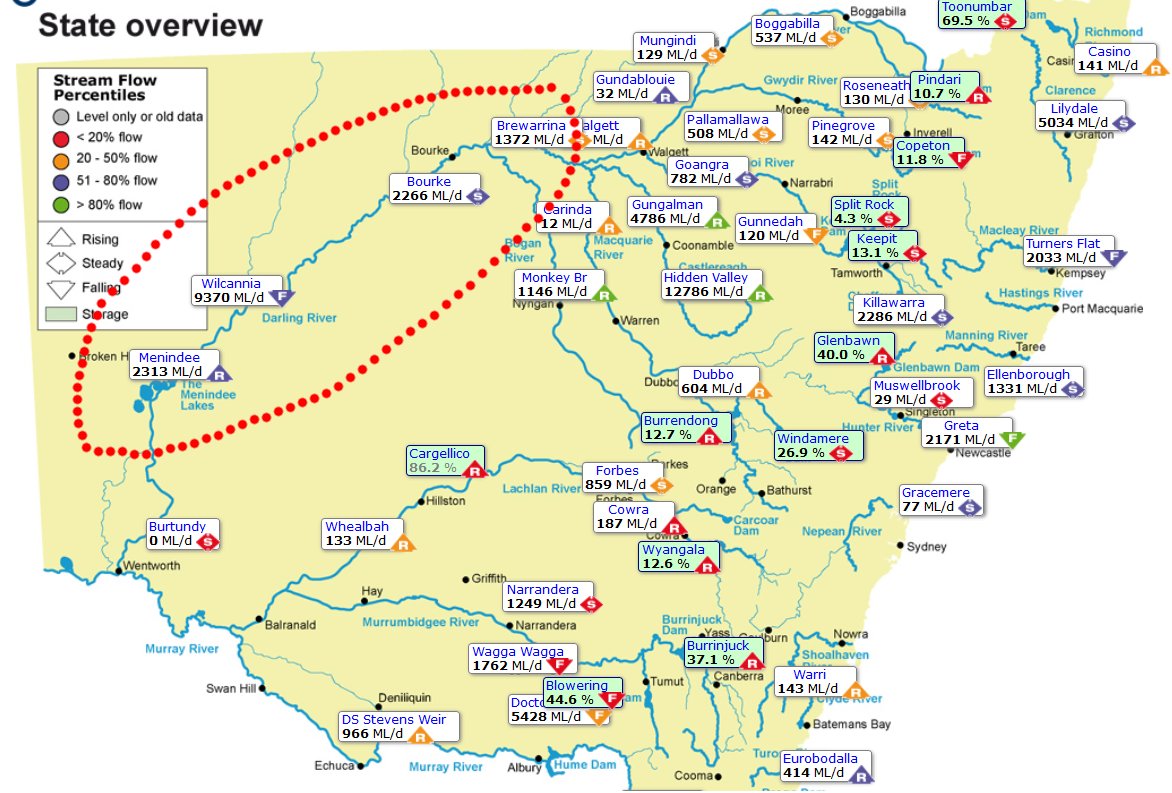
We& #39;re here, in case you& #39;re lost. Data is from:
https://realtimedata.waternsw.com.au/water.stm
& #39;Baaka& #39;">https://realtimedata.waternsw.com.au/water.stm... == correct long-historical name for the river that some still call the Darling.
https://realtimedata.waternsw.com.au/water.stm
& #39;Baaka& #39;">https://realtimedata.waternsw.com.au/water.stm... == correct long-historical name for the river that some still call the Darling.
First the large public dams, clockwise from the north:
Beardmore Dam (Qld, at St George):
Capacity 82 GL. Rose from 4% on 14 Jan to ~100% on 28 February, for 78 GL impounded from the event. https://www.sunwater.com.au/water-data/historical-dam-capacity/">https://www.sunwater.com.au/water-dat...
Beardmore Dam (Qld, at St George):
Capacity 82 GL. Rose from 4% on 14 Jan to ~100% on 28 February, for 78 GL impounded from the event. https://www.sunwater.com.au/water-data/historical-dam-capacity/">https://www.sunwater.com.au/water-dat...
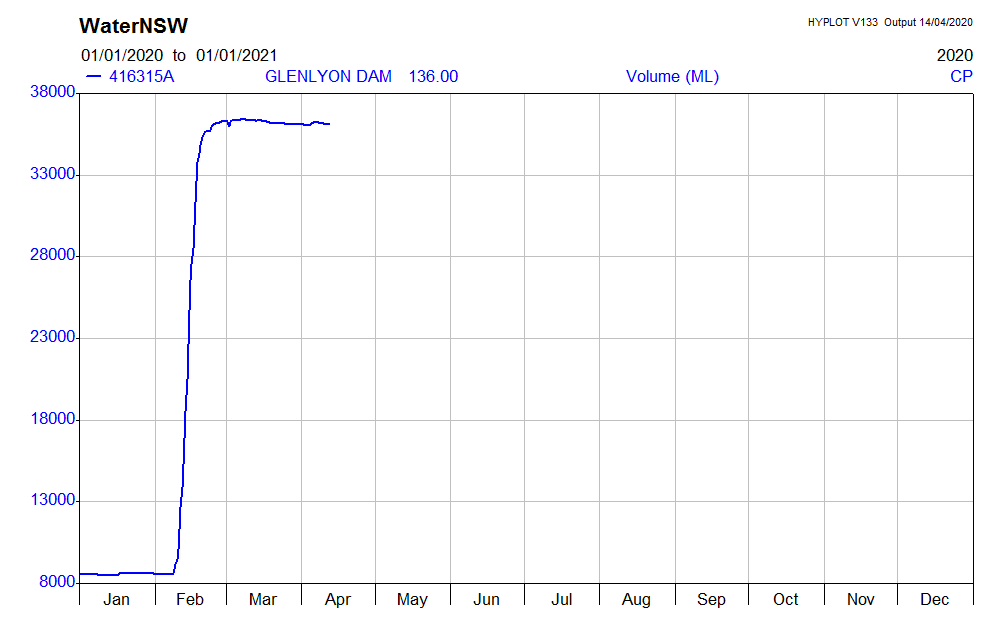
Glenlyon Dam (Qld, west of Stanthorpe, operated for Qld and NSW irrigators):
Capacity 254 GL. Rose from 8.5 GL on 8 February to 36 GL on 24 February, for 27 GL impounded from the flow event.
https://realtimedata.waternsw.com.au/water.stm?ppbm=416315A|GLENLYON|STORAGE_SITE&da&1&dacf_org">https://realtimedata.waternsw.com.au/water.stm...
Capacity 254 GL. Rose from 8.5 GL on 8 February to 36 GL on 24 February, for 27 GL impounded from the flow event.
https://realtimedata.waternsw.com.au/water.stm?ppbm=416315A|GLENLYON|STORAGE_SITE&da&1&dacf_org">https://realtimedata.waternsw.com.au/water.stm...
Pindari Dam (NSW, north of Inverell):
Capacity 312 GL. Rose from 12 GL on 13 February to 32 GL on 20 March, for 20 GL impounded from the flow event. (There is a subsequent rise, but lets focus on the February - March flow event.)
https://realtimedata.waternsw.com.au/water.stm?ppbm ">https://realtimedata.waternsw.com.au/water.stm...
Capacity 312 GL. Rose from 12 GL on 13 February to 32 GL on 20 March, for 20 GL impounded from the flow event. (There is a subsequent rise, but lets focus on the February - March flow event.)
https://realtimedata.waternsw.com.au/water.stm?ppbm ">https://realtimedata.waternsw.com.au/water.stm...
Lots to go yet, and we& #39;re up to 125 GL impounded already. Remember this is just the large public dams in the Baaka (Darling River) catchment.
And btw, so far most of these dams have released approximately none of what they& #39;ve impounded (bits here and there; a few percent, tia).
And btw, so far most of these dams have released approximately none of what they& #39;ve impounded (bits here and there; a few percent, tia).
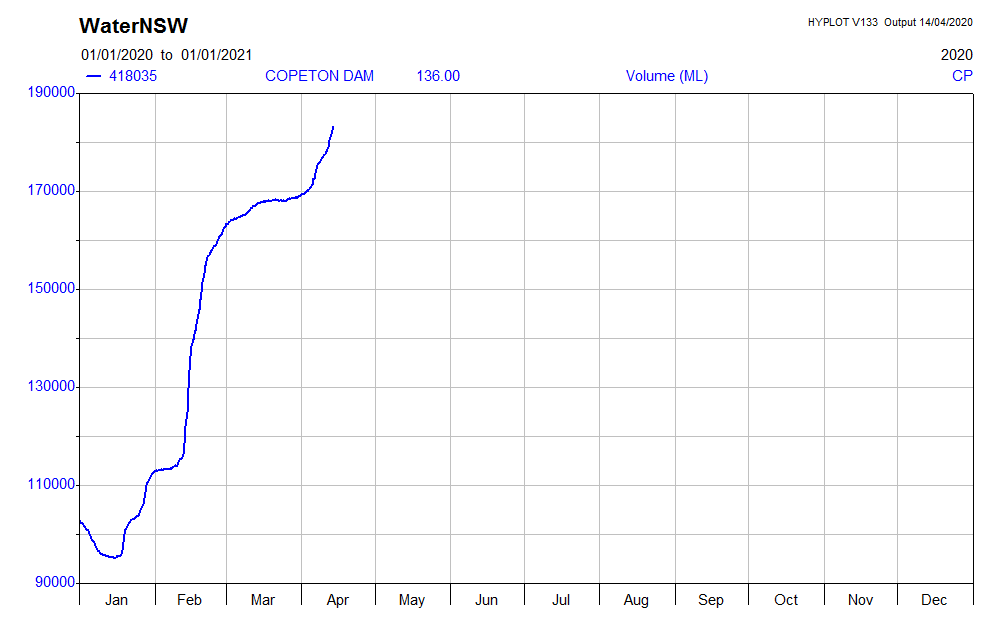
Copeton Dam (NSW, south of Inverell):
Capacity 1364 GL. Rose from 95 GL on 13 January to 168 GL on 20 March, for 73 GL impounded from the Feb-Mar event. (Again only counting the February - March rise, for comparison with the current Baaka flow.)
https://realtimedata.waternsw.com.au/water.stm?ppbm ">https://realtimedata.waternsw.com.au/water.stm...
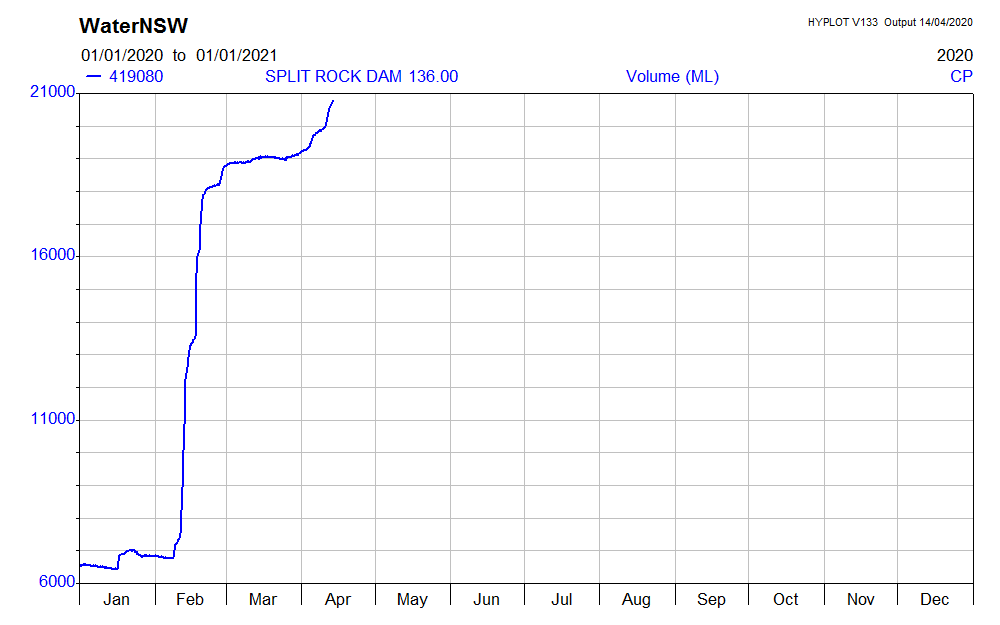
Split Rock Dam (NSW, south of Barraba):
Capacity 397 GL. Rose from 7 GL on 9 February to 19 GL on 20 March, for just 12 GL impounded from the flow event.
https://realtimedata.waternsw.com.au/water.stm?ppbm=419080&da&1&dacf_org">https://realtimedata.waternsw.com.au/water.stm...
Capacity 397 GL. Rose from 7 GL on 9 February to 19 GL on 20 March, for just 12 GL impounded from the flow event.
https://realtimedata.waternsw.com.au/water.stm?ppbm=419080&da&1&dacf_org">https://realtimedata.waternsw.com.au/water.stm...
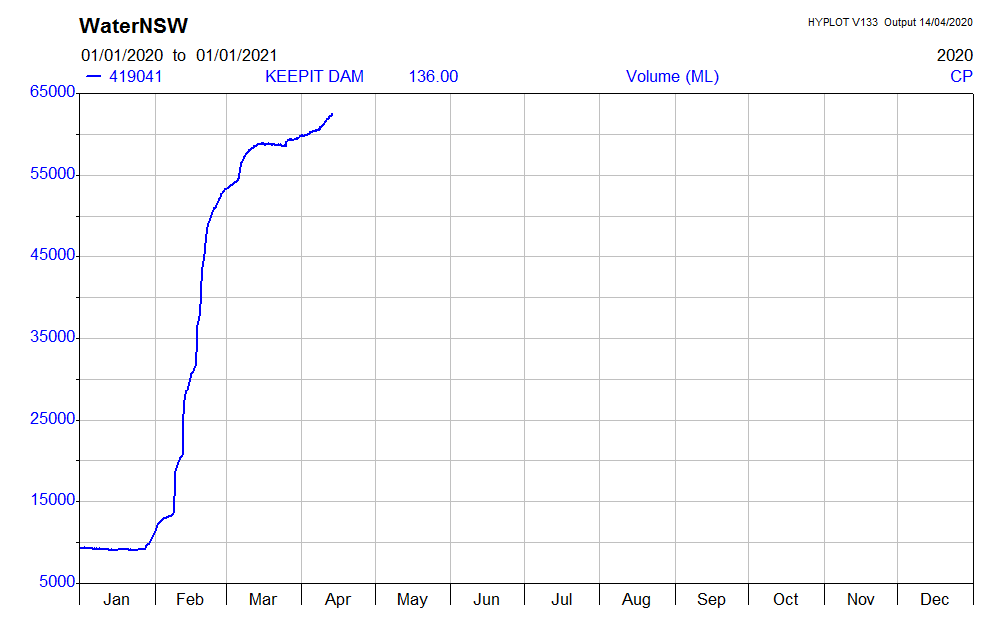
Keepit Dam (NSW, east of Gunnedah):
Capacity 426 GL. Rose from 9 GL on 27 January to 59 GL on 13 March, for 50 GL impounded from the February - March flow event.
https://realtimedata.waternsw.com.au/water.stm?ppbm=419041&da&1&dacf_org">https://realtimedata.waternsw.com.au/water.stm...
Capacity 426 GL. Rose from 9 GL on 27 January to 59 GL on 13 March, for 50 GL impounded from the February - March flow event.
https://realtimedata.waternsw.com.au/water.stm?ppbm=419041&da&1&dacf_org">https://realtimedata.waternsw.com.au/water.stm...
Now up to 260 GL impounded from the February - March flow event.
Note, I& #39;m definitely NOT saying this shouldn& #39;t be happening, but when viewing the current flow in the Baaka (lower Darling), best to understand how much irrigation storages have already taken from it.
Note, I& #39;m definitely NOT saying this shouldn& #39;t be happening, but when viewing the current flow in the Baaka (lower Darling), best to understand how much irrigation storages have already taken from it.
Windamere Dam (NSW, southeast of Mudgee):
Capacity 368 GL. Storage actually fell through the Feb-Mar flow event, because it didn& #39;t rain there, and because water was being transferred to Burrendong Dam downstream. Count -5 GL, so aggregate is correct.
https://realtimedata.waternsw.com.au/water.stm?ppbm=421148&da&1&dacf_org">https://realtimedata.waternsw.com.au/water.stm...
Burrendong Dam (NSW, southeast of Dubbo):
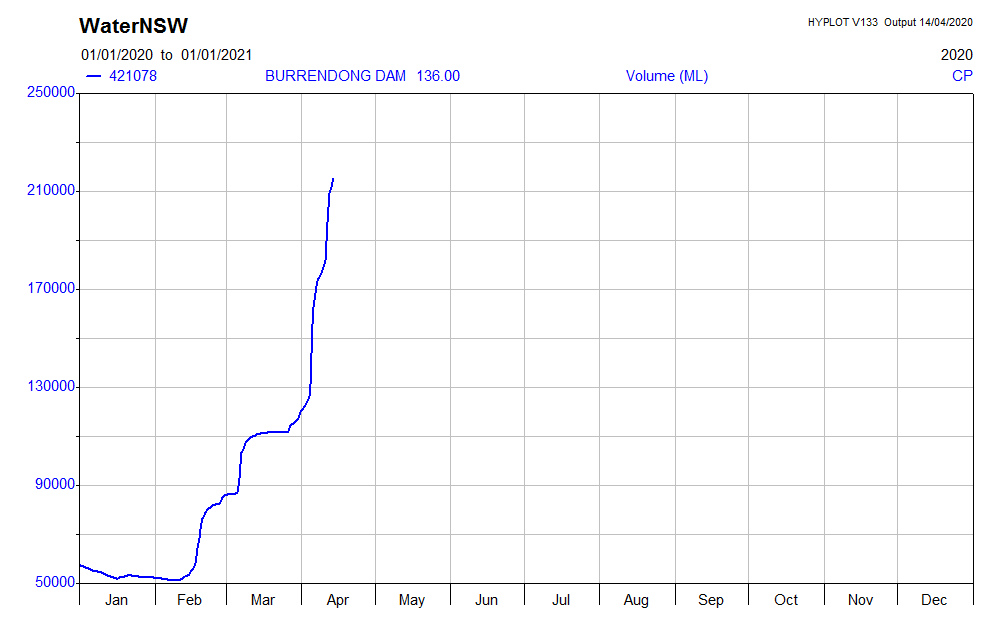
Capacity 1188 GL. Rose from 52 GL on 17 January to 111 GL on 15 March, for 59 GL impounded from the February - March flow event.
https://realtimedata.waternsw.com.au/water.stm?ppbm=421078&da&1&dacf_org">https://realtimedata.waternsw.com.au/water.stm...
Capacity 1188 GL. Rose from 52 GL on 17 January to 111 GL on 15 March, for 59 GL impounded from the February - March flow event.
https://realtimedata.waternsw.com.au/water.stm?ppbm=421078&da&1&dacf_org">https://realtimedata.waternsw.com.au/water.stm...
The eight large public dams in the Baaka (Darling) catchment collectively have removed 314 GL from the potential downstream flow from this event. The flow wave has now all but passed Bourke on the lower river, and the total flow there has been 495 GL.
https://realtimedata.waternsw.com.au/water.stm?ppbm ">https://realtimedata.waternsw.com.au/water.stm...
https://realtimedata.waternsw.com.au/water.stm?ppbm ">https://realtimedata.waternsw.com.au/water.stm...
Means that 39% of the potential Baaka (lower Darling River) flow from this event has been deleted *just by the public dams* in the catchment. That& #39;s public irrigation dams in every case, though a couple have subsidiary urban water supply functions. & #39;Cotton-water& #39; dams.
(For clarity, there are large flow losses between these dams and the lower river -- channel filling, aquifer filling, evaporation. But all of these rivers flowed strongly in this event, so losses are already deducted. The impounded water is very nearly a simple flow subtraction.)
And what of the very many, very large, private off-stream storages that have been filled from this flow event? Incredibly, given the importance of the matter, the water volume taken into those does not seem to be reported, perhaps not even properly measured.
But we have ways...
But we have ways...
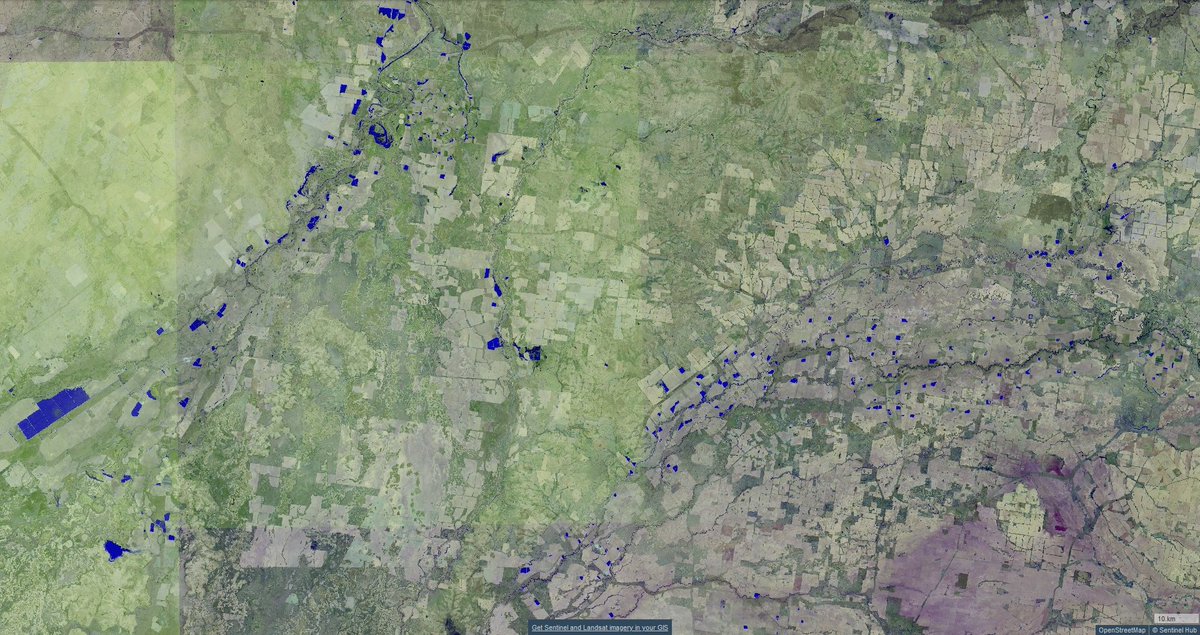
The surface area of such storages is readily available from satellite remote sensing, like this of Dirranbandi - Cubbie Station on 28 March, in a false colour infrared combination that highlights surface water. All of these storages were empty in January.
https://apps.sentinel-hub.com/sentinel-playground/?source=S2&lat=-28.73063577445635&lng=148.0242919921875&zoom=11&preset=3_FALSE_COLOR__URBAN_&layers=B01,B02,B03&maxcc=20&gain=0.4&gamma=0.4&time=2019-09-01%7C2020-03-28&atmFilter=ATMCOR&showDates=true">https://apps.sentinel-hub.com/sentinel-...
https://apps.sentinel-hub.com/sentinel-playground/?source=S2&lat=-28.73063577445635&lng=148.0242919921875&zoom=11&preset=3_FALSE_COLOR__URBAN_&layers=B01,B02,B03&maxcc=20&gain=0.4&gamma=0.4&time=2019-09-01%7C2020-03-28&atmFilter=ATMCOR&showDates=true">https://apps.sentinel-hub.com/sentinel-...
Water depth also is available from radar satellite remote sensing, but extraction of relative elevations is beyond my skill level.
Eg here& #39;s a radar reflectivity image from Sentinel-1 -- water and bare wet soil appear to reflect similarly, so ponds are difficult to pick out.
Eg here& #39;s a radar reflectivity image from Sentinel-1 -- water and bare wet soil appear to reflect similarly, so ponds are difficult to pick out.
Instead, for a first pass, assume an average water depth of 4m. Won& #39;t be a huge way out.
(Used to work extensively for a western NSW cotton-dam builder, though not much on his actual cotton dams (he was diversifying); colleague did that work -- mostly patching up stuff-ups.)
(Used to work extensively for a western NSW cotton-dam builder, though not much on his actual cotton dams (he was diversifying); colleague did that work -- mostly patching up stuff-ups.)
There are so so many private storages. For a quick pass estimate, focus just on the St George - Dirranbandi - Goondiwindi triangle. This bit, which is a nice clear-sky image on 23 March:
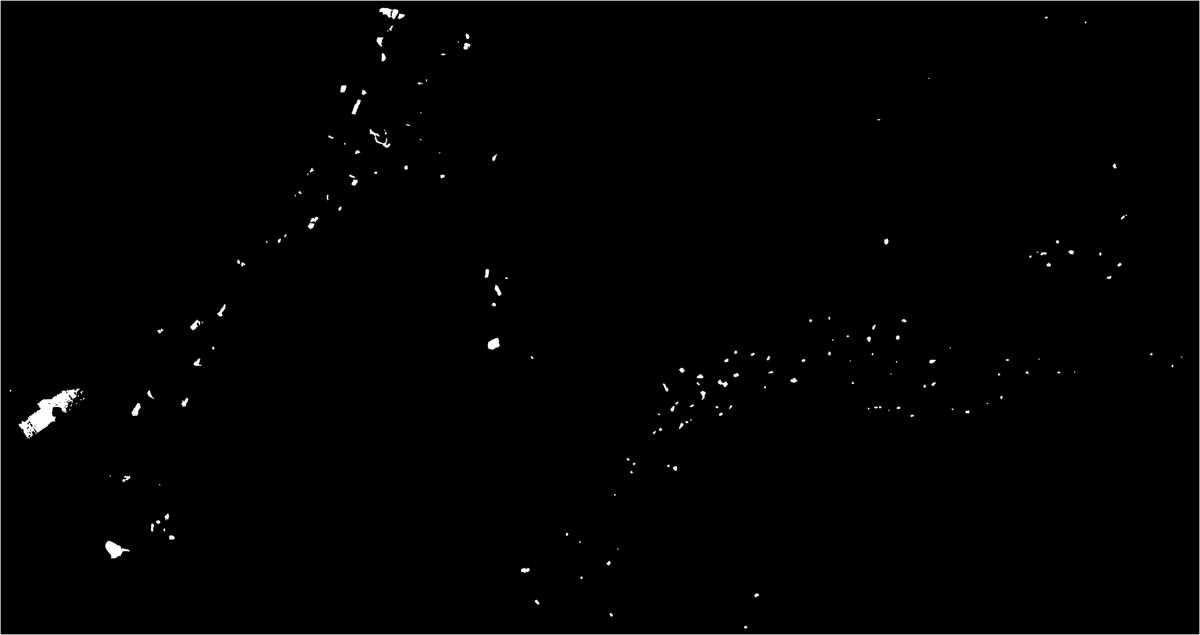
That image is 259 km x 136 km, for 32,504 km². If extract just the deep blue colour, like this (below), we find that it is 12739 pixels out of 1950720 or 0.653%, for 212 km² of new stored water (yep, really).
And at an average of 4 m deep, that is 849 GL. Yep, really. Look, maybe 4 m is a high estimate. To be nice and conservative, let& #39;s instead make it 2 m. That& #39;s still 425 GL. Yep, really.
And that& #39;s just one bit of the catchment (though it likely captures the majority of private, off-stream storage). Remember essentially everything was empty in January, so this is *all* new storage.
So we have 495 GL flowing past Bourke into the lower Baaka (lower Darling River), 314 GL impounded in large public dams in the catchment, and conservative-estimate 425 GL taken into private, off-stream storages.
Of the runoff available from the February - March flow event in the Northern Murray Darling Basin, just 40% made it to the lower Baaka/Darling River. Approximately 60% was taken into public and private storage.
One other thing and I& #39;ll shut up. Why does & #39;some engineering hydrologist on twitter& #39; have to perform such a calculation? Where is the Murray Darling Basin Authority& #39;s estimate? Not made? If so why? Made, but not publicised? If so why?
BTW, for context, this piece says cotton irrigation took ~2500 GL all up in 2017-18, the most recent high-production season. Most of that (not all) was in the Northern Basin. https://theconversation.com/while-towns-run-dry-cotton-extracts-5-sydney-harbours-worth-of-murray-darling-water-a-year-its-time-to-reset-the-balance-133342">https://theconversation.com/while-tow...

 Read on Twitter