The @WMO #StateoftheClimate report published today, highlights further evidence of the physical signs of climate change. Our #infographic shows increasing global temperature  https://abs.twimg.com/emoji/v2/... draggable="false" alt="🌡️" title="Thermometer" aria-label="Emoji: Thermometer"> and ocean heat
  https://abs.twimg.com/emoji/v2/... draggable="false" alt="🌊" title="Water wave" aria-label="Emoji: Water wave">
 https://abs.twimg.com/emoji/v2/... draggable="false" alt="🌡️" title="Thermometer" aria-label="Emoji: Thermometer">, rising sea levels
  https://abs.twimg.com/emoji/v2/... draggable="false" alt="⬆️" title="Upwards arrow" aria-label="Emoji: Upwards arrow">
 https://abs.twimg.com/emoji/v2/... draggable="false" alt="🌊" title="Water wave" aria-label="Emoji: Water wave">, melting ice
  https://abs.twimg.com/emoji/v2/... draggable="false" alt="❄️" title="Snowflake" aria-label="Emoji: Snowflake">
 https://abs.twimg.com/emoji/v2/... draggable="false" alt="💧" title="Droplet" aria-label="Emoji: Droplet"> as well as increases in CO2
  https://abs.twimg.com/emoji/v2/... draggable="false" alt="⬆️" title="Upwards arrow" aria-label="Emoji: Upwards arrow">
1/ Key global temperature  https://abs.twimg.com/emoji/v2/... draggable="false" alt="🌡️" title="Thermometer" aria-label="Emoji: Thermometer"> data sets from @NOAA @NASAGISS @JMA_kishou @ECMWF @MetOffice, reinforce that 2015-2019 were the five warmest years since 1850 says @WMO #StateoftheClimate report
4/ Warming #oceans & #ice loss contribute to global #sealevelrise. Since the start of the satellite record (1993) observations indicate that the global level has been rising at an average rate of 3.25mm per year  https://abs.twimg.com/emoji/v2/... draggable="false" alt="⬆️" title="Upwards arrow" aria-label="Emoji: Upwards arrow">
 https://abs.twimg.com/emoji/v2/... draggable="false" alt="🌊" title="Water wave" aria-label="Emoji: Water wave">
2/ Data from #WDCGG shows levels of greenhouse gases reached record levels in 2018 with #carbondioxide rising to 407.8ppm  https://abs.twimg.com/emoji/v2/... draggable="false" alt="⬆️" title="Upwards arrow" aria-label="Emoji: Upwards arrow">
 https://abs.twimg.com/emoji/v2/... draggable="false" alt="📈" title="Chart with upwards trend" aria-label="Emoji: Chart with upwards trend"> as highlighted in the @WMO #StateoftheClimate report
3/ The #ocean takes up 90% of energy trapped in the Earth system by greenhouse gases - this is measured by #oceanheatcontent. Three key data sets document how this has been rising since 1955  https://abs.twimg.com/emoji/v2/... draggable="false" alt="🌊" title="Water wave" aria-label="Emoji: Water wave">
 https://abs.twimg.com/emoji/v2/... draggable="false" alt="🌡️" title="Thermometer" aria-label="Emoji: Thermometer">
  https://abs.twimg.com/emoji/v2/... draggable="false" alt="⬆️" title="Upwards arrow" aria-label="Emoji: Upwards arrow"> @WMO #StateoftheClimate report
5/ The decreasing trend in #Antarctic  https://abs.twimg.com/emoji/v2/... draggable="false" alt="🇦🇶" title="Flag of Antarctica" aria-label="Emoji: Flag of Antarctica"> sea-ice extent continued in 2019, according to @NSIDC data with several record low months and the 7th lowest annual minimum extent on record
  https://abs.twimg.com/emoji/v2/... draggable="false" alt="❄️" title="Snowflake" aria-label="Emoji: Snowflake">
 https://abs.twimg.com/emoji/v2/... draggable="false" alt="💧" title="Droplet" aria-label="Emoji: Droplet">
6/ #Arctic sea ice extent  https://abs.twimg.com/emoji/v2/... draggable="false" alt="🌊" title="Water wave" aria-label="Emoji: Water wave">has been declining in all months and minimum monthly extent in September 2019 was the 3rd lowest on record, as per @NSIDC data
  https://abs.twimg.com/emoji/v2/... draggable="false" alt="❄️" title="Snowflake" aria-label="Emoji: Snowflake">
 https://abs.twimg.com/emoji/v2/... draggable="false" alt="💧" title="Droplet" aria-label="Emoji: Droplet">
  https://abs.twimg.com/emoji/v2/... draggable="false" alt="📉" title="Chart with downwards trend" aria-label="Emoji: Chart with downwards trend">

 Read on Twitter
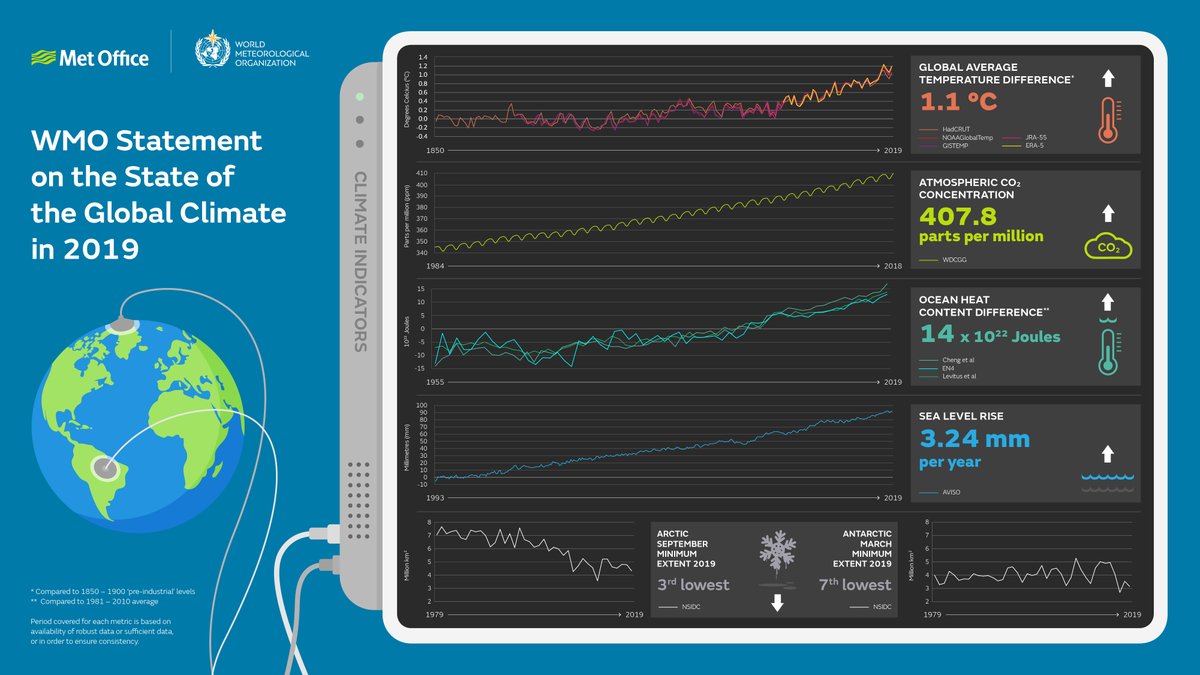 and ocean heat https://abs.twimg.com/emoji/v2/... draggable="false" alt="🌊" title="Water wave" aria-label="Emoji: Water wave">https://abs.twimg.com/emoji/v2/... draggable="false" alt="🌡️" title="Thermometer" aria-label="Emoji: Thermometer">, rising sea levels https://abs.twimg.com/emoji/v2/... draggable="false" alt="⬆️" title="Upwards arrow" aria-label="Emoji: Upwards arrow">https://abs.twimg.com/emoji/v2/... draggable="false" alt="🌊" title="Water wave" aria-label="Emoji: Water wave">, melting ice https://abs.twimg.com/emoji/v2/... draggable="false" alt="❄️" title="Snowflake" aria-label="Emoji: Snowflake">https://abs.twimg.com/emoji/v2/... draggable="false" alt="💧" title="Droplet" aria-label="Emoji: Droplet"> as well as increases in CO2 https://abs.twimg.com/emoji/v2/... draggable="false" alt="⬆️" title="Upwards arrow" aria-label="Emoji: Upwards arrow">" title="The @WMO #StateoftheClimate report published today, highlights further evidence of the physical signs of climate change. Our #infographic shows increasing global temperature https://abs.twimg.com/emoji/v2/... draggable="false" alt="🌡️" title="Thermometer" aria-label="Emoji: Thermometer"> and ocean heat https://abs.twimg.com/emoji/v2/... draggable="false" alt="🌊" title="Water wave" aria-label="Emoji: Water wave">https://abs.twimg.com/emoji/v2/... draggable="false" alt="🌡️" title="Thermometer" aria-label="Emoji: Thermometer">, rising sea levels https://abs.twimg.com/emoji/v2/... draggable="false" alt="⬆️" title="Upwards arrow" aria-label="Emoji: Upwards arrow">https://abs.twimg.com/emoji/v2/... draggable="false" alt="🌊" title="Water wave" aria-label="Emoji: Water wave">, melting ice https://abs.twimg.com/emoji/v2/... draggable="false" alt="❄️" title="Snowflake" aria-label="Emoji: Snowflake">https://abs.twimg.com/emoji/v2/... draggable="false" alt="💧" title="Droplet" aria-label="Emoji: Droplet"> as well as increases in CO2 https://abs.twimg.com/emoji/v2/... draggable="false" alt="⬆️" title="Upwards arrow" aria-label="Emoji: Upwards arrow">" class="img-responsive" style="max-width:100%;"/>
 data sets from @NOAA @NASAGISS @JMA_kishou @ECMWF @MetOffice, reinforce that 2015-2019 were the five warmest years since 1850 says @WMO #StateoftheClimate report" title="1/ Key global temperature https://abs.twimg.com/emoji/v2/... draggable="false" alt="🌡️" title="Thermometer" aria-label="Emoji: Thermometer"> data sets from @NOAA @NASAGISS @JMA_kishou @ECMWF @MetOffice, reinforce that 2015-2019 were the five warmest years since 1850 says @WMO #StateoftheClimate report" class="img-responsive" style="max-width:100%;"/>
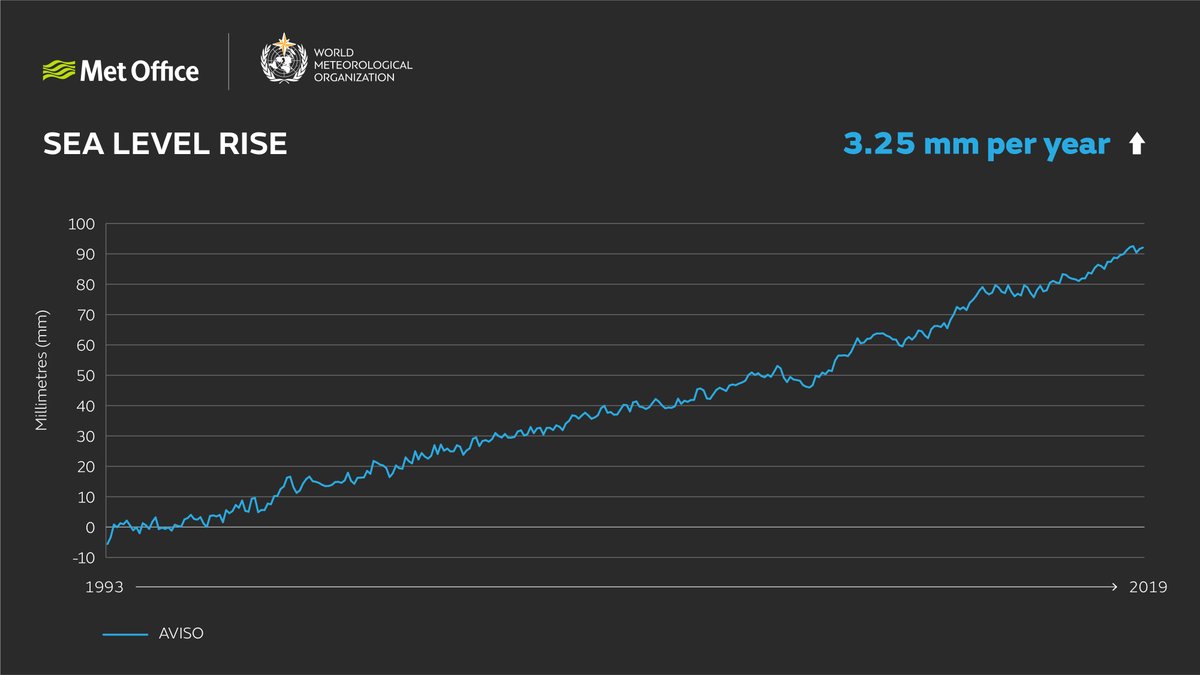 https://abs.twimg.com/emoji/v2/... draggable="false" alt="🌊" title="Water wave" aria-label="Emoji: Water wave">" title="4/ Warming #oceans & #ice loss contribute to global #sealevelrise. Since the start of the satellite record (1993) observations indicate that the global level has been rising at an average rate of 3.25mm per year https://abs.twimg.com/emoji/v2/... draggable="false" alt="⬆️" title="Upwards arrow" aria-label="Emoji: Upwards arrow">https://abs.twimg.com/emoji/v2/... draggable="false" alt="🌊" title="Water wave" aria-label="Emoji: Water wave">" class="img-responsive" style="max-width:100%;"/>
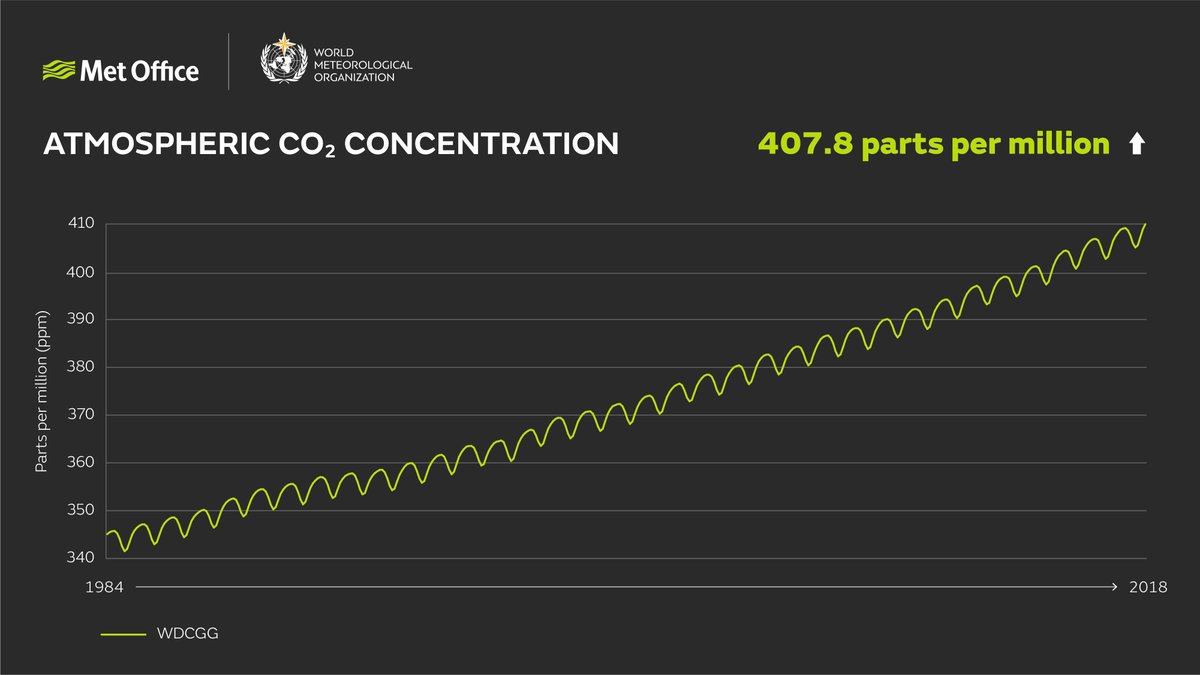 https://abs.twimg.com/emoji/v2/... draggable="false" alt="📈" title="Chart with upwards trend" aria-label="Emoji: Chart with upwards trend"> as highlighted in the @WMO #StateoftheClimate report" title="2/ Data from #WDCGG shows levels of greenhouse gases reached record levels in 2018 with #carbondioxide rising to 407.8ppm https://abs.twimg.com/emoji/v2/... draggable="false" alt="⬆️" title="Upwards arrow" aria-label="Emoji: Upwards arrow">https://abs.twimg.com/emoji/v2/... draggable="false" alt="📈" title="Chart with upwards trend" aria-label="Emoji: Chart with upwards trend"> as highlighted in the @WMO #StateoftheClimate report" class="img-responsive" style="max-width:100%;"/>
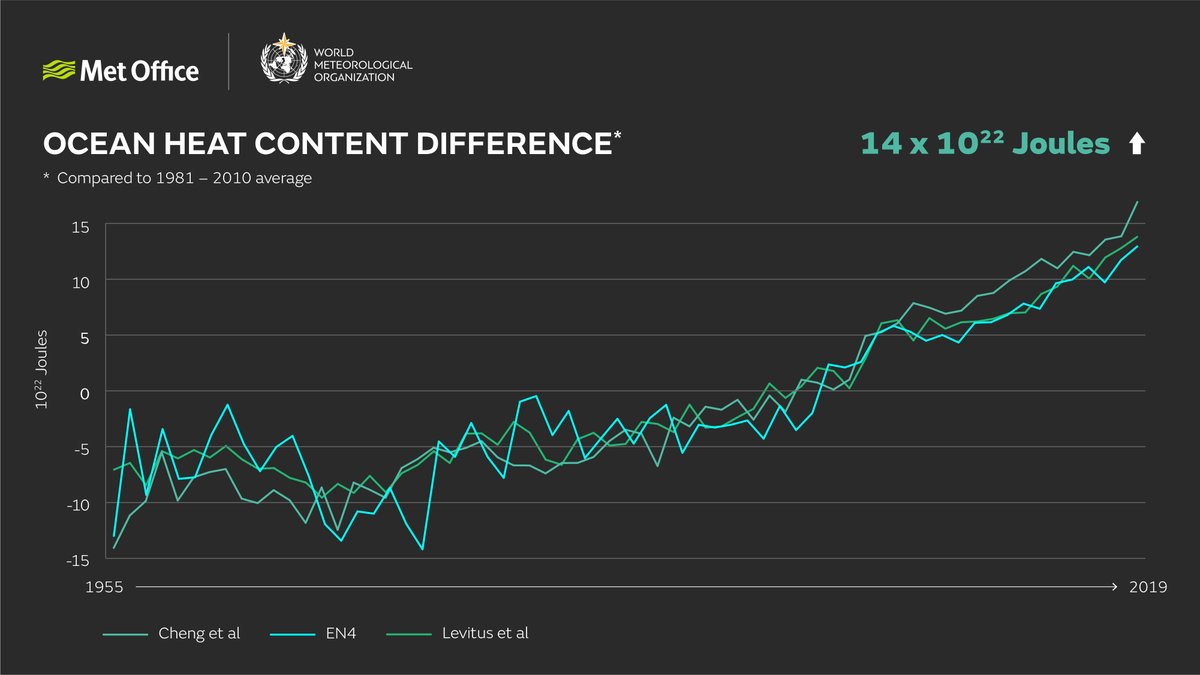 https://abs.twimg.com/emoji/v2/... draggable="false" alt="🌡️" title="Thermometer" aria-label="Emoji: Thermometer"> https://abs.twimg.com/emoji/v2/... draggable="false" alt="⬆️" title="Upwards arrow" aria-label="Emoji: Upwards arrow"> @WMO #StateoftheClimate report" title="3/ The #ocean takes up 90% of energy trapped in the Earth system by greenhouse gases - this is measured by #oceanheatcontent. Three key data sets document how this has been rising since 1955 https://abs.twimg.com/emoji/v2/... draggable="false" alt="🌊" title="Water wave" aria-label="Emoji: Water wave">https://abs.twimg.com/emoji/v2/... draggable="false" alt="🌡️" title="Thermometer" aria-label="Emoji: Thermometer"> https://abs.twimg.com/emoji/v2/... draggable="false" alt="⬆️" title="Upwards arrow" aria-label="Emoji: Upwards arrow"> @WMO #StateoftheClimate report" class="img-responsive" style="max-width:100%;"/>
 sea-ice extent continued in 2019, according to @NSIDC data with several record low months and the 7th lowest annual minimum extent on record https://abs.twimg.com/emoji/v2/... draggable="false" alt="❄️" title="Snowflake" aria-label="Emoji: Snowflake">https://abs.twimg.com/emoji/v2/... draggable="false" alt="💧" title="Droplet" aria-label="Emoji: Droplet">" title="5/ The decreasing trend in #Antarctic https://abs.twimg.com/emoji/v2/... draggable="false" alt="🇦🇶" title="Flag of Antarctica" aria-label="Emoji: Flag of Antarctica"> sea-ice extent continued in 2019, according to @NSIDC data with several record low months and the 7th lowest annual minimum extent on record https://abs.twimg.com/emoji/v2/... draggable="false" alt="❄️" title="Snowflake" aria-label="Emoji: Snowflake">https://abs.twimg.com/emoji/v2/... draggable="false" alt="💧" title="Droplet" aria-label="Emoji: Droplet">" class="img-responsive" style="max-width:100%;"/>
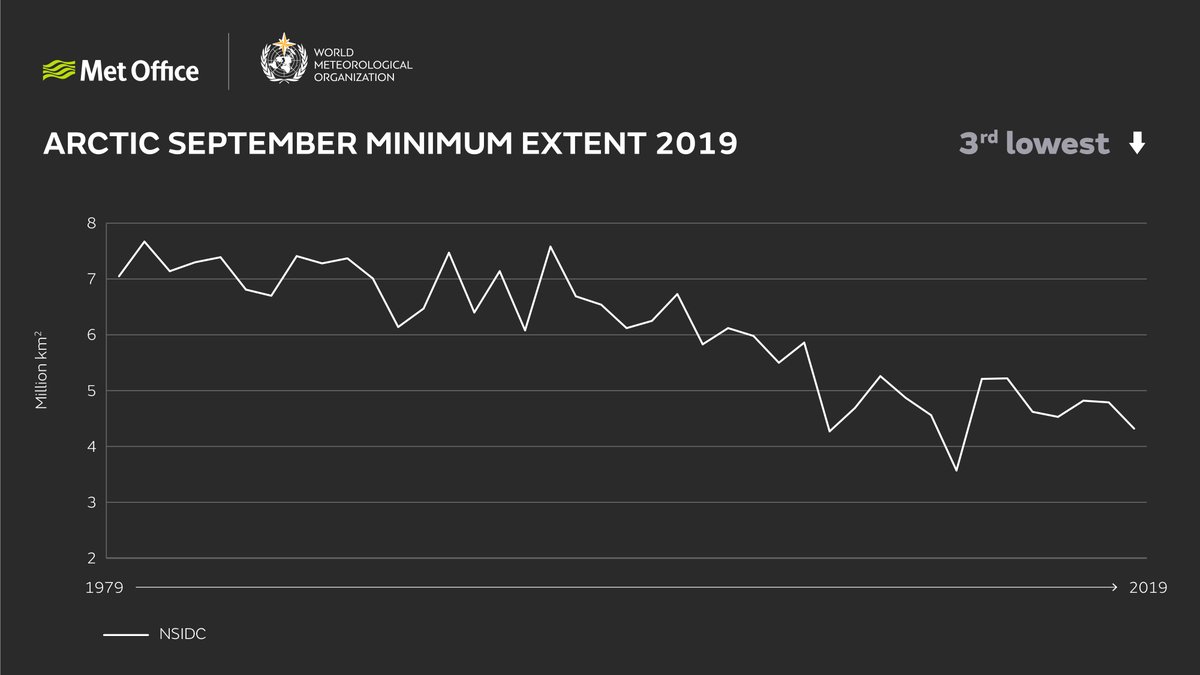 has been declining in all months and minimum monthly extent in September 2019 was the 3rd lowest on record, as per @NSIDC data https://abs.twimg.com/emoji/v2/... draggable="false" alt="❄️" title="Snowflake" aria-label="Emoji: Snowflake">https://abs.twimg.com/emoji/v2/... draggable="false" alt="💧" title="Droplet" aria-label="Emoji: Droplet"> https://abs.twimg.com/emoji/v2/... draggable="false" alt="📉" title="Chart with downwards trend" aria-label="Emoji: Chart with downwards trend">" title="6/ #Arctic sea ice extent https://abs.twimg.com/emoji/v2/... draggable="false" alt="🌊" title="Water wave" aria-label="Emoji: Water wave">has been declining in all months and minimum monthly extent in September 2019 was the 3rd lowest on record, as per @NSIDC data https://abs.twimg.com/emoji/v2/... draggable="false" alt="❄️" title="Snowflake" aria-label="Emoji: Snowflake">https://abs.twimg.com/emoji/v2/... draggable="false" alt="💧" title="Droplet" aria-label="Emoji: Droplet"> https://abs.twimg.com/emoji/v2/... draggable="false" alt="📉" title="Chart with downwards trend" aria-label="Emoji: Chart with downwards trend">" class="img-responsive" style="max-width:100%;"/>


