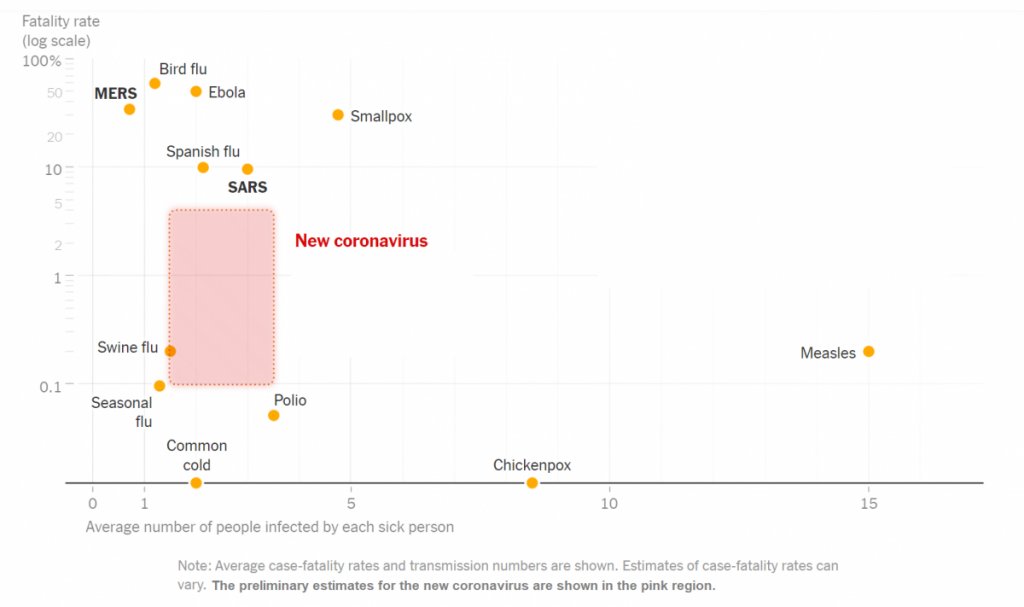
scatterplot to show my stats class Monday: https://twitter.com/ATabarrok/status/1236408123960619009">https://twitter.com/ATabarrok...
Also this infographic (& the embedded thread): https://twitter.com/CT_Bergstrom/status/1236427814393409536?s=19">https://twitter.com/CT_Bergst...
..and as gif! https://twitter.com/SiouxsieW/status/1236721200291655680?s=19">https://twitter.com/SiouxsieW...
I did in fact show my stats class that scatterplot above (pulled from a Tabarrok MR blog post "What Worked in 1918-1919?") https://marginalrevolution.com/marginalrevolution/2020/03/what-worked-in-1918-1919.html">https://marginalrevolution.com/marginalr...
note that Taborrok& #39;s blog post is really just excerpts from this 2007 JAMA paper "Nonpharmaceutical Interventions
Implemented by US Cities During the 1918-1919 Influenza Pandemic" https://jamanetwork.com/journals/jama/fullarticle/208354">https://jamanetwork.com/journals/...
Implemented by US Cities During the 1918-1919 Influenza Pandemic" https://jamanetwork.com/journals/jama/fullarticle/208354">https://jamanetwork.com/journals/...
that scatterplot from this NYT explainer (which they apparently first published at the end of Jan? I came across it at end of Feb) https://twitter.com/poliohunt/status/1223207239860621319">https://twitter.com/poliohunt...
finally, I also showed (as I do for every stats class I teach) OurWorldInData .. and noticed that they published this article last week: https://ourworldindata.org/spanish-flu-largest-influenza-pandemic-in-history">https://ourworldindata.org/spanish-f...
unfort we don& #39;t do any time series stuff in this stats class (which I may soon have to fig out how to teach online?), but ntl will show them this graph tmrw https://twitter.com/HelenBranswell/status/1237362407506313216?s=19">https://twitter.com/HelenBran...
Altho maybe I& #39;ll have to balance that glimmer of hope with this graph https://twitter.com/MarkJHandley/status/1237144386569416712?s=19">https://twitter.com/MarkJHand...
May need to do a review of exponential growth functions (which again is not covered in this traditional stats class)
If you haven& #39;t seen @3blue1brown& #39;s videos, do yourself a favor and visit his YT channel https://twitter.com/3blue1brown/status/1236699162965463040?s=19">https://twitter.com/3blue1bro...
If you haven& #39;t seen @3blue1brown& #39;s videos, do yourself a favor and visit his YT channel https://twitter.com/3blue1brown/status/1236699162965463040?s=19">https://twitter.com/3blue1bro...
Another graph to peruse (from infectious disease epidemiologist, director of @CCDD_HSPH) https://twitter.com/mlipsitch/status/1237353299281575936?s=19">https://twitter.com/mlipsitch...
In fact, here& #39;s a tutorial on mathematical epidemiology they posted https://twitter.com/CCDD_HSPH/status/1222257431230631936?s=19">https://twitter.com/CCDD_HSPH...
Graph below adapted from a *different* 2007 paper on the 1918-19 pandemic than the one I mentioned above..this one a PNAS paper co-authored by @mlipsitch titled "Public health interventions and epidemic intensity during the 1918 influenza pandemic" https://twitter.com/richmintz/status/1237447870128836614?s=19">https://twitter.com/richmintz...
Pubmed link https://www.ncbi.nlm.nih.gov/m/pubmed/17416679/">https://www.ncbi.nlm.nih.gov/m/pubmed/...
Here& #39;s another, cleaner version of that country-by-country confirmed-case (offset) time series graph, this one with a linear vert scale so you can see the familiar exponential growth curve
(also this one originated in Turin!) https://twitter.com/SMerler/status/1237492257458204673?s=19">https://twitter.com/SMerler/s...
(also this one originated in Turin!) https://twitter.com/SMerler/status/1237492257458204673?s=19">https://twitter.com/SMerler/s...
I posted earlier in this thread the link to this @OurWorldInData article... https://twitter.com/OurWorldInData/status/1235299240416595968">https://twitter.com/OurWorldI...
..but only now looking through https://ourworldindata.org/coronavirus :">https://ourworldindata.org/coronavir... "The purpose of this article on COVID-19 is to aggregate existing research, refer to relevant data & allow readers to make sense of the published early research and data on the coronavirus outbreak." https://twitter.com/OurWorldInData/status/1235951563602112513">https://twitter.com/OurWorldI...
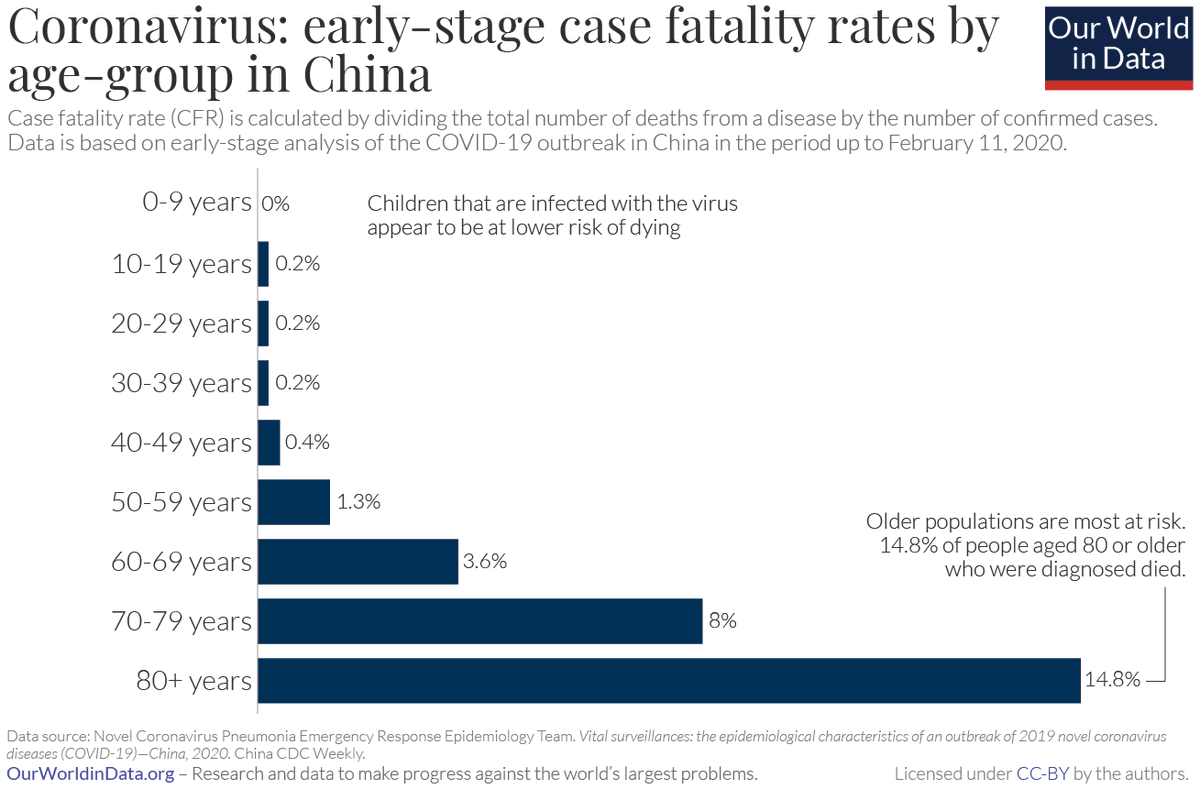
in particular, this is precisely the sort of CFR data I was looking for (to show my stats class today!) #case-fatality-rate-of-covid-19-by-age">https://ourworldindata.org/coronavirus #case-fatality-rate-of-covid-19-by-age">https://ourworldindata.org/coronavir...
interview w @AdamJKucharski that the NYT published last week: https://twitter.com/stevenstrogatz/status/1236457864656543745">https://twitter.com/stevenstr...
Seeing that this medium post is going somewhat viral today (so to speak).. haven& #39;t read it in full yet, but does look v good https://twitter.com/patrickc/status/1237828008771072001?s=19">https://twitter.com/patrickc/...
This is now dated ofc (this was yest 630p) but still fascinating https://twitter.com/CT_Bergstrom/status/1237869774782091267?s=19">https://twitter.com/CT_Bergst...
o1h, I need to get off twitter
otoh, I need to dig into this thread to try to make sense of the data/analyses: https://twitter.com/GlennLuk/status/1237904776911880192">https://twitter.com/GlennLuk/...
otoh, I need to dig into this thread to try to make sense of the data/analyses: https://twitter.com/GlennLuk/status/1237904776911880192">https://twitter.com/GlennLuk/...
Re that Ohio Health Dept estimate (& larger question of estimating prevalence from # of confirmed cases in absence of testing) https://twitter.com/trvrb/status/1238290215178887169?s=19">https://twitter.com/trvrb/sta...
this is what I& #39;m going to try to read thru today: "Clinical course and risk factors for mortality of adult inpatients with COVID-19 in Wuhan, China: a retrospective cohort study" (published 11 March) https://www.thelancet.com/journals/lancet/article/PIIS0140-6736(20)30566-3/fulltext">https://www.thelancet.com/journals/...
So I started this thread on Sat March 7. But I& #39;ll mark the date of when I started getting seriously interested/concerned in the virus as Mon March 2
That& #39;s when I posted NYT& #39;s CFR vs R_0 scatterplot for my stats class to look at:
https://openlab.citytech.cuny.edu/math1372-ganguli-spring2020/2020/03/02/coronavirus-data-statistics/">https://openlab.citytech.cuny.edu/math1372-...
That& #39;s when I posted NYT& #39;s CFR vs R_0 scatterplot for my stats class to look at:
https://openlab.citytech.cuny.edu/math1372-ganguli-spring2020/2020/03/02/coronavirus-data-statistics/">https://openlab.citytech.cuny.edu/math1372-...
I didn& #39;t discuss it in class that Mon/Wed (as I gave an exam on Wed Mar 4!)..but IIRC I got increasingly interested/concerned over the course of that week
Saturday Mar 7 I posted the graph that I started this thread with: "What Worked in 1918-1919?"
https://openlab.citytech.cuny.edu/math1372-ganguli-spring2020/2020/03/09/what-worked-in-1918-1919/">https://openlab.citytech.cuny.edu/math1372-...
Saturday Mar 7 I posted the graph that I started this thread with: "What Worked in 1918-1919?"
https://openlab.citytech.cuny.edu/math1372-ganguli-spring2020/2020/03/09/what-worked-in-1918-1919/">https://openlab.citytech.cuny.edu/math1372-...
Given that we had just covered scatterplots & linear regression, those 2 were very timely
Then on Wed Mar 11 I posted this graph that I pulled from @OurWorldInData& #39;s Coronavirus page: case fatality rates by age-group based on early data out of China:
https://openlab.citytech.cuny.edu/math1372-ganguli-spring2020/2020/03/11/our-world-in-data/">https://openlab.citytech.cuny.edu/math1372-...
so my question is: what should I post for my stats class next?
I& #39;m thinking I should show them what @YIMBY_Princeton has been doing in this evolving thread: https://twitter.com/YIMBY_Princeton/status/1238461386226839552">https://twitter.com/YIMBY_Pri...
I& #39;m thinking I should show them what @YIMBY_Princeton has been doing in this evolving thread: https://twitter.com/YIMBY_Princeton/status/1238461386226839552">https://twitter.com/YIMBY_Pri...
NB: the daily updates in this NJ confirmed cases exponential model experiment go up at 230ET https://twitter.com/YIMBY_Princeton/status/1240344243207647234?s=19">https://twitter.com/YIMBY_Pri...
ran 1st online session w my stats class earlier this aft, using Blackboard& #39;s "Collaborate Ultra"
Just a trial session, to get bunch of us in a Collabo session together, try out features (chat, polls, sharing whiteboard/files/windows)
But couldn& #39;t resist discussing some graphs!
Just a trial session, to get bunch of us in a Collabo session together, try out features (chat, polls, sharing whiteboard/files/windows)
But couldn& #39;t resist discussing some graphs!
(the graphs I discussed yest with my stats class were these CFR rate histograms: for early-stage China, Italy, and South Korea
https://www.facebook.com/sumanganguli/posts/10158105919478373">https://www.facebook.com/sumangang...
https://www.facebook.com/sumanganguli/posts/10158105919478373">https://www.facebook.com/sumangang...
dropping this graph in this thread as thinking my next set of graphs/data will be related to exponential growth https://twitter.com/ryanlcooper/status/1240724802853314563">https://twitter.com/ryanlcoop...
Also this scatterplot from Our World in Data https://twitter.com/OurWorldInData/status/1241036364906463233?s=19">https://twitter.com/OurWorldI...
Another graph for illustrating exponential growth https://twitter.com/JoshNH4H/status/1241147533121982465?s=19">https://twitter.com/JoshNH4H/...
Keeping track of @YIMBY_Princeton keeping track of NJ data (but put the exponential regression model back on the graph pls!) https://twitter.com/YIMBY_Princeton/status/1241426408808816641?s=19">https://twitter.com/YIMBY_Pri...
some more CFRs (but also hospitalization & ICU rates!) from Spain: https://twitter.com/steadyblogging/status/1241924661866377216">https://twitter.com/steadyblo...
got this via our faculty slack, haven& #39;t watched yet..should be good (guy is a prof of mathematical statistics at Univ of Stockholm whose research focuses on modeling infectious disease)
"Mathematics of the Corona outbreak – with professor Tom Britton" https://youtu.be/gSqIwXl6IjQ ">https://youtu.be/gSqIwXl6I...
"Mathematics of the Corona outbreak – with professor Tom Britton" https://youtu.be/gSqIwXl6IjQ ">https://youtu.be/gSqIwXl6I...
a friend has some R scripts to pull daily data from JHU and generate some graphs; now he& #39;s posting them to twitter: https://twitter.com/corona_dt/status/1242181417695617024">https://twitter.com/corona_dt...
here& #39;s the country-level numbers: https://twitter.com/corona_dt/status/1242091309378174977">https://twitter.com/corona_dt...
Dropping this data in this thread https://twitter.com/RARohde/status/1241888412233326592?s=19">https://twitter.com/RARohde/s...
Might be an anomaly..or might be good news in NJ https://twitter.com/YIMBY_Princeton/status/1242528604715651075?s=19">https://twitter.com/YIMBY_Pri...
Thread of FT& #39;s updated log scale graphs https://twitter.com/jburnmurdoch/status/1242561078833426434?s=19">https://twitter.com/jburnmurd...
Including an explainer of log scales! https://twitter.com/jburnmurdoch/status/1242561556795269120?s=19">https://twitter.com/jburnmurd...
Some more graphs/data I want to come back to in this thread https://twitter.com/EricTopol/status/1242551350015062016?s=19">https://twitter.com/EricTopol...
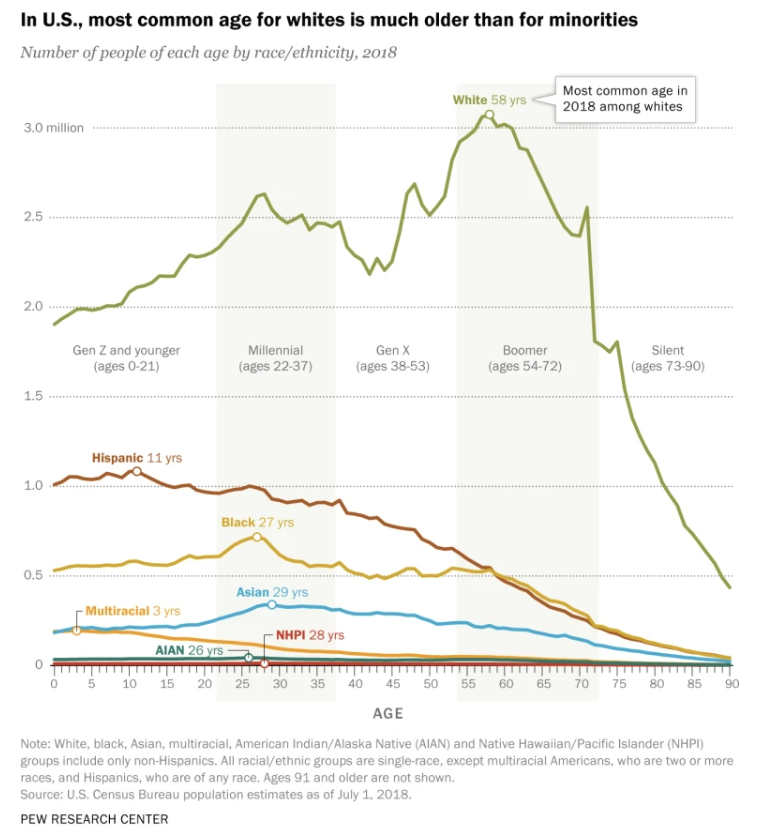
^^that via this @PewResearch Center analysis: https://pewrsr.ch/315iK5e ">https://pewrsr.ch/315iK5e&q...
FT data viz team keeps bringing it https://twitter.com/jburnmurdoch/status/1243299411918295043?s=19">https://twitter.com/jburnmurd...
Thinking about reading this paper https://science.sciencemag.org/content/early/2020/03/24/science.abb3221">https://science.sciencemag.org/content/e...
CFRs and exponential growth... https://twitter.com/Noahpinion/status/1243695884547678208?s=19">https://twitter.com/Noahpinio...
Nice visualization/thread re exponential growth: https://twitter.com/TheRealDoctorT/status/1243936705289338880?s=19">https://twitter.com/TheRealDo...
FT video explainer https://twitter.com/jburnmurdoch/status/1244522229129457665?s=19">https://twitter.com/jburnmurd...
illustrative to see them side by side: https://twitter.com/mattyglesias/status/1244624655341752328">https://twitter.com/mattygles...
Slavitt thread highlights this NatGeo link re NPIs in 1918-19 https://twitter.com/ASlavitt/status/1244828622332080128?s=19">https://twitter.com/ASlavitt/...
I& #39;ve been wondering about St Paul a century ago for the past month (which itself feels like a century ago; cf tweet at top of this thread, quote-tweeting @ATabarrok& #39;s "What Worked in 1918-1919?" blog post) https://twitter.com/mulad/status/1246113850128248833?s=19">https://twitter.com/mulad/sta...

 Read on Twitter


