Have not updated this chart in a while..
But still good..
Above 10d SMA short-term uptrend
Below 10d SMA short-term downtrend.
10d SMA = line in the sand, for short-term swing trading with trailing stops & R/R > 2 https://abs.twimg.com/emoji/v2/... draggable="false" alt="👌" title="Ok hand" aria-label="Emoji: Ok hand">
 https://abs.twimg.com/emoji/v2/... draggable="false" alt="😎" title="Smiling face with sunglasses" aria-label="Emoji: Smiling face with sunglasses"> https://twitter.com/kerberos007/status/1192889969741840384">https://twitter.com/kerberos0...
But still good..
Above 10d SMA short-term uptrend
Below 10d SMA short-term downtrend.
10d SMA = line in the sand, for short-term swing trading with trailing stops & R/R > 2
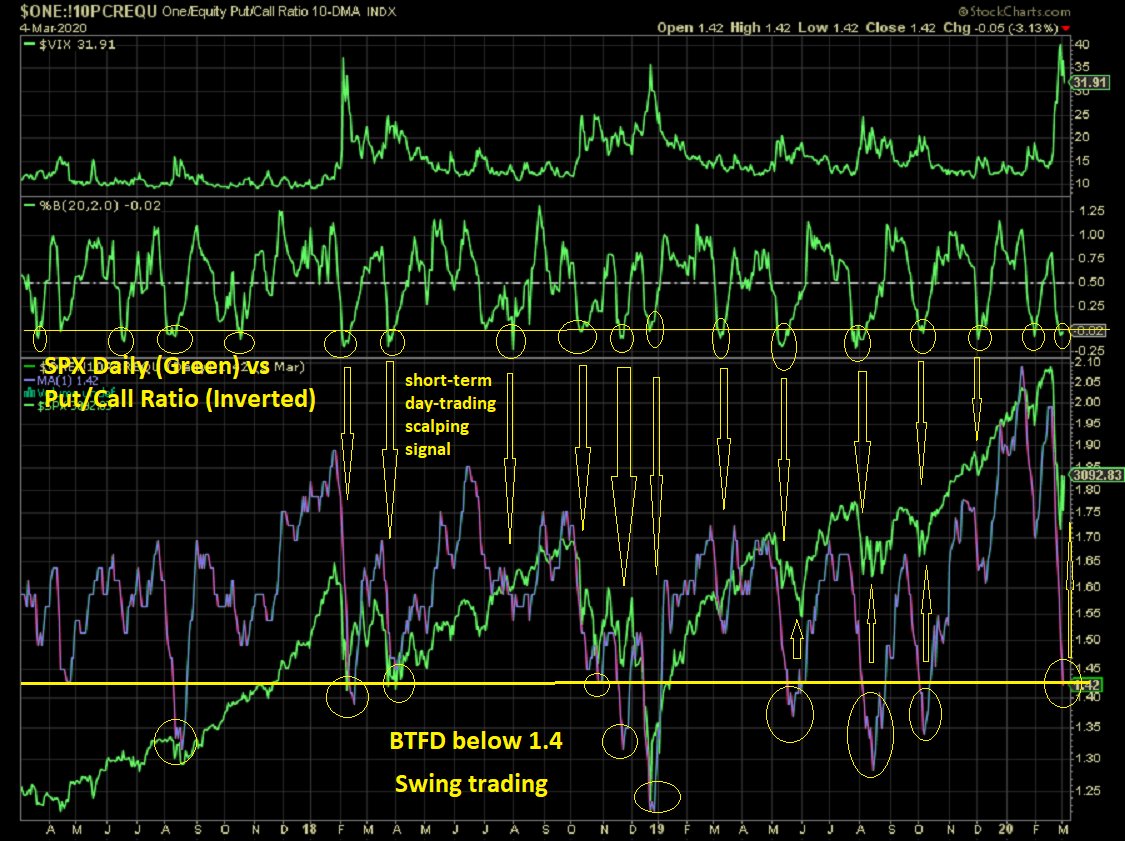
$SPX daily = Green line
Short-term Swing trading &
Day-trading/Scalping signals
1 Using %B(20,2) for scalping/day-trading signal
2 Using absolute value of < 1.4 for short-term swing trading (along with other breadth indicators& #39; confluence)
Updated.
Short-term Swing trading &
Day-trading/Scalping signals
1 Using %B(20,2) for scalping/day-trading signal
2 Using absolute value of < 1.4 for short-term swing trading (along with other breadth indicators& #39; confluence)
Updated.
I post below CBOE stats everyday.
Below table containing tons of useful trading info.
The chart above using the CBOE Equity Put/Call ratio.
Others also good. Looking for confluences. The more the better. https://twitter.com/kerberos007/status/1235043076449558528">https://twitter.com/kerberos0...
Below table containing tons of useful trading info.
The chart above using the CBOE Equity Put/Call ratio.
Others also good. Looking for confluences. The more the better. https://twitter.com/kerberos007/status/1235043076449558528">https://twitter.com/kerberos0...

 Read on Twitter


