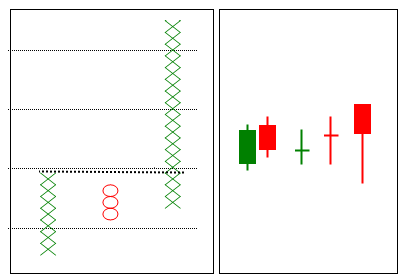
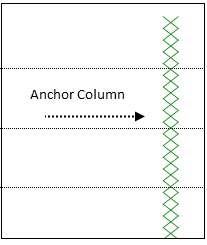
1) Look for Anchor column in Point & Figure. I call Long column of & #39;X& #39;s or & #39;O& #39;s as Anchor column. They represent strong trend / momentum.
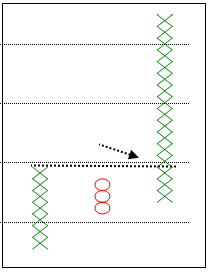
2) Look for breakout in that column. Better if there is a major pattern like bear trap, follow-through etc. At times, price continues to move in the same column and don’t give opportunity to participate in the trend.
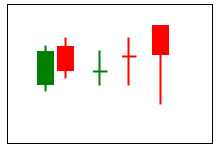
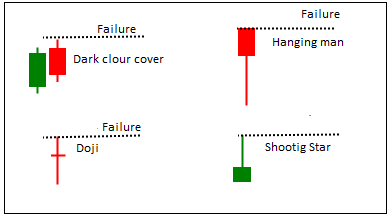
3) Look for bearish reversal pattern on candlestick chart. Narrow range candles, indecision etc that doesn’t result in column reversal on P&F chart.
4) Trade when bearish pattern gets failed. Put a stop-loss below the low of candle. By this, you are trading a failure pattern in instrument in strong momentum and established trend.
Vice versa for bearish trades. Method is objective in nature and can be scanned. More types of analysis can be added for confirmation. Eg Volume, OI etc.
Tried writing a thread to explain it. There are many ways of designing a process by taking advantage of important properties of different charting methods.

 Read on Twitter