After reading this last night, I spent a bit of time throwing a few data series together and doing some rudimentary statistical/regression analysis.
So, I present to you, a thread on Trans-Mountain Apportionment and the YVR rack price. https://globalnews.ca/news/6228998/bc-gas-price-transparency-legislation/">https://globalnews.ca/news/6228...
So, I present to you, a thread on Trans-Mountain Apportionment and the YVR rack price. https://globalnews.ca/news/6228998/bc-gas-price-transparency-legislation/">https://globalnews.ca/news/6228...
First off, a terminology primer.
The "rack price" is the wholesale price retailers pay for gasoline (they add a retail mark it up to this).
I might look at retail vs rack later, but today am focused on determinants of the rack price.
The "rack price" is the wholesale price retailers pay for gasoline (they add a retail mark it up to this).
I might look at retail vs rack later, but today am focused on determinants of the rack price.
Also important to know about apportionment.
Firm& #39;s wanting to ship refined products and crude on Pipelines like Trans Mountain (TM) have to announce or "nominate" volumes ahead of time. They basically ask the pipeline for space to ship.
Firm& #39;s wanting to ship refined products and crude on Pipelines like Trans Mountain (TM) have to announce or "nominate" volumes ahead of time. They basically ask the pipeline for space to ship.
If there is too much demand relative to the size of the pipe, these nominated volumes are "pro-rated" or "apportioned". So, a 30% apportionment rate means a firm gets 30% less capacity then they originally asked for (nominated).
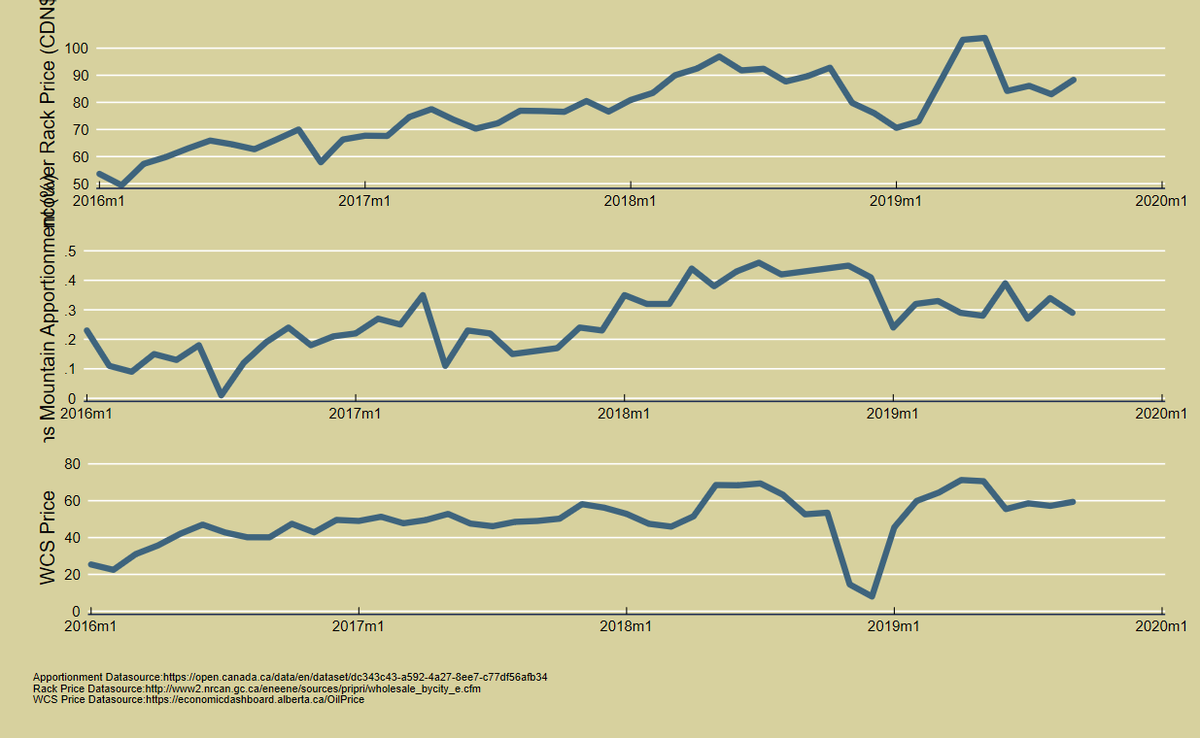
Looking at the rates of apportionment vs the YVR rack price, there sure looks like there might be a relationship between the two.
In fact, if we look at a scatterplot of monthly YVR rack price vs apportionment since Jan 2016, there appears to be a very strong relationship.
BUT! Lots of prices and values in oil markets move together and correlation doesn& #39;t imply causation.
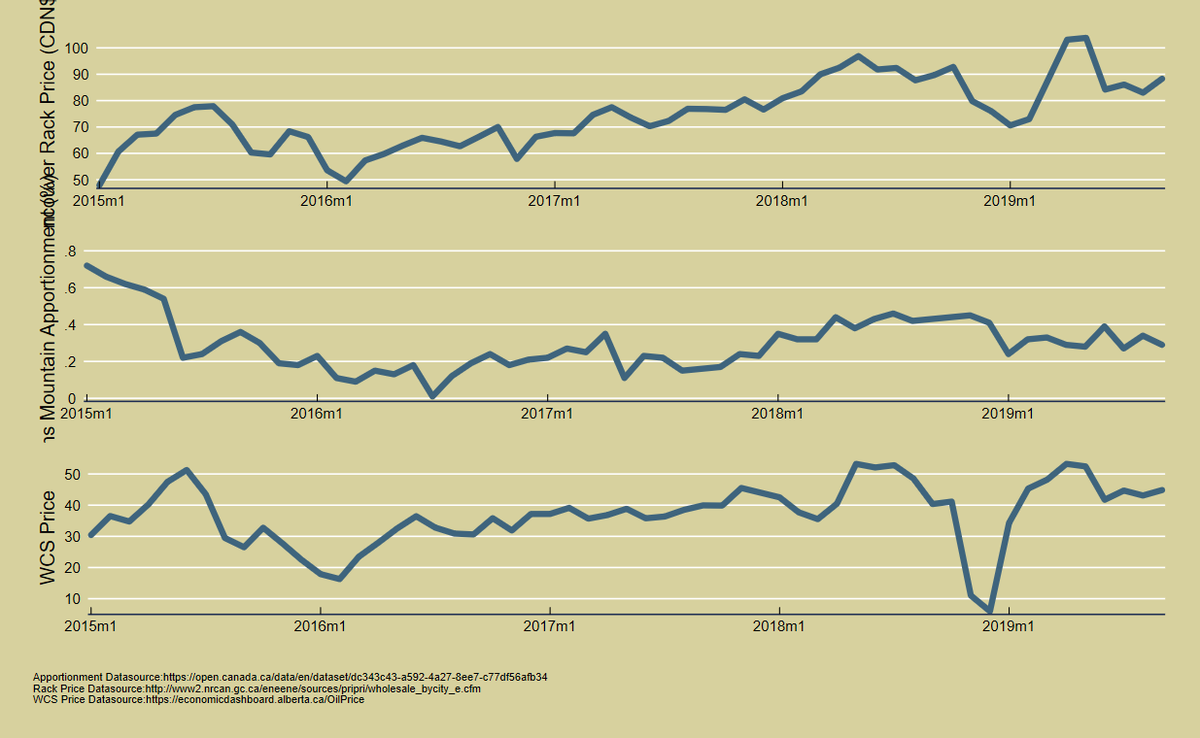
For example, look at the WCS price in relation to both apportionment and YVR rack price.
So, just looking at raw data isn& #39;t really a good strategy here.
For example, look at the WCS price in relation to both apportionment and YVR rack price.
So, just looking at raw data isn& #39;t really a good strategy here.
We need something a bit more sophisticated if we want to examine the relationship between the Trans Mountain pipeline constraint and the YVR rack price.
Enter, simple linear regression. Regression results copied straight out of the STATA window below.
Enter, simple linear regression. Regression results copied straight out of the STATA window below.
By way of interpretation:
64.14411 is the relationship between apportionment and YVR rack. So, if apportionment goes from 0 to 20%, the YVR price rises by about 13 (64x0.2) cents per liter. This is the most important number for our purposes.
64.14411 is the relationship between apportionment and YVR rack. So, if apportionment goes from 0 to 20%, the YVR price rises by about 13 (64x0.2) cents per liter. This is the most important number for our purposes.
0.6447534 is the relationship between the WCS price and YVR rack. It means that as WCS increases by $10 the YVR rack price increases by 6.4 cents.
But Kent, you might say, isn& #39;t there a potential endogeneity problem since increased fuel demand in YVR might be drive increased apportionment.
OK, lets use an instrumental variable regression to deal with the potential endogeneity.
OK, lets use an instrumental variable regression to deal with the potential endogeneity.
Capacity on Trans Mountain varies based on maintenance, outages and seasonality. It is essentially exogenous and is a good candidate to meet the exclusion restriction necessary for IV regression.
The result? An every stronger relationship between Apportionment and YVR rack.
The result? An every stronger relationship between Apportionment and YVR rack.
But Kent, you might say, I don& #39;t like that instrument because <Insert valid reason here>.
OK, lets try another one. Maybe the WTI WCS differential is more to your liking?
The result? An even stronger estimated relationship between Apportionment and YVR rack.
OK, lets try another one. Maybe the WTI WCS differential is more to your liking?
The result? An even stronger estimated relationship between Apportionment and YVR rack.
But Kent, you might say, why use only one or the other, why not both instruments if you think they are valid.
OK FINE! But after this, I& #39;m gonna need you to get off my back.
Also: Basically same result as above.
OK FINE! But after this, I& #39;m gonna need you to get off my back.
Also: Basically same result as above.
So, what does this actually mean?
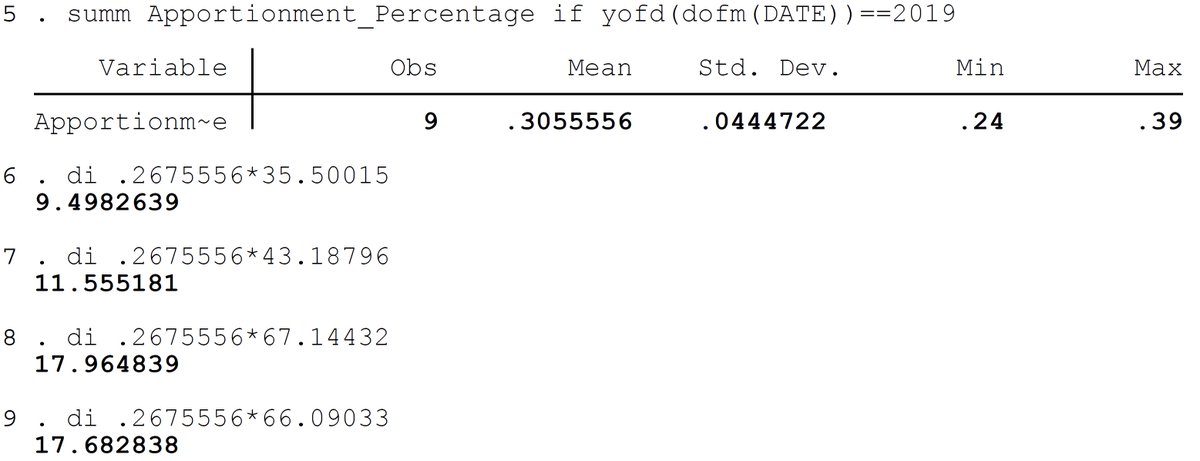
Well, the average apportionment rate for 2019 so far has been about 30%.
So, we can use any of the above estimated parameters (35, 43, 67 and 66) to see what this implies (assuming these results are valid) for the YVR rack price.
Well, the average apportionment rate for 2019 so far has been about 30%.
So, we can use any of the above estimated parameters (35, 43, 67 and 66) to see what this implies (assuming these results are valid) for the YVR rack price.
Look at that, depending on the preferred model, if we trust the regressions, the result is that apportionment (or more specifically, the capacity constraint on the pipe) is able to explain an increase of between about 9.5 cents and 18 cents in the YVR rack price.
Hey #BCPoli, I think I might have found your missing 13 cents.
In all seriousness, and not to be smug, there are different ways to look at this issue, the above statistical exercise is only one of them.
But, I really do believe, that if there is smoke here, the BC govt is looking for a fire in the wrong place. Which is bad public policy.
But, I really do believe, that if there is smoke here, the BC govt is looking for a fire in the wrong place. Which is bad public policy.
Two typos above when describing/interpreting the results of the first posed regression.
(I re-ran the regressions with a few changes just before posting). Look for off thread replies to myself which indicate corrections.
(I re-ran the regressions with a few changes just before posting). Look for off thread replies to myself which indicate corrections.

 Read on Twitter


