Holy to Jews, Christians, and Muslims, modern Jerusalem has been shaped by 3,000 years of worship, conquest, devastation, and rebuilding. For @NatGeo, we worked on how to visualize this in a graphic. THREAD (1/21). https://on.natgeo.com/2pPjazH ">https://on.natgeo.com/2pPjazH&q...
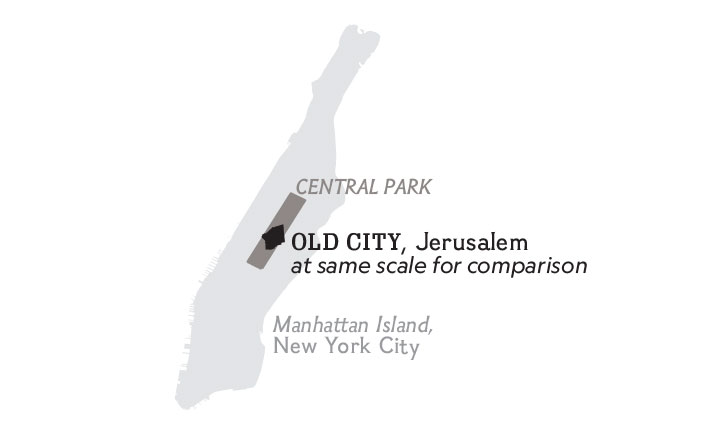
The Old City of Jerusalem is the most disputed piece of land in humanity, but its size is not even a quarter the size of Central Park in New York City.
With different controlling powers came different names. This place of reverence and warfare has been known as Hierosolyma, Yerushalayim, City of David, City of the Great King, Aelia Capitolina, Al Quds, Jerusalem.
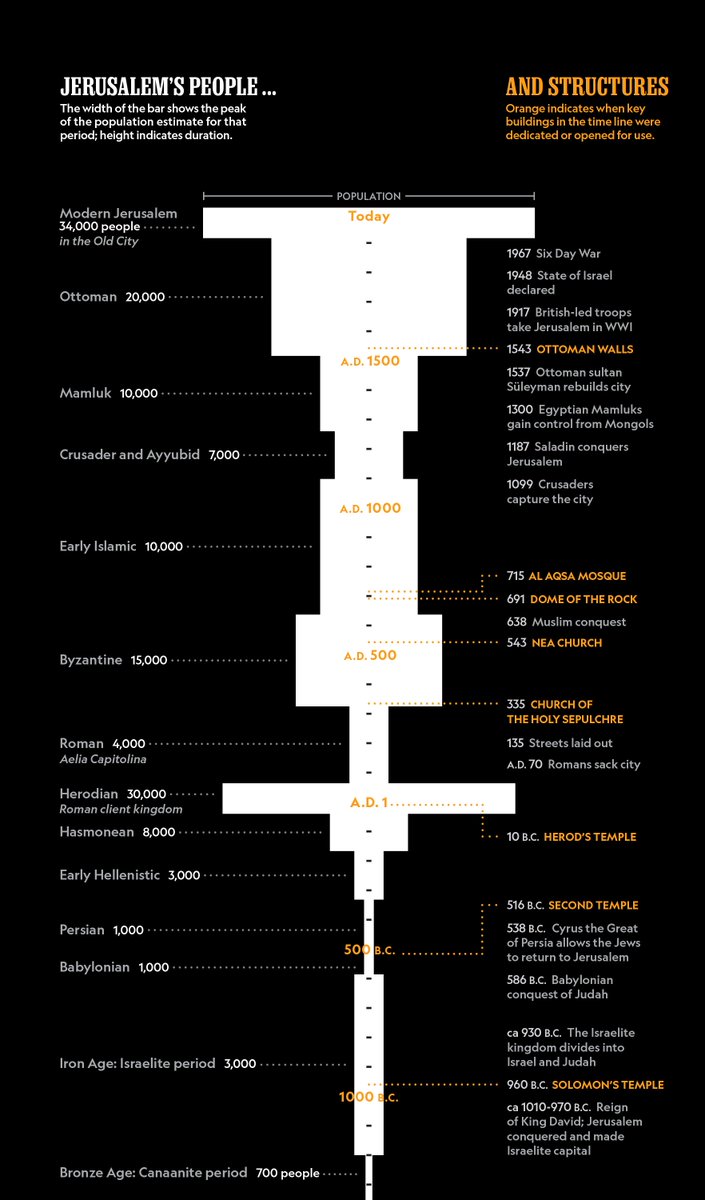
The current population in the Old City is similar to Herodian times (circa A.D.1- Jesus’ times). Today, the Old City is home to more than 34,000 registered residents (thousands more may be uncounted). The last governmental census took place in 2008.
A never before published timeline combining population with key historical events was achieved through a long debate among the greatest experts on the subject.
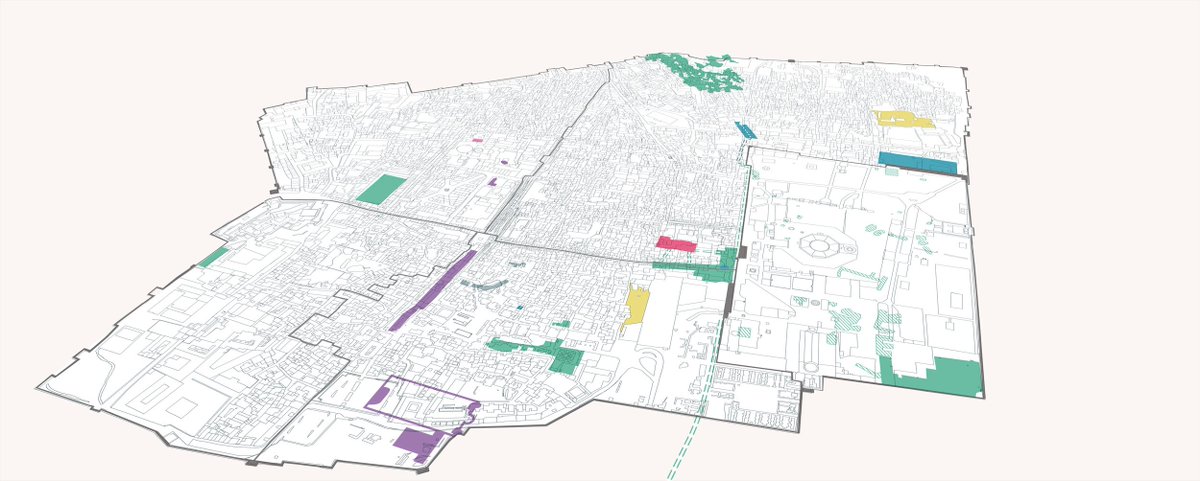
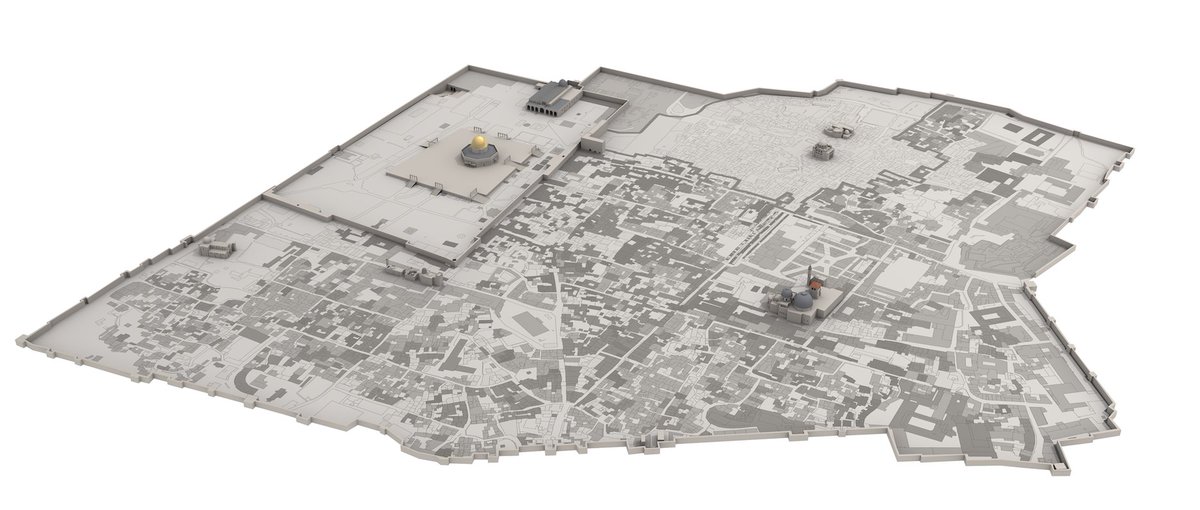
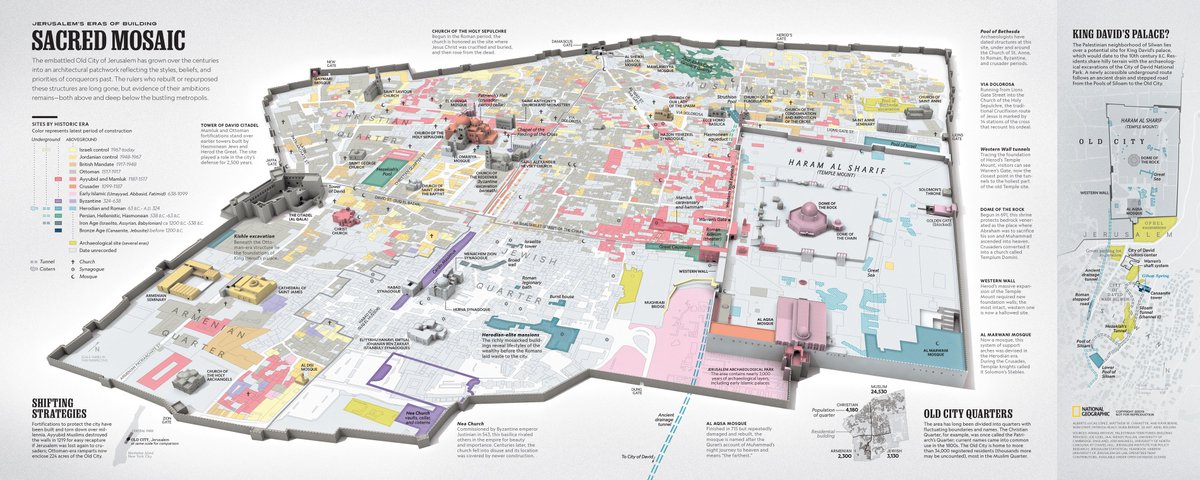
We originally planned to have two separate maps using data from both Israeli and Palestinian sources. One map would show the underground excavated sites, and the other the aboveground, modern day city, with all the buildings color coded by historical period.
Ultimately we found the most dynamic and interesting view was a combination of the two.
Finding accurate data for the archaeological sites under the Old City was very difficult. We ended up working closely with archeologists in Jerusalem, using site plans from each dig, getting them accurately placed and creating geospatial data from them.
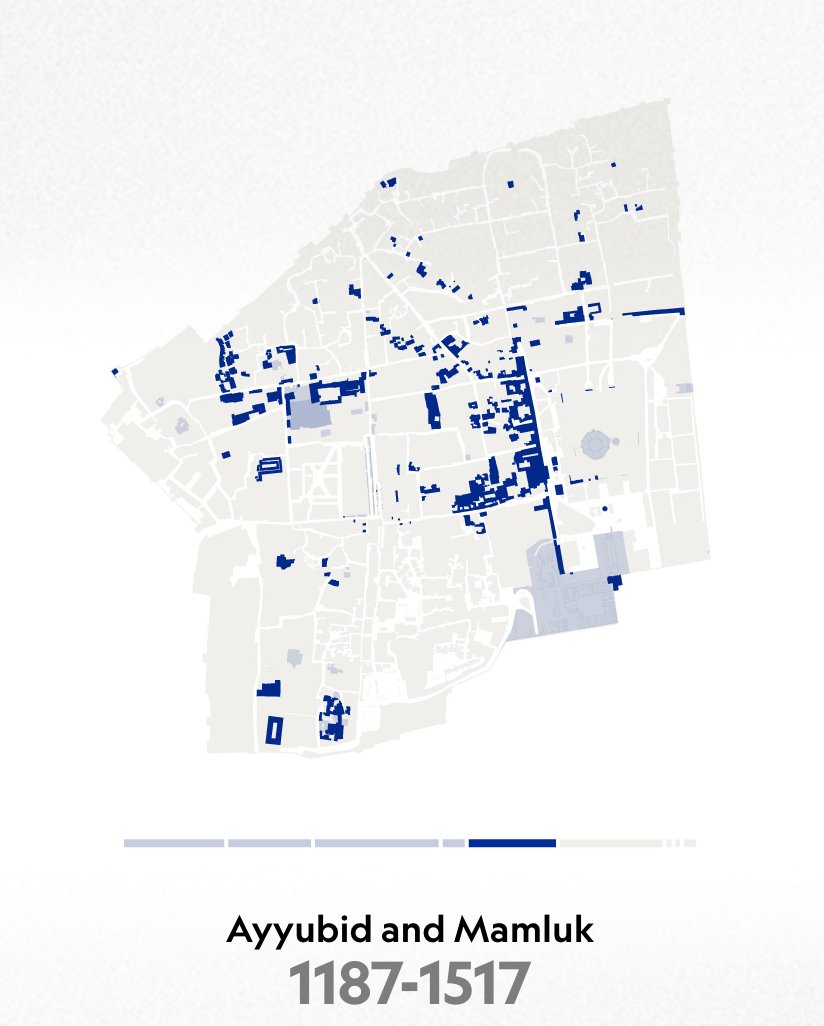
Jerusalem has been conquered at least 11 times in its long history and often that entailed wholesale destruction and rebuilding. For this reason, we decided to color code by the latest era the building was modified.
Aboveground was surprisingly more complicated than we expected. The challenging nature of this area flows into acquiring mapping data. Normally, to create a map of this nature you would secure data from the most authoritative groups, but many are reluctant to share.
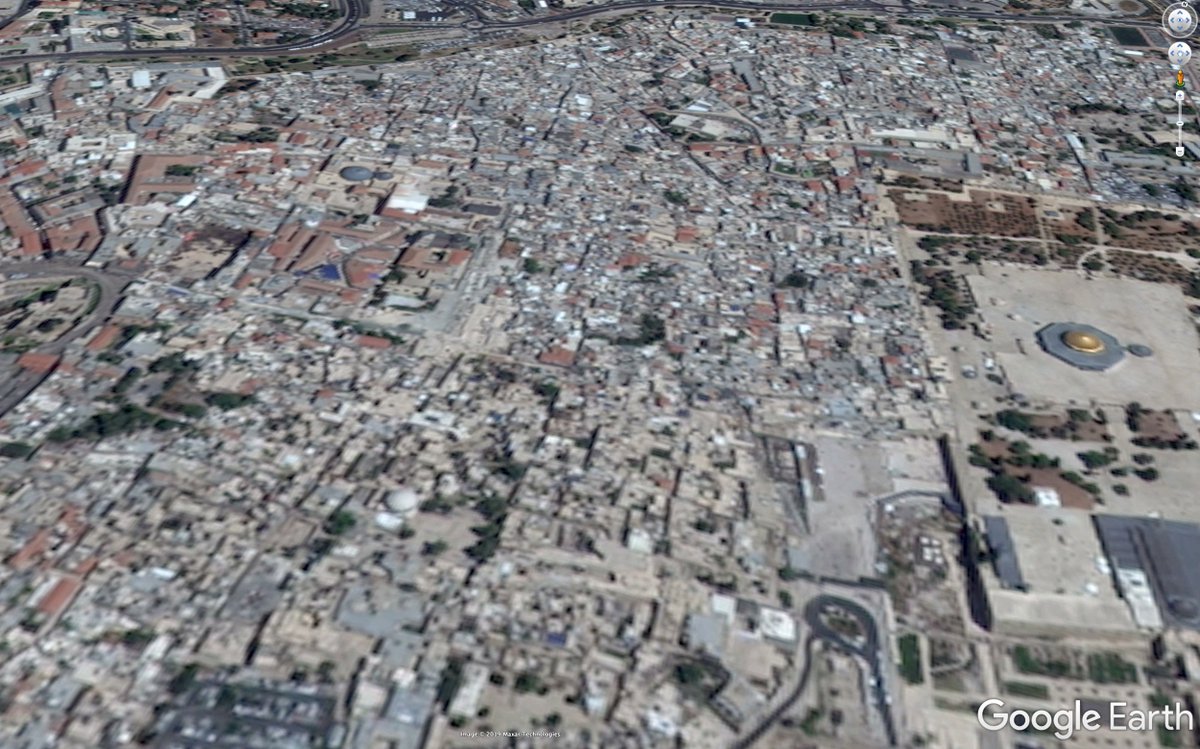
We were forced to work from paper maps and archeological plans. Jerusalem is blurred out on Google Maps due to a 1997 law prohibiting the release of detailed satellite imagery from Israel.
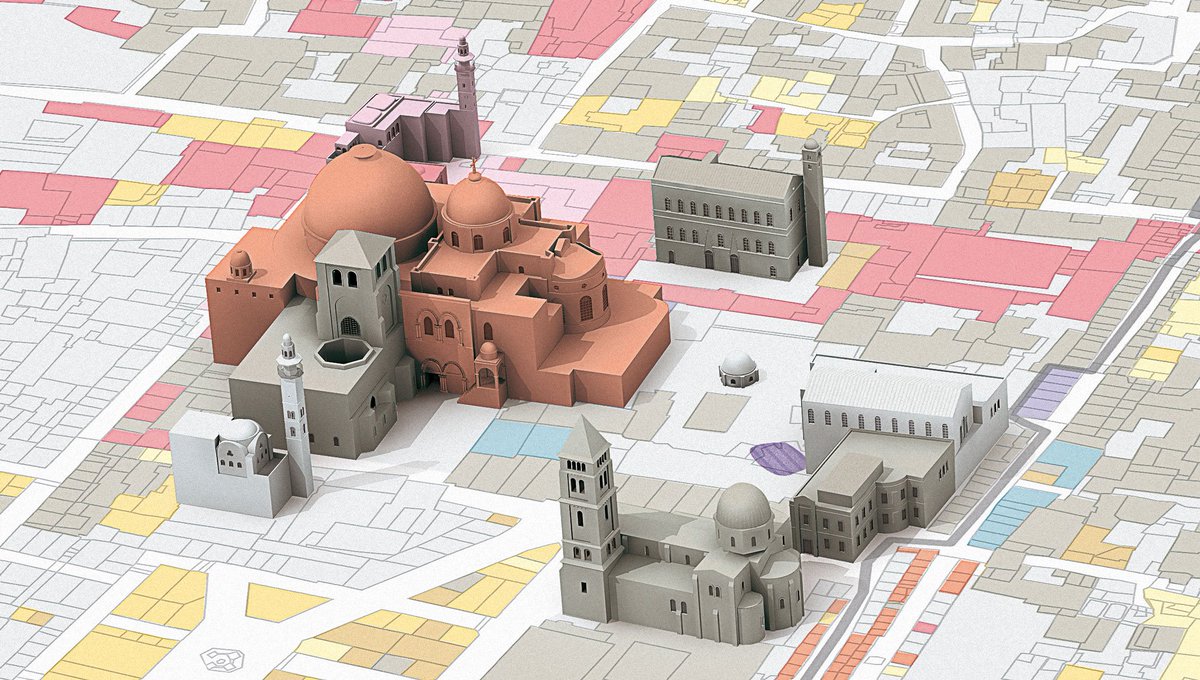
Next, we made the decision to model in 3d some of the most important buildings in the Old City and serve the reader as a reference. These would eventually be colored with the same color code used for historical periods on the map.
Using architectural plans, photographs and text descriptions that included building dimensions, we made detailed 3D models of buildings. Some of the architectural plans were pulled from the website https://bit.ly/2OyWKen .">https://bit.ly/2OyWKen&q... Others from the Library of Congress ( @librarycongress).
As an additional layer, we decided to mark all of the active churches, synagogues, and mosques in the Old City.
To our dismay, the Israeli government keeps track of the synagogues, otherwise there are no official lists publicly available for places of worship, but we managed to dig up a complete list from 2002 compiled by the Jerusalem Institute of Policy Research ( @JLM_Institute).
After translating it from Hebrew, a long process due to most places having multiple names and translations, we pulled 10 maps and 4 atlases of the Old City and began searching for all their locations (thanks @NatGeoLibrary for providing them).
The lesser-known, smaller places of worship were near-impossible to find from our desks in D.C., but since we had a vague sense of their location, we hired a woman in Jerusalem to walk the city and find their exact GPS coordinates.
The Old City of Jerusalem is divided into four quarters named the Christian quarter, the Muslim quarter, the Armenian quarter, and the Jewish quarter. Each has its own vast history. It has been inhabited by residents since the Bronze Era, adding to the complexity of the region.
Within hours of printing, we were notified of a groundbreaking discovery that re-dated the Roman road, requiring us to stop the press and update the map with the new information. https://on.natgeo.com/2BvSlT6 ">https://on.natgeo.com/2BvSlT6&q...
Thousands of work hours went into this; from research to design, to artwork, to mapping, and finally fact checking. This was the most challenging map we have created in all our careers. https://on.natgeo.com/2pPjazH ">https://on.natgeo.com/2pPjazH&q...
Be sure to read the rest of the Under Jerusalem story here: https://on.natgeo.com/2DgDXze ">https://on.natgeo.com/2DgDXze&q...

 Read on Twitter