Black voter turnout in Webster County, Georgia in November elections:
2008: 473
2010: 417
2012: 521
2014: 307
2016: 426
2018: 410
…
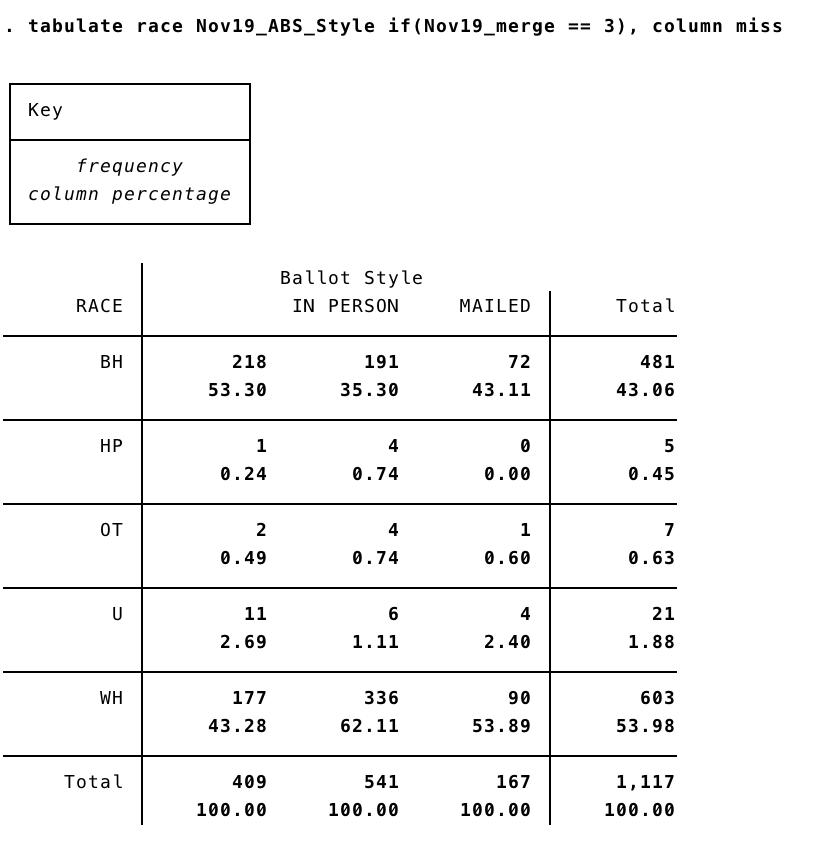
2019: 481
2008: 473
2010: 417
2012: 521
2014: 307
2016: 426
2018: 410
…
2019: 481
White voter turnout in Webster County, Georgia in November elections:
2008: 642
2010: 528
2012: 663
2014: 473
2016: 681
2018: 662
…
2019: 603
2008: 642
2010: 528
2012: 663
2014: 473
2016: 681
2018: 662
…
2019: 603
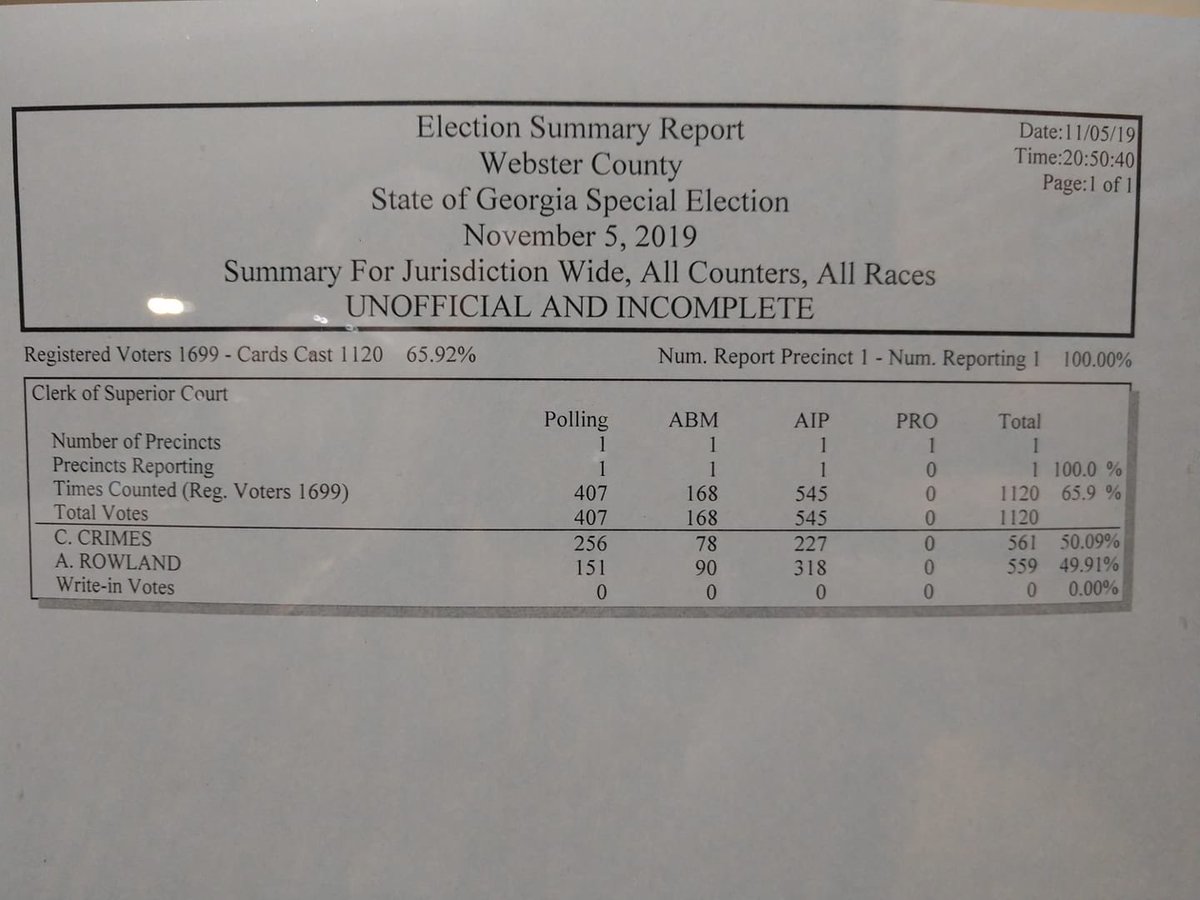
Even Sanford Bishop lost Webster last year, and by a surprisingly wide margin (11.2%). But this year, the county reelected Chekeidra Crimes, a black woman who had been appointed Clerk of Superior Court.
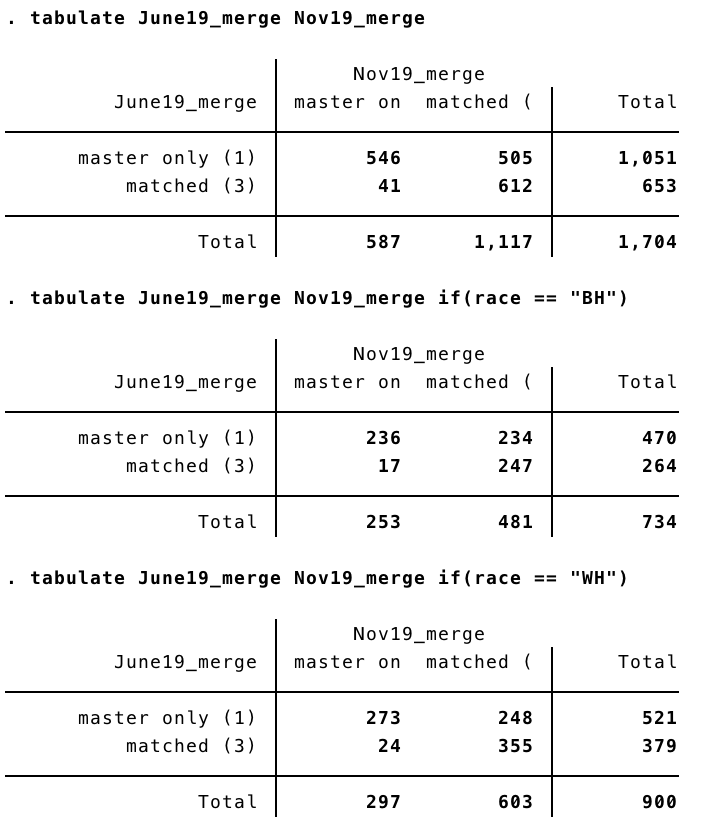
164 of the 1,120 or so voters in the special election this year did not vote in either of the last two general elections. 106 (65%) of those voters were black. (I don& #39;t know how many of them voted in 2012.)
Crimes clearly got significant white support, but the black voter turnout surge and white voter turnout drop were key in her victory.
Hmm. The black voters who showed up this month but not in 2016 or 2018 (table 2) were more likely to be in commission district 3 relative to all black voters this month (table 1) and to all registered black voters (table 3).
That& #39;s where Crimes lives.
That& #39;s where Crimes lives.
(And her father represents the district on the county commission.)
Nearly half (48.6%) of the black voters this month didn& #39;t vote the first time the county tried this election, back in June. That percentage was 41.1% for white voters this month.
For perspective, Webster County’s population shrank by about 150 from 2012 to 2018.
Why were black voters so engaged in this election? @oliviacpaschal provided some insight here: https://twitter.com/oliviacpaschal/status/1199327877466148864">https://twitter.com/oliviacpa...
Interestingly, over 40% of black voters in this election were men, which has not been true in other recent elections in Webster County. Of course, the turnout baseline for black women was higher.
% of currently registered black women in Webster Co. who voted in…
2016: 64.0%
2018: 60.8%
2019: 69.1%
% of currently registered black men in Webster Co. who voted in…
2016: 48.5%
2018: 48.2%
2019: 61.0%
2016: 64.0%
2018: 60.8%
2019: 69.1%
% of currently registered black men in Webster Co. who voted in…
2016: 48.5%
2018: 48.2%
2019: 61.0%
Pretty much all of the turnout drop among black voters there from 2016 to 2018 was in the third commission district, which had a big black turnout jump this year. (The fourth district also had a big jump.)
Interestingly, the Census 2013-2017 estimates from the American Community Survey say that Webster has 990 white citizens over 18 and 990 black citizens over 18 (margins of error are 159 and 180 respectively, so pretty large)

 Read on Twitter


