1/ I& #39;m posting a bunch of charts and data on the current market. I’m not a proponent of market timing, but I think we investors should operate with a dynamic risk appetite that is updated by a probabilistic risk assessment of the market environment ( http://bit.ly/2XHaCr6 ).">https://bit.ly/2XHaCr6&q...
2/ Forward returns aren’t entirely unpredictable. Timeframe is important, of course, but there are hosts of items with varying levels of predictive capacity that can be used for estimating the benefit of taking equity risk at any point in time.
3/ My conclusion (ahead of time) from reviewing these items...
Reevaluating equity risk exposure looks like a particularly prudent and worthwhile activity right now. A focus on defense over offense probably makes sense.
Reevaluating equity risk exposure looks like a particularly prudent and worthwhile activity right now. A focus on defense over offense probably makes sense.
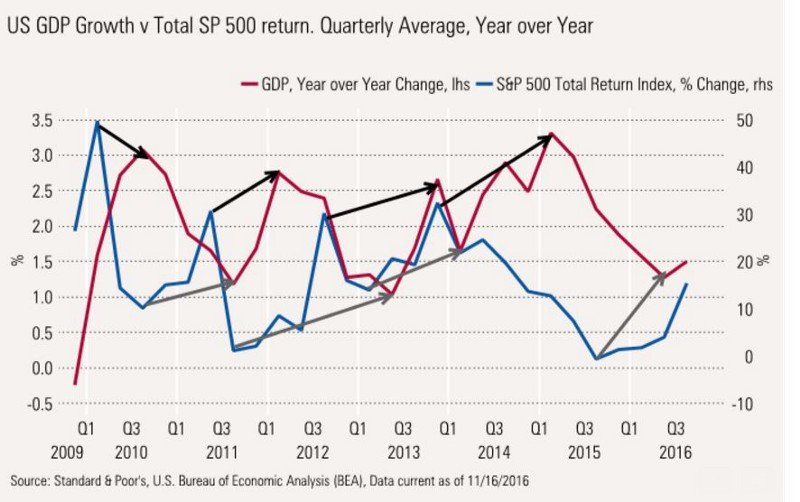
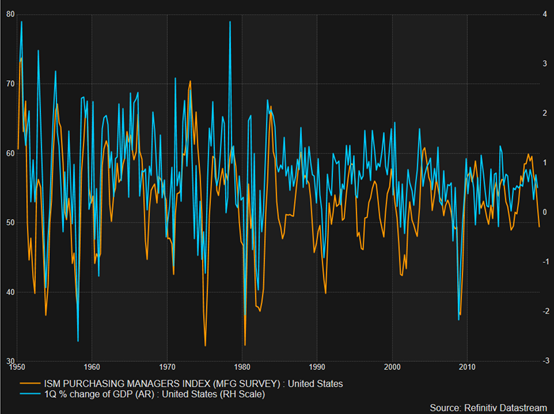
4/ Let& #39;s start by considering the odds of a recession...Why? B/c stock strength and economic activity are typically correlated (although the size of the correlation can vary greatly. See gray arrows below).
5/ Superforecasting methods (HT @PTetlock @wfrhatch) can lend a hand at estimating the odds of a recession, which is a fall in GDP in two consecutive quarters.
The process begins with understanding the base rate ( http://bit.ly/35wiCh7 )">https://bit.ly/35wiCh7&q...
The process begins with understanding the base rate ( http://bit.ly/35wiCh7 )">https://bit.ly/35wiCh7&q...
6/ James Hamilton, a UCSD Econ Prof., points out that in an avg. month during last 70 years, if you predicted, “the U.S. will be in a recession sometime over the next year,” you would have been right 30% of the time (base rate).
(45th min of this speech http://bit.ly/2KQrPJx )">https://bit.ly/2KQrPJx&q...
(45th min of this speech http://bit.ly/2KQrPJx )">https://bit.ly/2KQrPJx&q...
7/ Now let’s do some Bayesian updating ( http://bit.ly/bayesupdt )">https://bit.ly/bayesupdt... by considering evidence that would tilt the odds up or down…
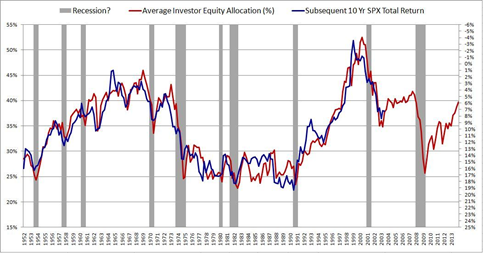
8/ The brilliant author of http://PhilisophicalEconomics.com"> http://PhilisophicalEconomics.com , shows the avg. equity allocation among investors has strong predictive power for 10-year S&P 500 returns.
9/ It isn& #39;t designed to forecast recessions, but the data shows investor equity allocations rise (and forward 10-yr return forecasts typically fall) prior to recessions (note right-hand y-axis is inverted).
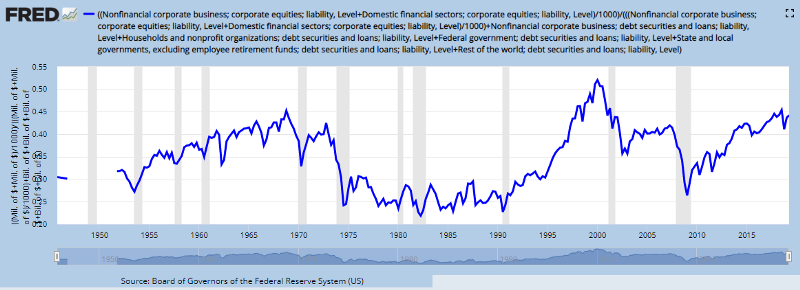
10/ The latest data shows the average investor allocation to equities is 44% and has been rising for years now. This corresponds to 10-year SPY returns of 1–3%.
( https://fred.stlouisfed.org/graph/?g=qis )">https://fred.stlouisfed.org/graph/...
( https://fred.stlouisfed.org/graph/?g=qis )">https://fred.stlouisfed.org/graph/...
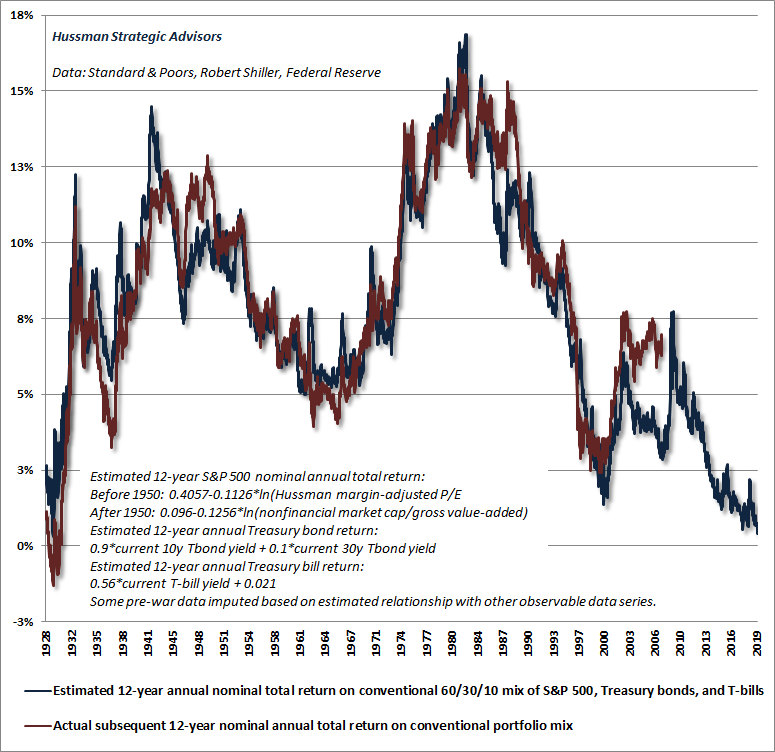
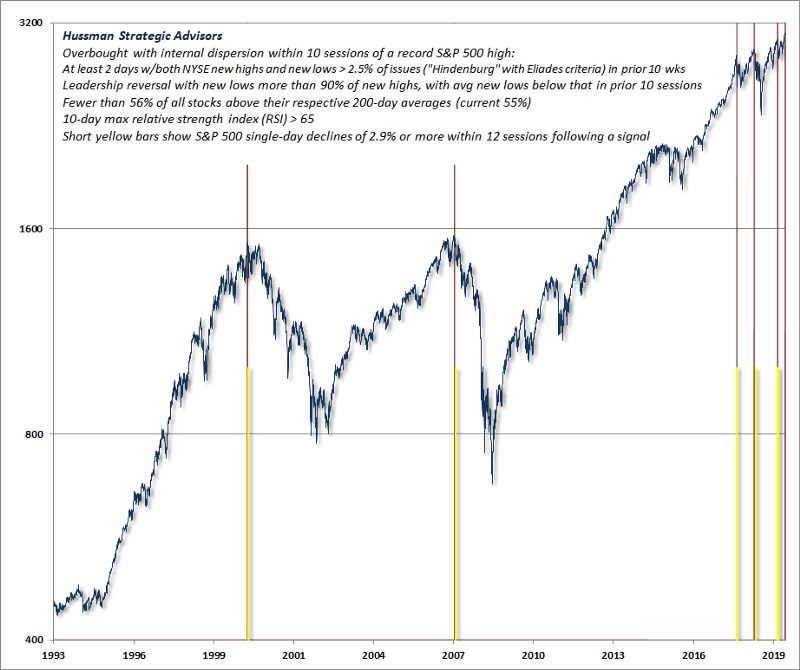
11/ This forecast is in agreement with the forecasts from the brilliant John Hussman too (HT @hussmanjp).
12/ We know from history that 10-year returns are always bumpy. So a 1-3% forecast and knowledge of the vicissitudes of the market (and the YTD 25% return to the S&P) suggests there is an elevated probability of a near-term drawdown.
14/ Weak mrkt internals reflect weak GDP internals. @EconguyRosie notes median sector of GDP stopped growing 2qtrs ago. 30% of GDP is in recession (cap spending and comm. construction in downturns, housing negative in 6/7 past qtrs, exports down, etc.) https://cnb.cx/2Dh1XCo ">https://cnb.cx/2Dh1XCo&q...
15/ Key question, when does this hit the consumer?
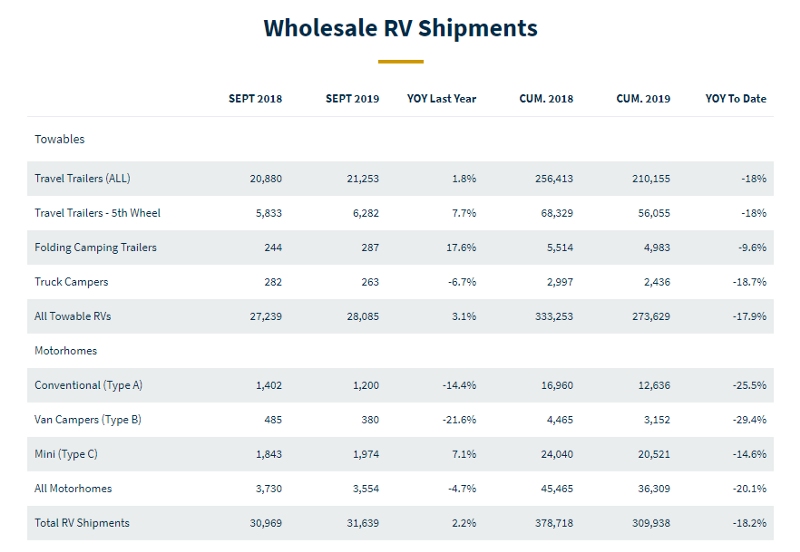
Perhaps it already has...RV demand is down nearly 20% yoy...
Perhaps it already has...RV demand is down nearly 20% yoy...
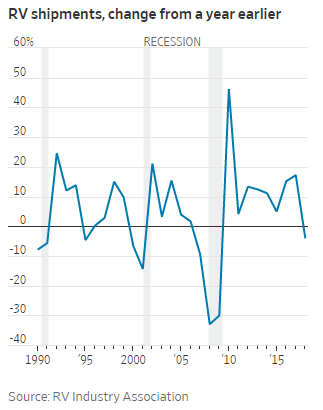
16/ RV sales are a useful indicator for forecasting economic growth. Sales growth has turned negative prior to the last three recessions since the late 1980& #39;s...
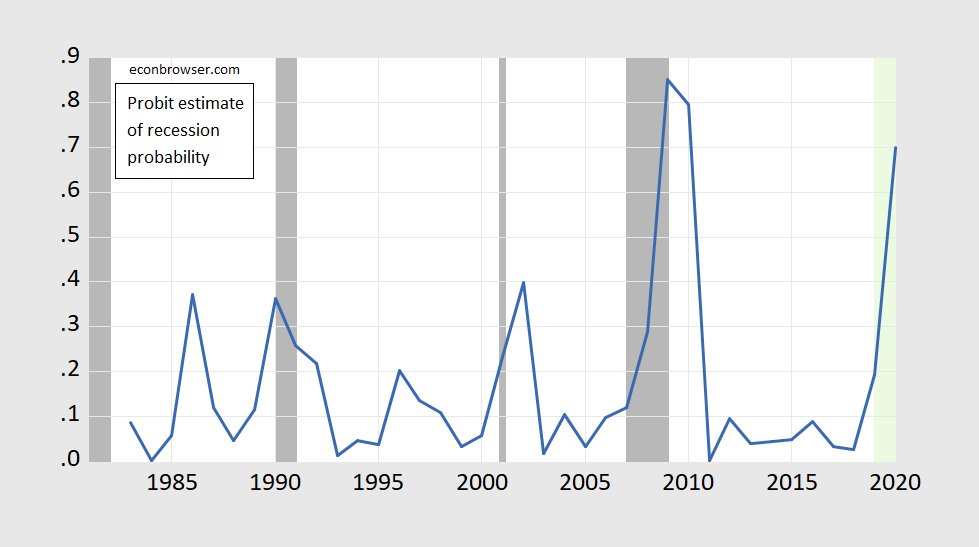
17/ UCSD Econ prof. James Hamilton has noted the correlation between recessions and growth in RV sales ( http://bit.ly/2XKfkEo ).">https://bit.ly/2XKfkEo&q... Recently he ran a probit regression from 1983 to 2019 and he obtains a 70% probability of recession for 2020.
( http://bit.ly/2DiwCio )">https://bit.ly/2DiwCio&q...
( http://bit.ly/2DiwCio )">https://bit.ly/2DiwCio&q...
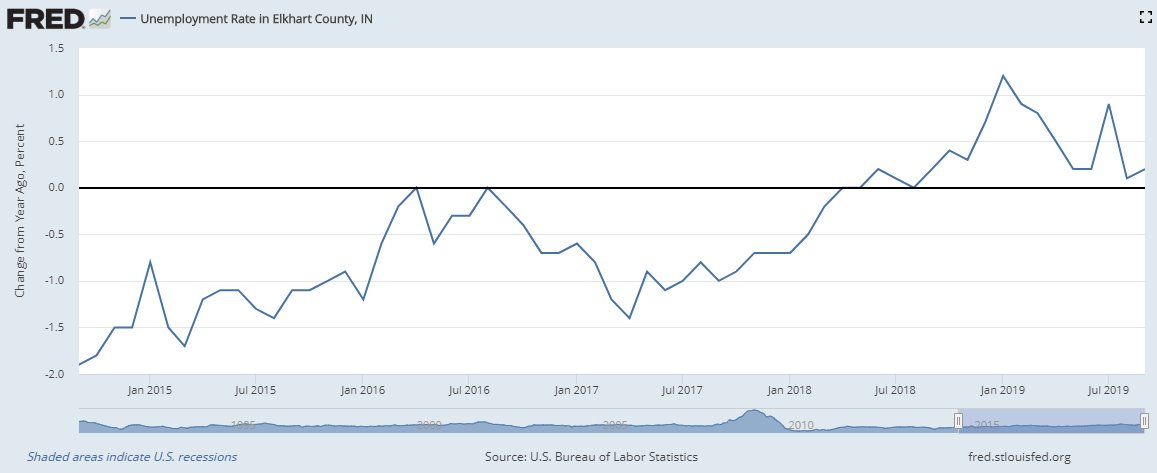
18/ A leading indicator of RV sales are unemployment trends in Elkhart, Indiana (the capital of RV manufacturing) and unemployment has been trending higher...
19/ Recently Elkhart-based RV manufacturer, Thor Industries Inc. ($THO) slashed output and announced it was cutting back its staff to a four-day workweek... https://www.wsj.com/articles/one-countys-rv-industry-points-to-recession-around-the-bend-11566207001">https://www.wsj.com/articles/...
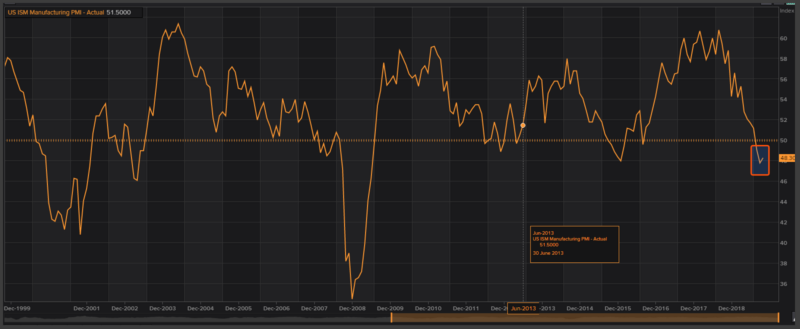
20/ And for manufacturers, a recession may already be underway. The ISM has been below 50 for two periods in a row now. It expanded from 47.8 to 48.3 recently but that just means the rate of contraction is slowing.
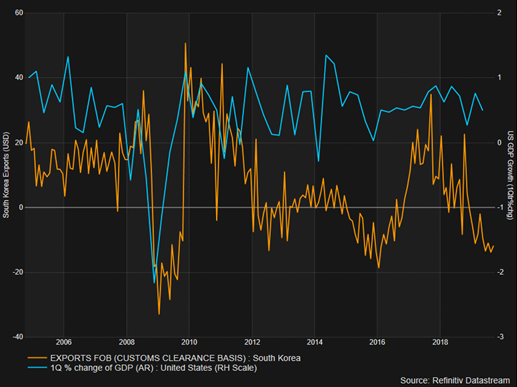
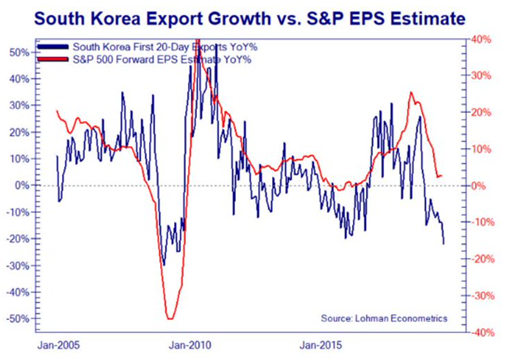
22/ S. Korean Exports are also contracting (5th largest exporter in world). And their biggest export category are Integrated Circuits (go into circuit boards, semi. devices, etc.) Falling demand for ICs -> falling demand for products U.S. companies sell -> lower future US GDP.
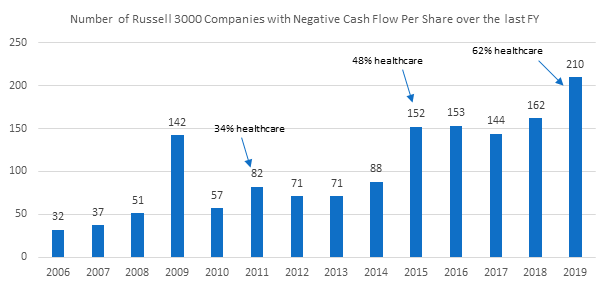
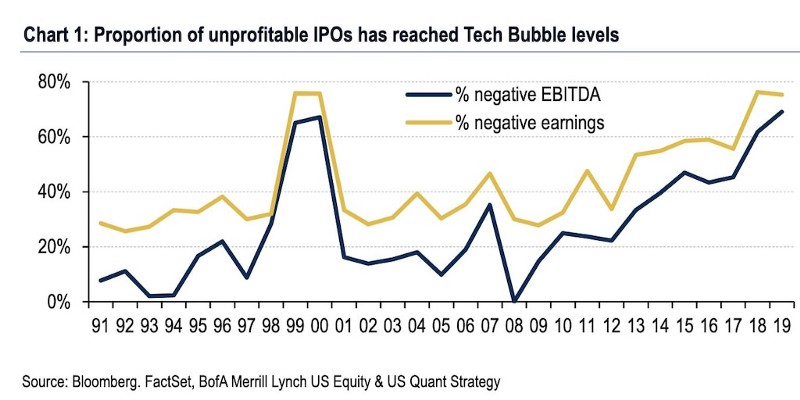
24/ Another recession indicator is investor risk appetite. Investor exuberance tends to precede recessions and risk appetites look extended and set to mean revert. Over 200 companies in the Russell 3000 have negative cash flow.
25/ 62% of these are healthcare firms, up from 34% in 2011, but healthcare as a percentage of the equity market has been relatively steady at 12–16%. Investors are taking more risk betting on speculative companies. What happens when risk appetites mean revert?
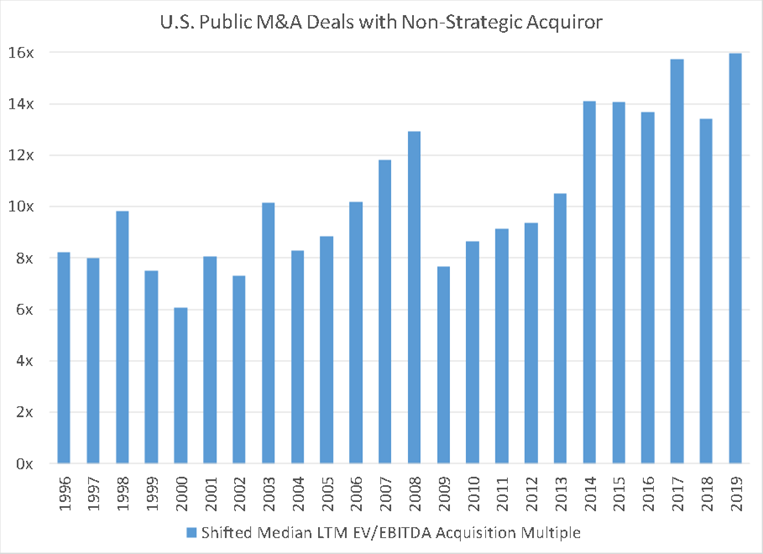
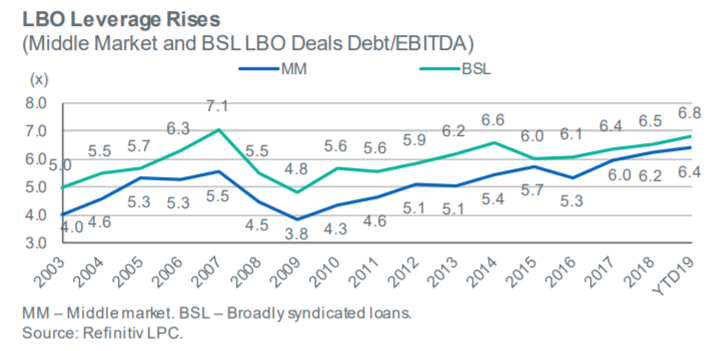
27/ And Private Equity firms are taking more risk too (HT Dan Rasmussen @verdadcap). They are paying record EV/EBITDA multiples (i.e. accepting record low earnings yields)…
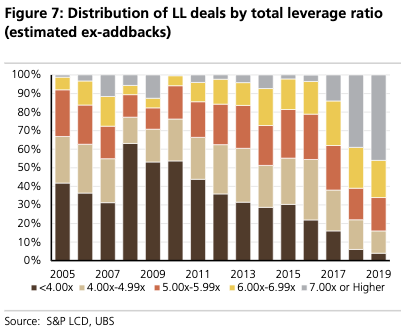
29/ This has fueled a leveraged loan market where 55% of loans have leverage greater than 7x (UBS estimate)…
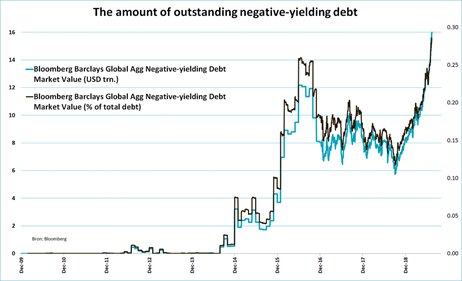
31/ This corresponds to a total debt market with over $16 trillion in negative-yielding instruments (first time ever). More than 28% of outstanding debt, tracked by the Bloomberg Barclays Global Aggregate Index, recently came with a yield below 0%.
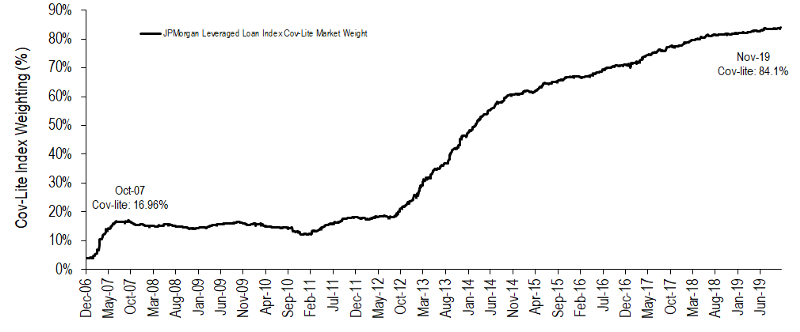
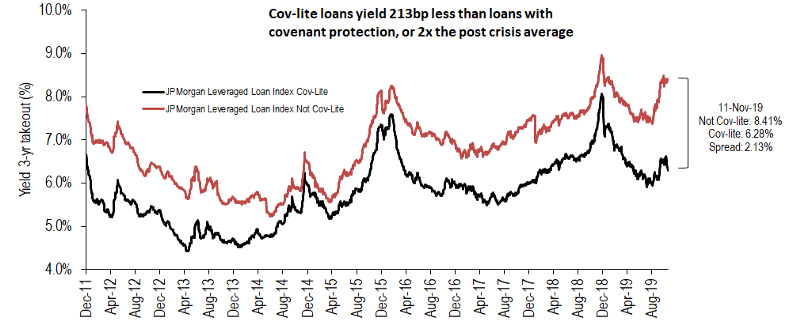
32/ But risk appetites may be shifting. The buyers of leveraged loans recently began demanding higher yields for the risk they are taking…
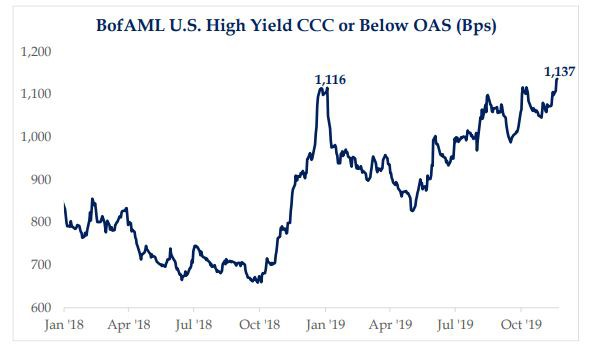
33/ And Strategas (HT @StrategasRP) notes “Spreads of U.S. HY CCC or below rated companies have been grinding higher and are now above the levels seen during the equity market sell-off in 4Q ’18. The significant difference of course, now is the S&P is at all-time highs.”
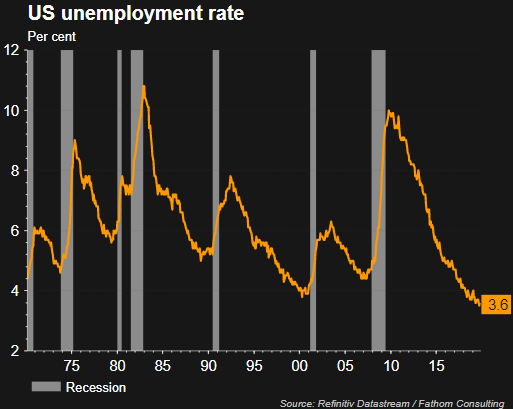
34/ The long-term national unemployment picture also doesn& #39;t impart confidence. It’s hard to fall off the floor…
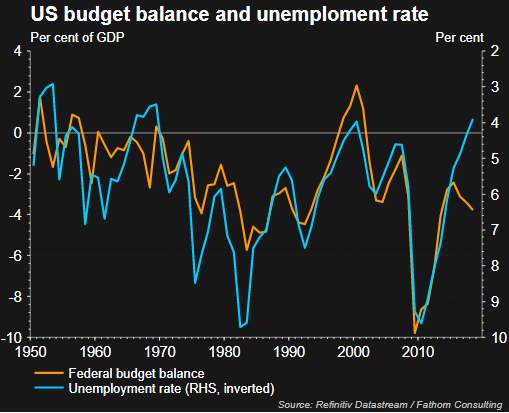
35/ There is also an interesting relationship between the U.S. federal surplus/deficit as a % of GDP and U.S. Unemployment. The budget balance signals unemployment is about to rise…
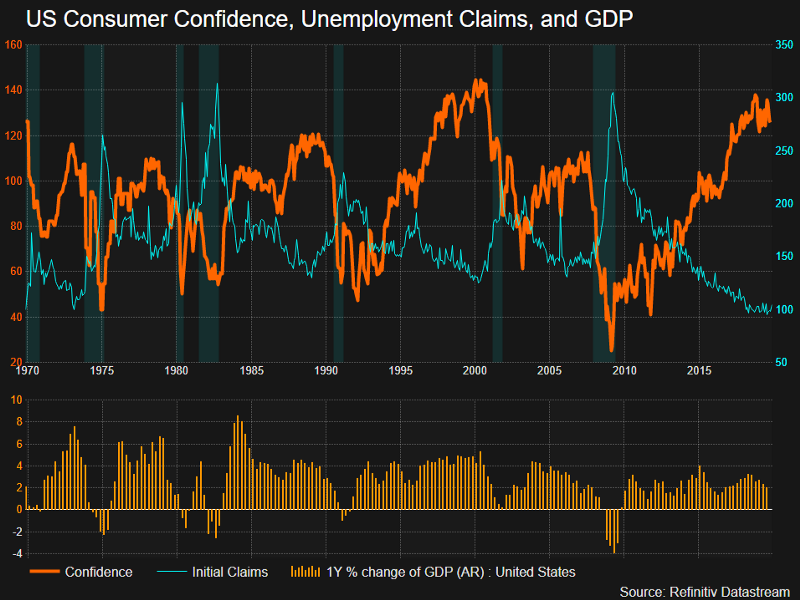
36/ And consumer confidence also appears to be near an all-time high. History shows it tends to peak prior to GDP contractions and recessions (shaded areas).
37/ The above is not an exhaustive list of indicators by any means, but each item is helpful to consider in updating the base rate odds of a recession and drawdown.
38/ Based on the items above, it appears the odds of a recession are likely much higher than the base rate. Perhaps 50% or higher for 2020.
39/ The second step of a risk assessment is forecasting the damage, i.e. the magnitude of a drawdown if a recession occurs. The idea is to get a sense of the expected value of continuing to take meaningful equity risk right now.
40/ And again, we can look to history for a base rate to inform our expectation...
There have been 10 bear markets since 1926 with an average cumulative loss of 38%. (HT @ftportfolios)
http://bit.ly/2shKt6D ">https://bit.ly/2shKt6D&q...
There have been 10 bear markets since 1926 with an average cumulative loss of 38%. (HT @ftportfolios)
http://bit.ly/2shKt6D ">https://bit.ly/2shKt6D&q...
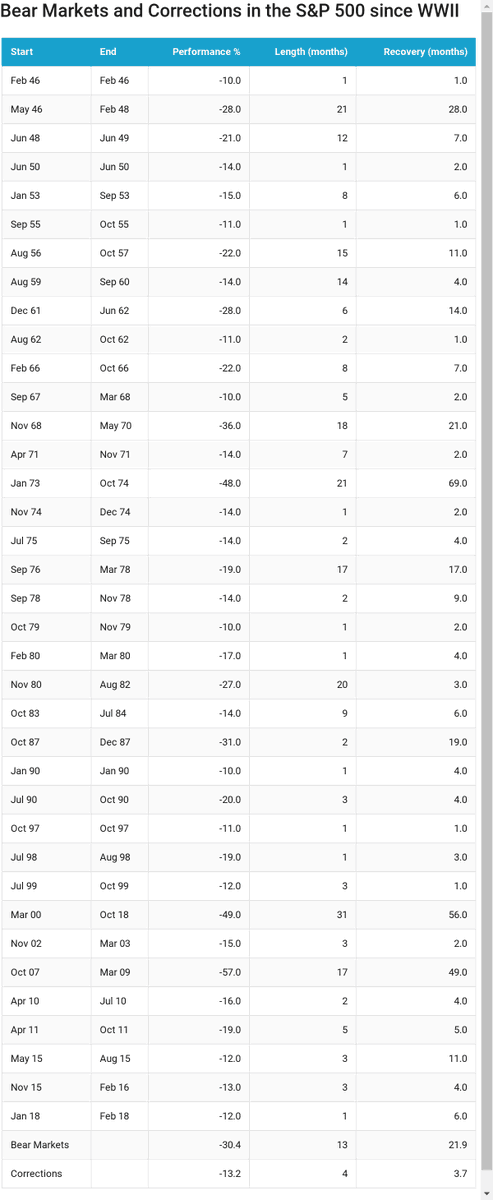
41/ Only 6/10 of the bear markets in the chart coincided with recessions. The chart also shows that the market only slipped a few percentage points during some recessions, so a recession doesn& #39;t always mean large equity drawdowns.
42/ So it& #39;s possible we only see a correction, and since WWII, the average correction has been about 13% and lasted only four months (data is a bit stale, but helpful nonetheless). https://www.cnbc.com/2018/10/26/the-stock-market-loses-13percent-in-a-correction-on-average.html">https://www.cnbc.com/2018/10/2...
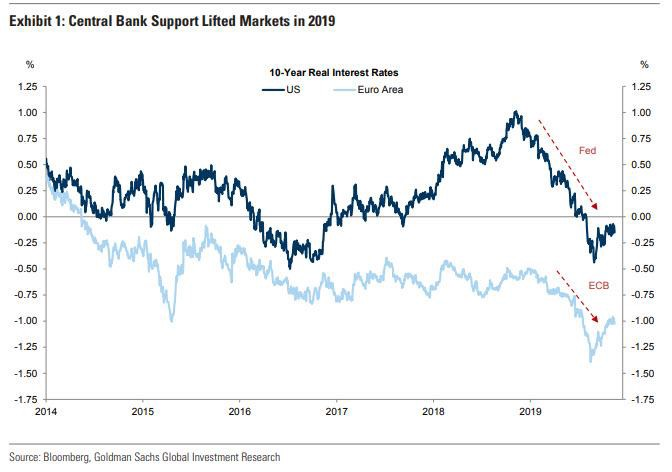
43/ What prevents a recession? Perhaps continued support from central banks. One argument is the only reason the S&P 500 is up 25% this year is because of central bank support…
44/ So, (licks finger and sticks it up into the wind) perhaps the odds of a recession are, say, 50% in 2020. The magnitude of likely losses are probably somewhere between mid-teens to > 30%.
45/ If we don& #39;t see a recession, perhaps central banks buoy the market and investors receive the average long-term equity return of the market in 2020, say ~10%.
46/ We have 50% * negative 13% to negative 30%, plus 50% * +10%. That amounts to an expected value (expected reward) for taking equity risk into 2020 that is negative, meaning the odds are, according to this math, it is probably prudent to focus on defense right now, not offense
47/ The point of this is not to forecast stock market returns, but to embrace a process that can help steer us toward reasonable expectations to guide research. The potential risk of playing defense too early is missing out on the excitement of the 9th inning of returns.
48/ Depending on who you manage money for, that is a tradeoff that should probably be made. Errors of omission are generally preferred to errors of commission (HT WB) and FOMO is not a prudent investment strategy (HT @HowardMarksBook). https://www.oaktreecapital.com/docs/default-source/memos/latest-thinking.pdf?sfvrsn=2">https://www.oaktreecapital.com/docs/defa...

 Read on Twitter