Happy #FibonacciDay
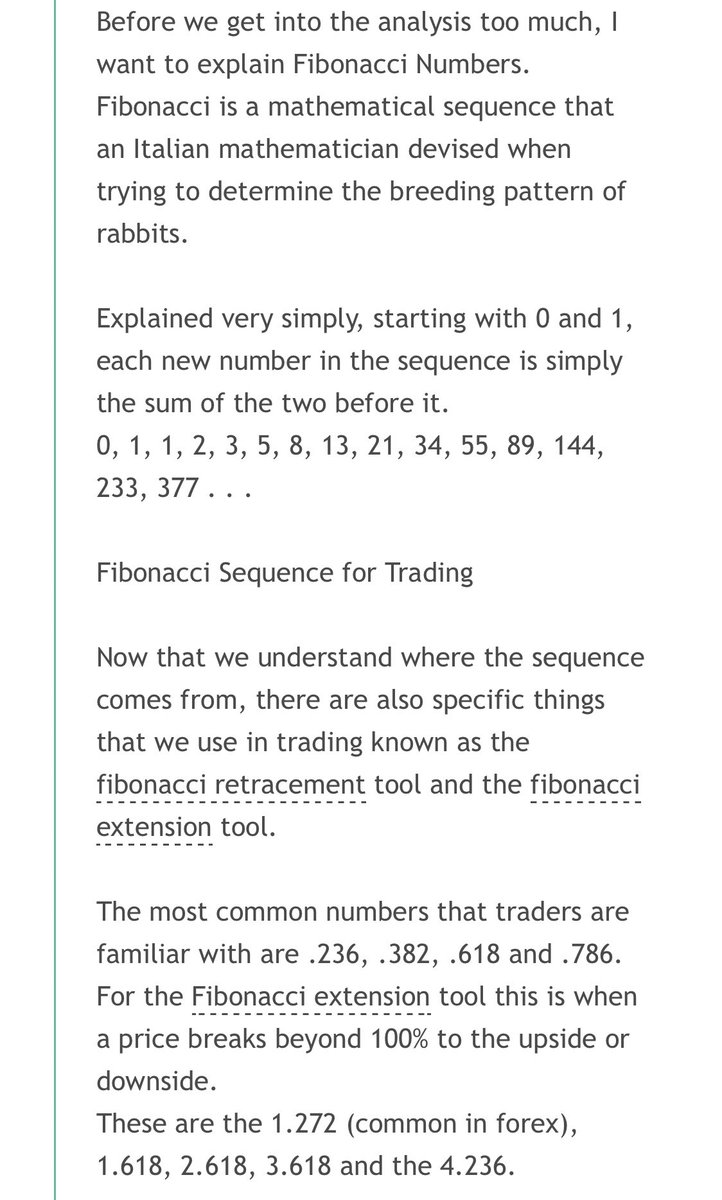
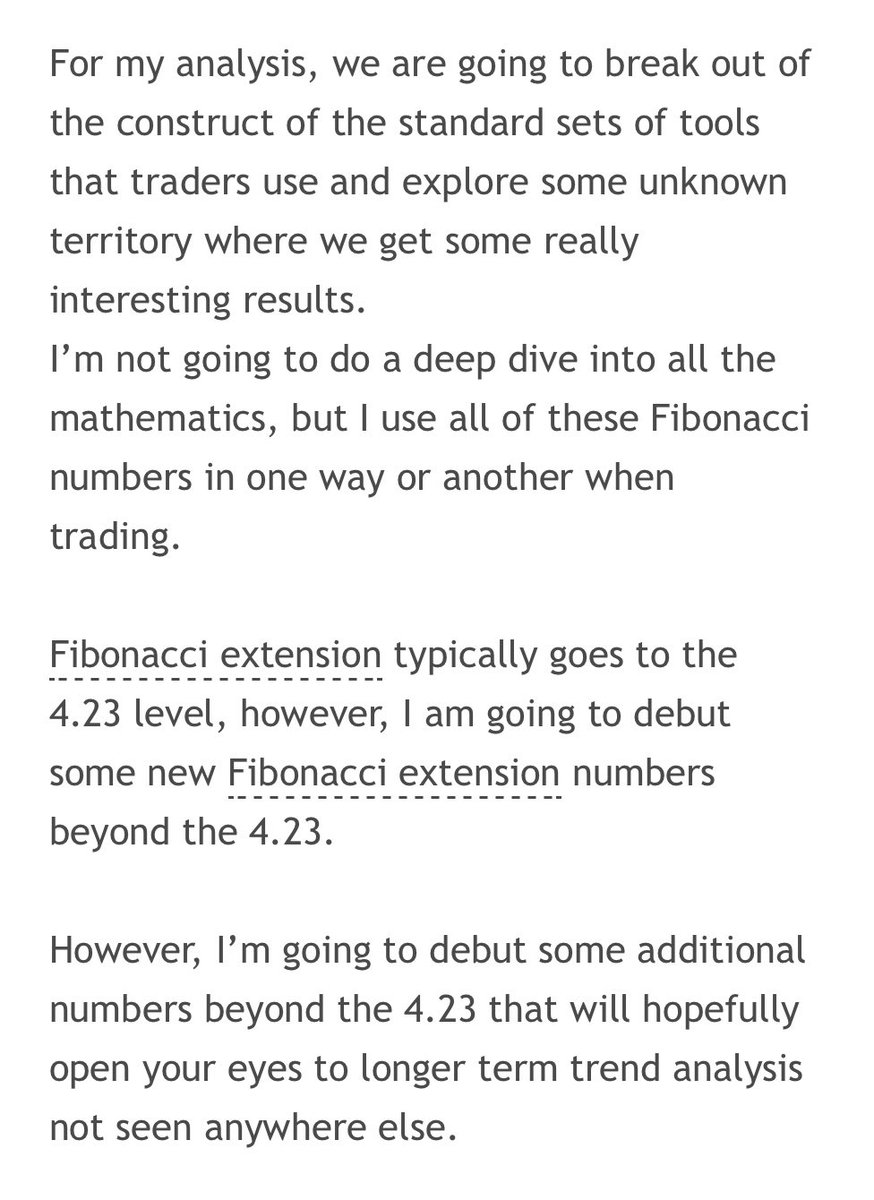
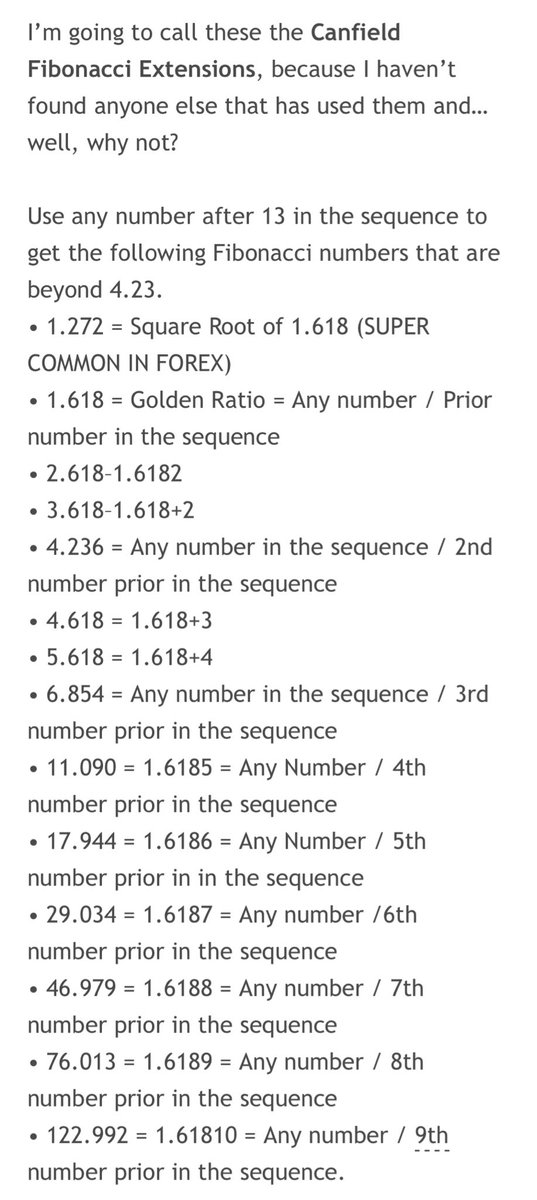
A while back I created a new set of Fibonacci extension ratios for long term investing forecasts.
These have worked extremely well to time tops of markets for #Bitcoin, $APPL, $TSLA, $DJI and more.
Here is how I break down the calculations.
Enjoy
A while back I created a new set of Fibonacci extension ratios for long term investing forecasts.
These have worked extremely well to time tops of markets for #Bitcoin, $APPL, $TSLA, $DJI and more.
Here is how I break down the calculations.
Enjoy
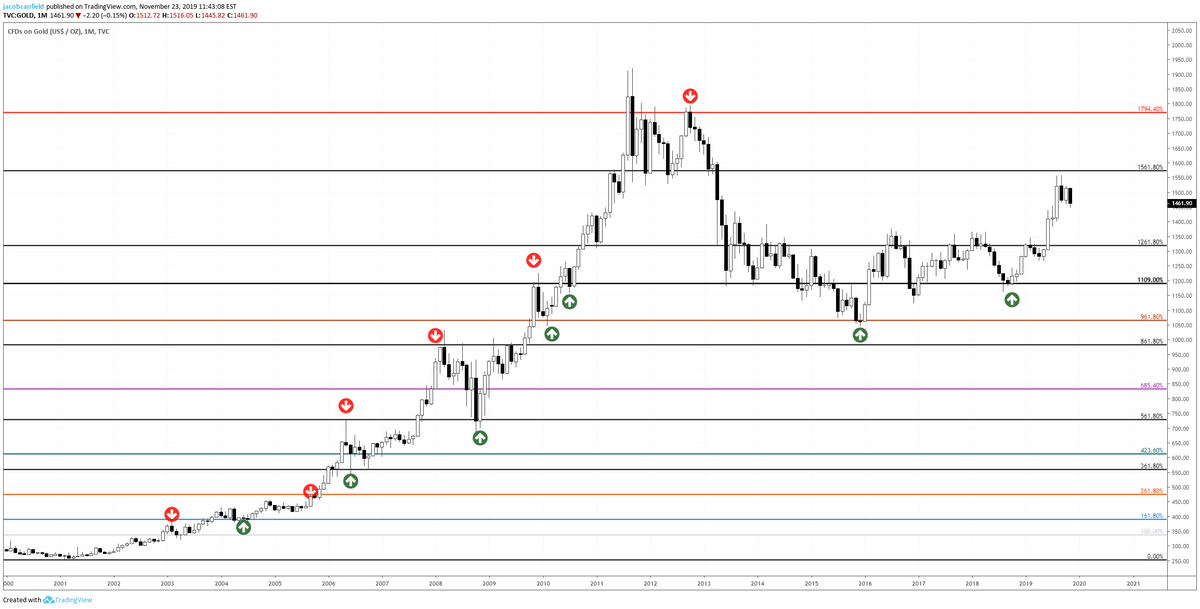
For application, I take the first meaningful impulsive wave of an asset and use that as my & #39;base fibonacci leg& #39;
Here is the 2013-2014 move to $1,000 for Bitcoin.
I use the swing high and the swing low.
I then add the fibonacci plots to my extension tool on trading view.
Here is the 2013-2014 move to $1,000 for Bitcoin.
I use the swing high and the swing low.
I then add the fibonacci plots to my extension tool on trading view.
As you zoom out from the base, you can see how the asset responds to the corresponding Canfield Fibonacci extensions.
In Bitcoin& #39;s case, the 1.618, 2.618, 4.23, 6.85 and the 17.944 proved to be very key levels
17.944 has shown up on several other assets that I have used as well
In Bitcoin& #39;s case, the 1.618, 2.618, 4.23, 6.85 and the 17.944 proved to be very key levels
17.944 has shown up on several other assets that I have used as well

 Read on Twitter


