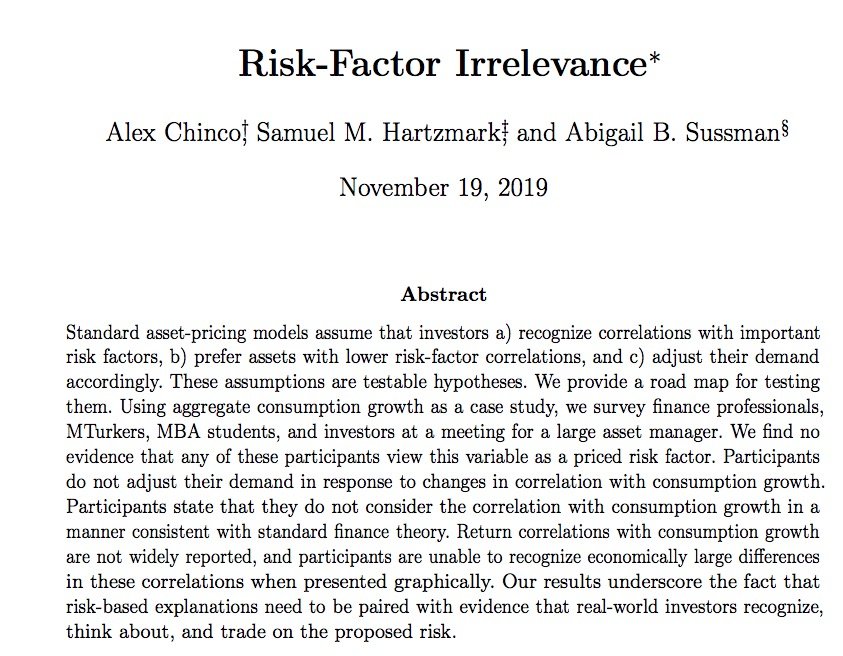
Have been waiting to write about this cool, finally posted, paper by @AlexChinco, @SamHartzmark, and @abbysussman. This is a really neat paper which calls into questions the foundations of Asset Pricing. Read through and take some polls: 1/
https://papers.ssrn.com/sol3/papers.cfm?abstract_id=3487624">https://papers.ssrn.com/sol3/pape...
https://papers.ssrn.com/sol3/papers.cfm?abstract_id=3487624">https://papers.ssrn.com/sol3/pape...
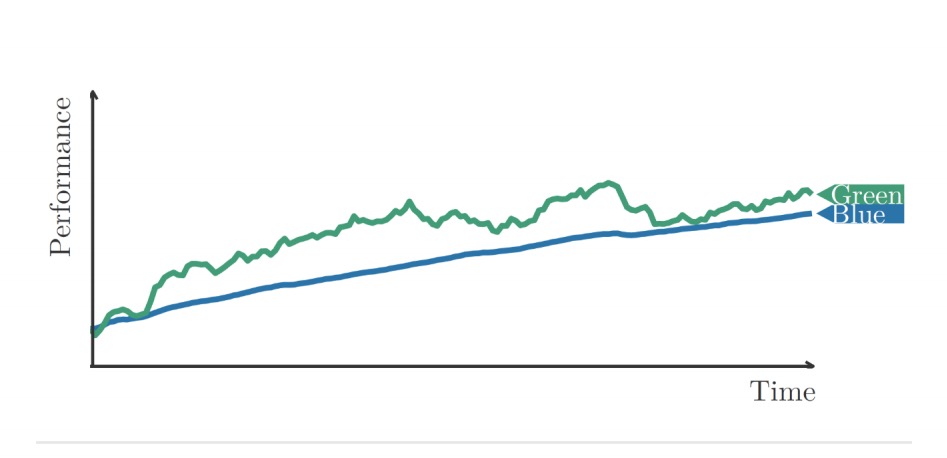
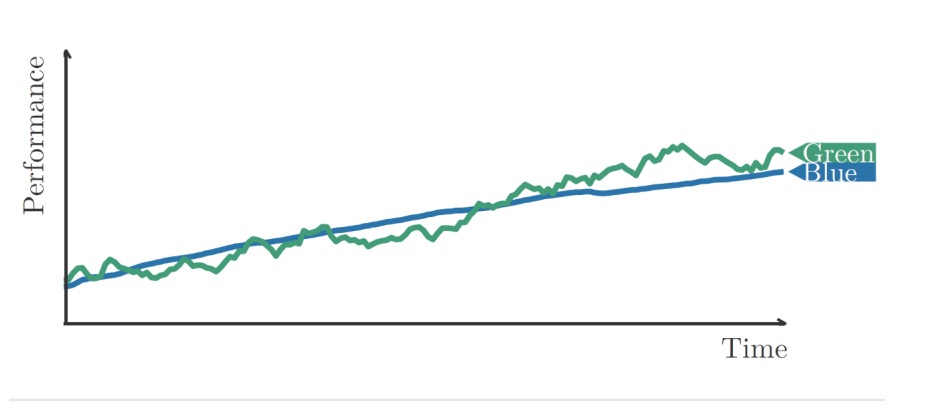
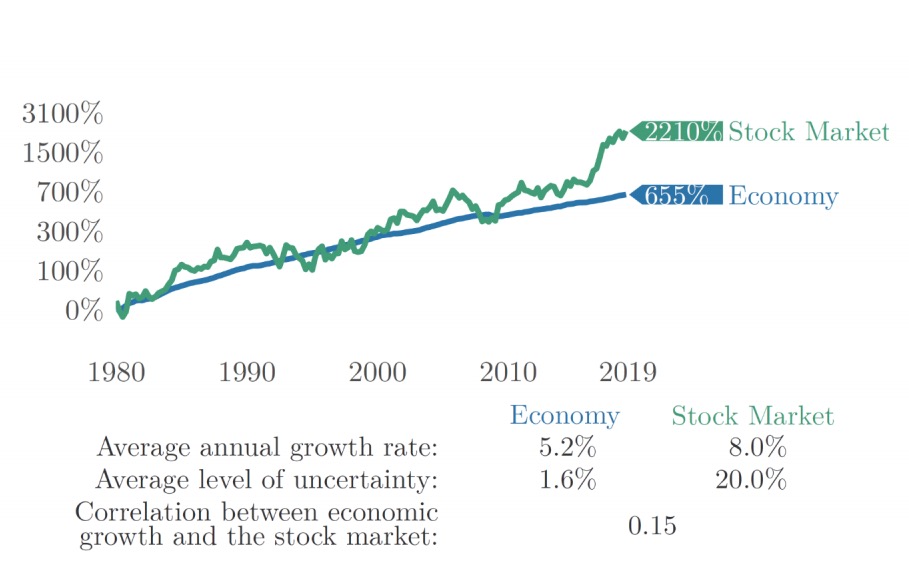
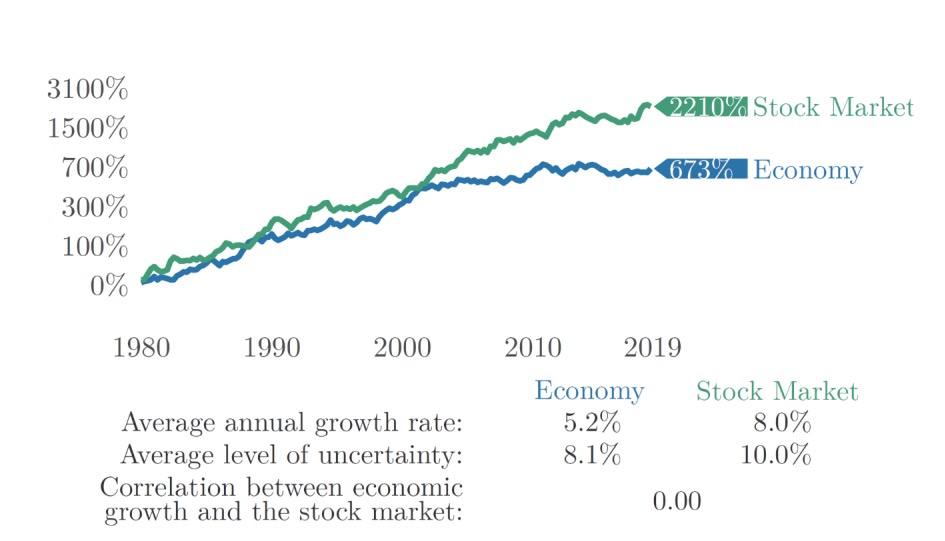
First, let& #39;s do a poll. Which figure has green and blue lines with the greater correlation?
Left or right?
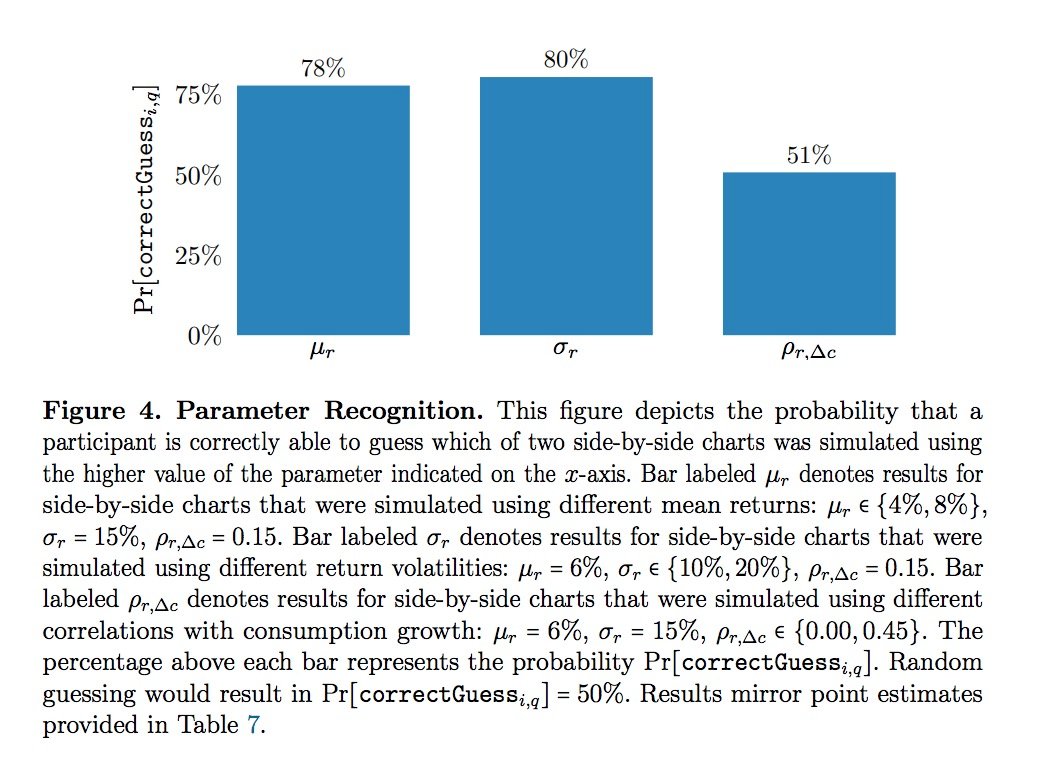
It turns out people are really just not able to do this. Relative to benchmark of guessing 50-50; people guess the higher correlation figure... 51% of the time. Visually, correlations are hard to figure out.
This is really important because the standard view of asset pricing is that assets are risky not because of their volatility or avg returns; but because they *covary* with some risk factor. Canonically consumption; could also think about disaster risk, habit, etc. etc.
But if people just can& #39;t do correlations fundamentally maybe something fundamentally is off.
To look at that, we& #39;re doing to do another survey question from the paper. To simplify this, I& #39;m just asking whether you want to allocate more to stocks if the data looks like the left or the right.
Allocate more to stocks if data come from series on the right or left?
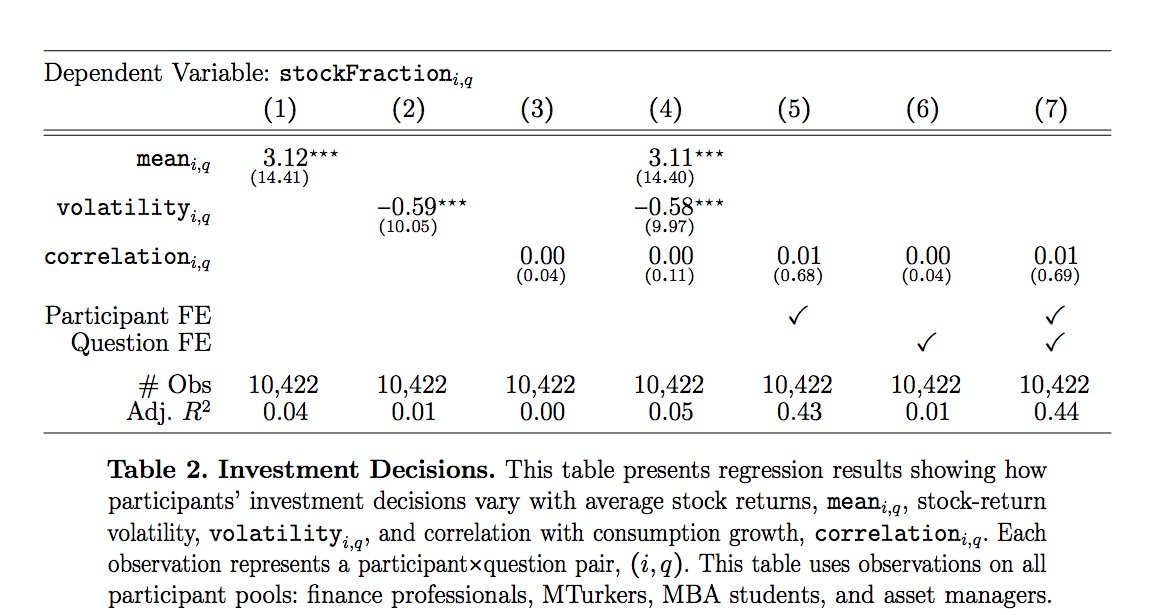
It turns out different groups of people are sensitive to the average return and volatility of returns; but just not the correlation. Again suggests that whatever *risk* people are worried about in asset allocation, might not be the correlation that is in the models
So super cool paper directly tackling the core of asset pricing. I found it a provocative read. Check it out.

 Read on Twitter