A year ago today, Amazon announced they chose Crystal City, VA and Long Island City, NY for HQ2 (later cancelling their plans for the latter). Here& #39;s a short thread on how the DC housing market has changed since then, and full post below. https://www.corelogic.com/blog/2019/11/amazon-hq2-have-housing-prices-changed-a-year-later.aspx">https://www.corelogic.com/blog/2019...
Looking at the two metro divisions in the area, I think it& #39;s hard to make the case that there has been a large impact. If anything, perhaps the announcement kept the regional from following the cooling paths of other metros or the US.
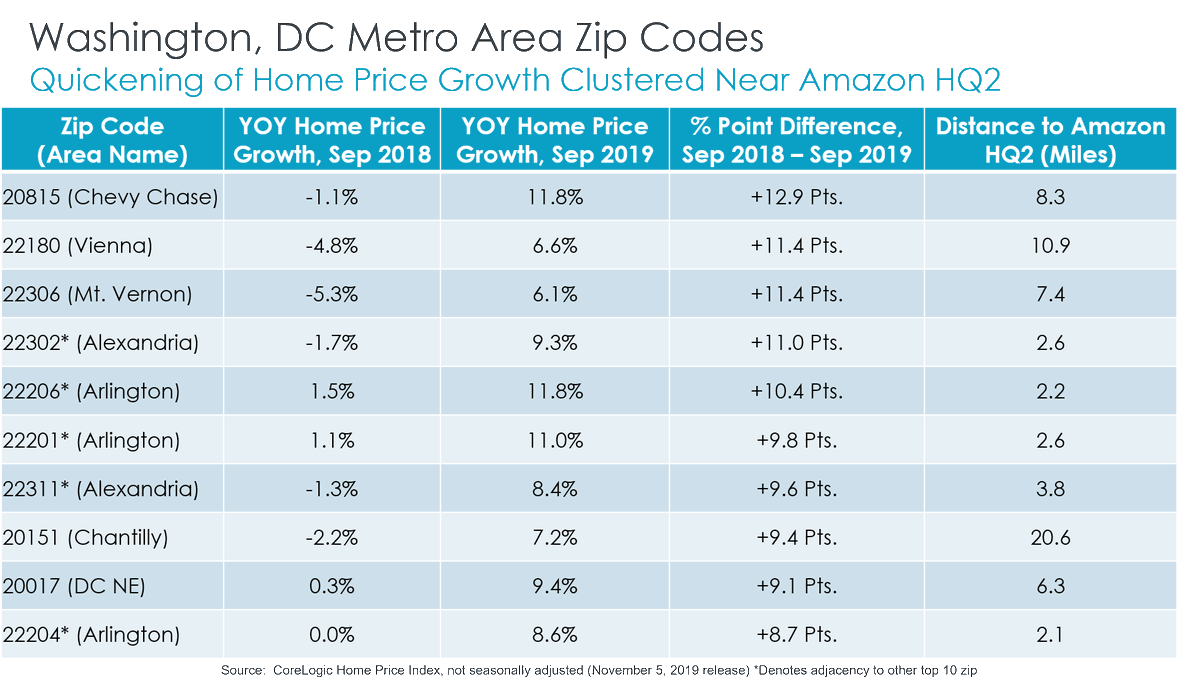
That said, a zip code-level analysis tells a somewhat different story. This map shows 9 of the 10 zips with the largest increase in YOY home price growth (Sep 18 - Sep 19). Notice the five zip cluster right next to HQ2. The other 4 zips have access to Crystal City via DC metro.
Some large swings indeed among these zips. 22302 (Alexandria) saw prices fall by 1.7% in Sep 2018. As of Sep 2019, they& #39;re growing by 9.3%. That& #39;s an 11 point increase in the rate of house price change. Other nearby zips saw a similar change.
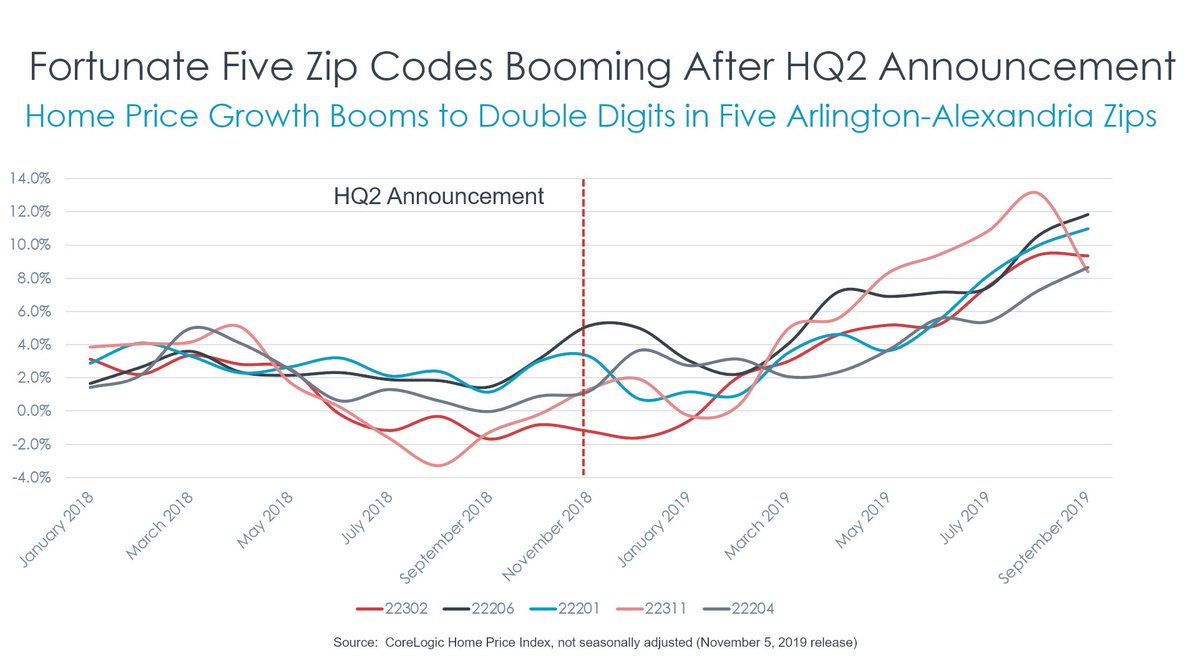
Here& #39;s a time-series chart of that 5 zip code cluster near HQ2. It looks like March 2019 was an inflection point in the local market, representing home sales occurring 2-3 months after the announcement. Didn& #39;t take long for the market to capitalize the news.
Here& #39;s an animation I threw together of the quadratic correlation between the region& #39;s zip code centroids distances from HQ2 and zip code YOY home price growth. Sep & #39;18 - April & #39;19, the gradient was flat. Look at the market bid up price near HQ2 from May onwards.
Waldo Tobler was on to something with his first law of geography! This post is dedicated to your memory, Professor Tobler. We& #39;ll certainly miss you at the North American Regional Science Council meetings this week. https://en.wikipedia.org/wiki/Waldo_R._Tobler">https://en.wikipedia.org/wiki/Wald...

 Read on Twitter


