Here is my bigger picture view of where, I believe the probabilities currently favor, we are going in the $ES / $SPX over the next several months. There is a combination of cycles, geometry & market structure to review.
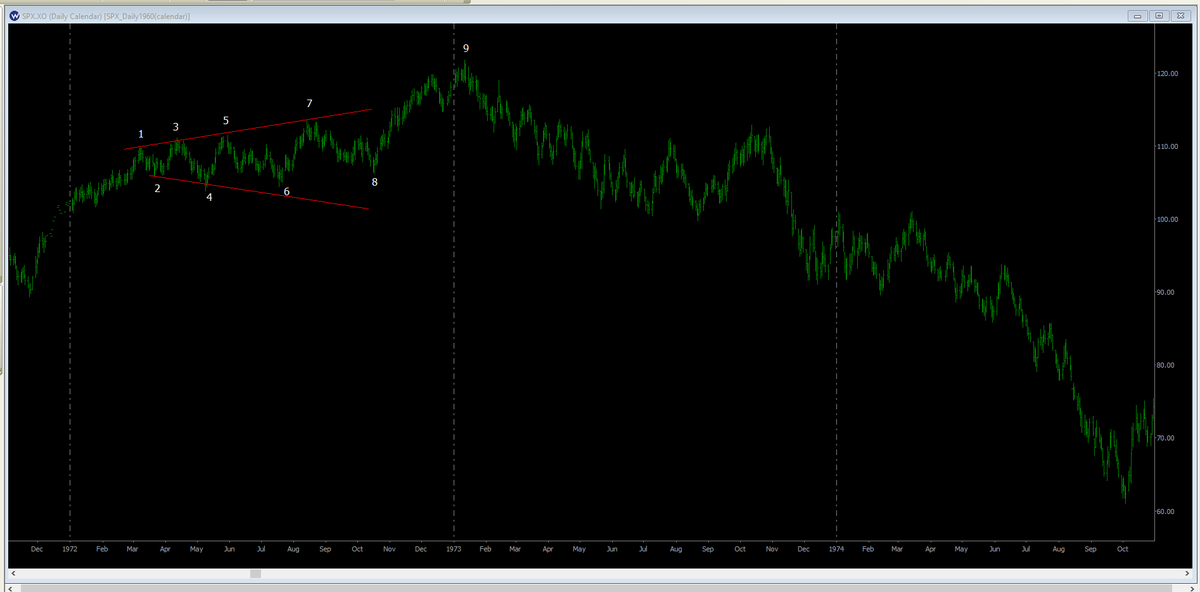
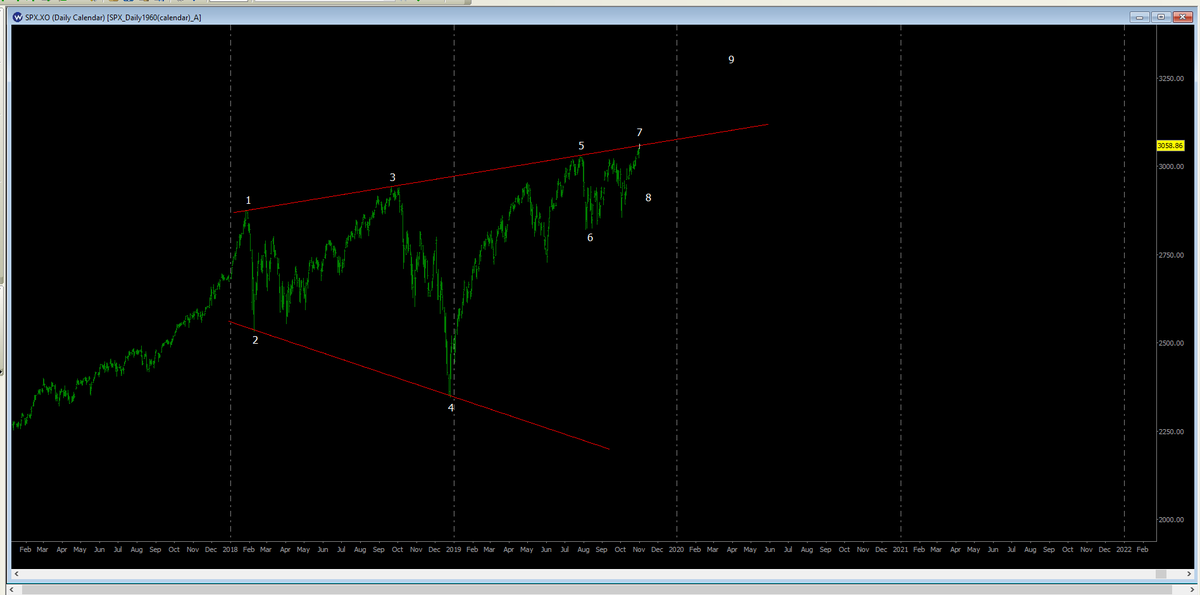
The chart on the left shows the $SPX daily from 1972-1974, and the chart on the right is the $SPX daily from 2018-present. These 2 periods are connected in my cycle work, and the similarities of events between them are nothing short of remarkable.
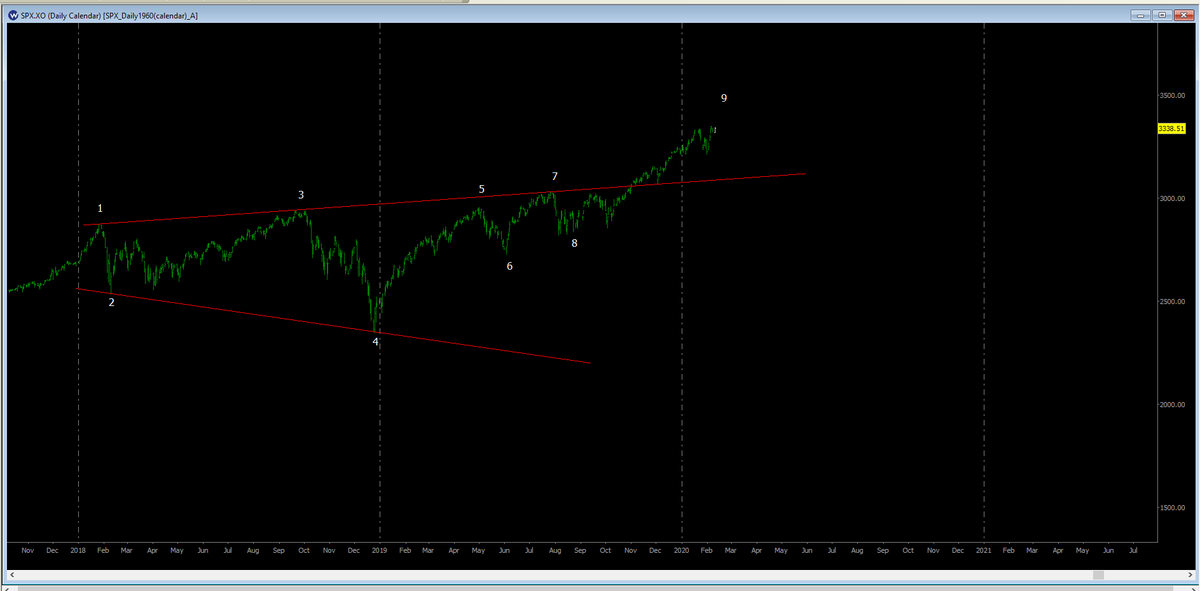
I have been watching/discussing this analog for quite some time now, and the price action & current events continue to support the connection. Probabilities currently favor that we are putting in the point 7 HIGH in the current time frame, with points 8 & 9 still to come.
There& #39;s a lower probability that we& #39;ve already put in points 7 & 8, and have started the point 9 leg - the blow off top, up move. How will we know which it is? Through price action as always. All scenarios must be continually validated/adjusted based on ACTUAL price action.
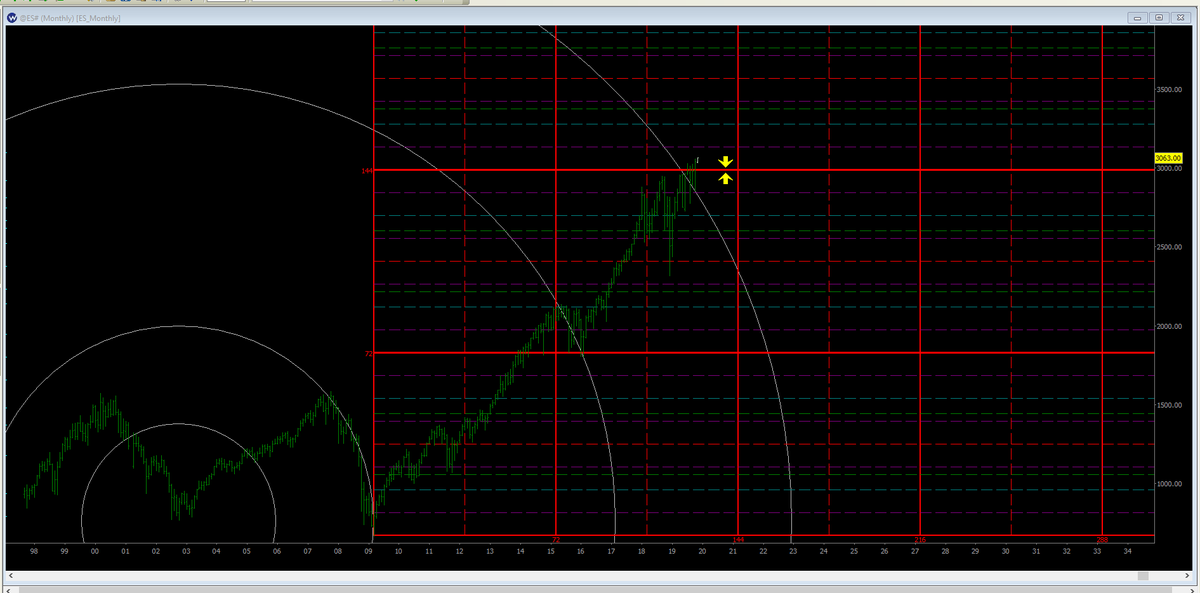
The $ES monthly chart shows we have a bullish breakout on the just completed monthly bar, with price closing above important geometric support/resistance. As long as we stay above the monthly geometric support/resistance in the $ES 2985-2995 area, MUCH higher prices are likely.
$ES monthly geometry gives us potential price targets in the $ES 3280, 3376 & 3570 areas. Odds support that this move will be one of those classic, end of cycle, blow off top type moves. My current timing for THE high is in March/April 2020.
The $ES weekly is similarly bullish & the weekly geometry gives us a target in the $ES 3361 area. Weekly price action on any correction needs to hold above the $ES 2935-2940 area, for the melt up scenario to play out.
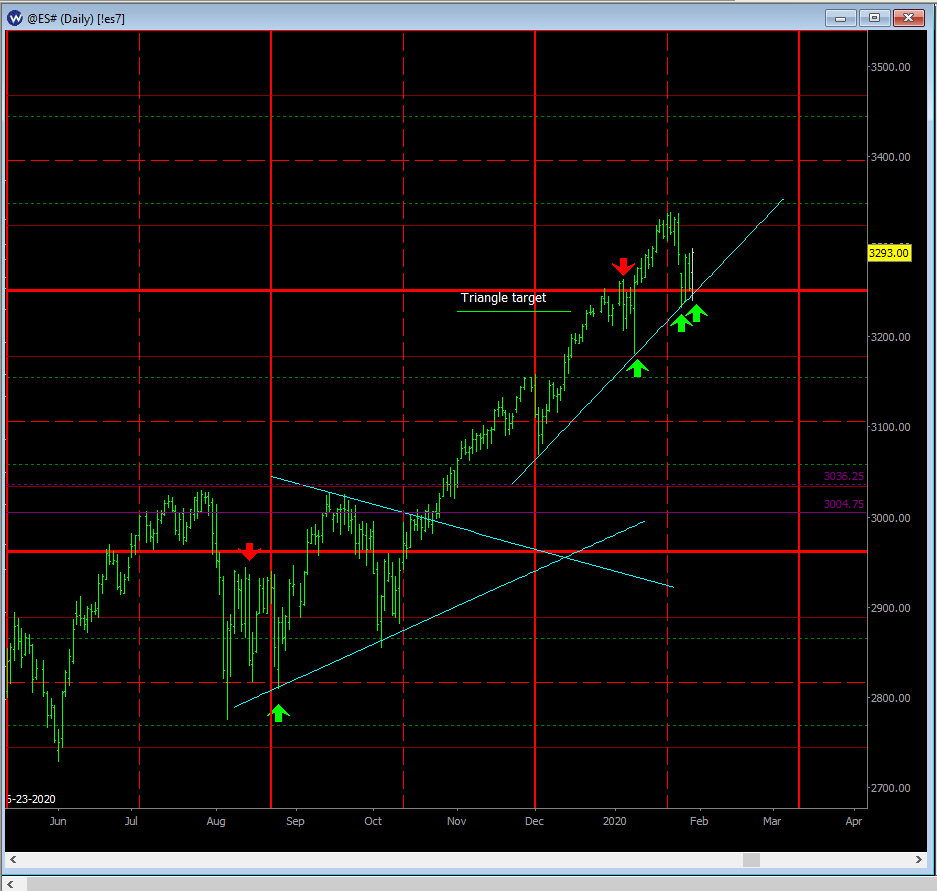
$ES daily gives us a minimum target of the $ES 3225 area based on a measured move off of the triangle break out. Notice how there is daily geometric support/resistance in the $ES 3230-3235 area (thick red horizontal line).
Looking at all of the evidence, a strong case can be made for the bulls at this time. As always, price rules, so one needs to accept ALL of the information the market provides through price action, not just what supports their current views/positions.
Being ready to change your outlook when the market tells you things are changing, is the path to survival/success in trading. For now, it& #39;s time to ride the BULL train!
Remember, the highest probability scenario on my board right now, is a HIGH being put in now/soon, with a pullback to scare the sheep & embolden the shorts. The boyz need fuel for that terminal rocket launch higher. Fuel = lots of traders leaning the wrong way.
Read this article and ask yourself if the events detailed in it don& #39;t remind you of what is going on in the present day.
https://buchanan.org/blog/50-years-ago-the-day-nixon-routed-the-establishment-137693
One">https://buchanan.org/blog/50-y... of the major lessons I have learned from CYCLES: History doesn& #39;t repeat EXACTLY, but it sure does RHYME.
https://buchanan.org/blog/50-years-ago-the-day-nixon-routed-the-establishment-137693
One">https://buchanan.org/blog/50-y... of the major lessons I have learned from CYCLES: History doesn& #39;t repeat EXACTLY, but it sure does RHYME.
Having decisively taken out the 11/28 highs today, odds favor that the $SPX is in the blow off, melt up phase. The daily $SPX chart below shows the highest probability path on my board right now. The targets in the previous tweets in this thread are now in play.
$ES 60min ping pong chart shows we made a false break at the high today, and could not stay on top of the net at $ES 3030. If we remain below the net, the magnet for price becomes the lower limit at $ES 3303.
Based on price action & the cycle window we are currently in, odds favor that we have A high today. We do not have enough information to have probabilities support that it is THE high yet. This high may last for a day, a week, a month, or morph into something much bigger.
The determination of what kind of high this is will be made with more information obtained from price action. For now, I am being very cautious with $ES longs & long exposure to the stock market.
An important development cycle wise is the recent news of the emergence of the Coronavirus. There is a 100 year pandemic cycle that is present in the current time window.
1820-1823 Yellow Fever
1918-1920 Spanish Flu
2020 - ? Coronavirus
1820-1823 Yellow Fever
1918-1920 Spanish Flu
2020 - ? Coronavirus
Watch the Plus3Fuse lines and geometric support/resistance to keep you on the profitable side of any market moves, and for clues to how to best position yourself for what comes next.
Update: Based on cycles I follow & the price action of the past few days, probabilities favor that we have entered another melt up phase in the $ES / $SPX, and are set to make new all time highs. This fast move higher should last into mid to late February.
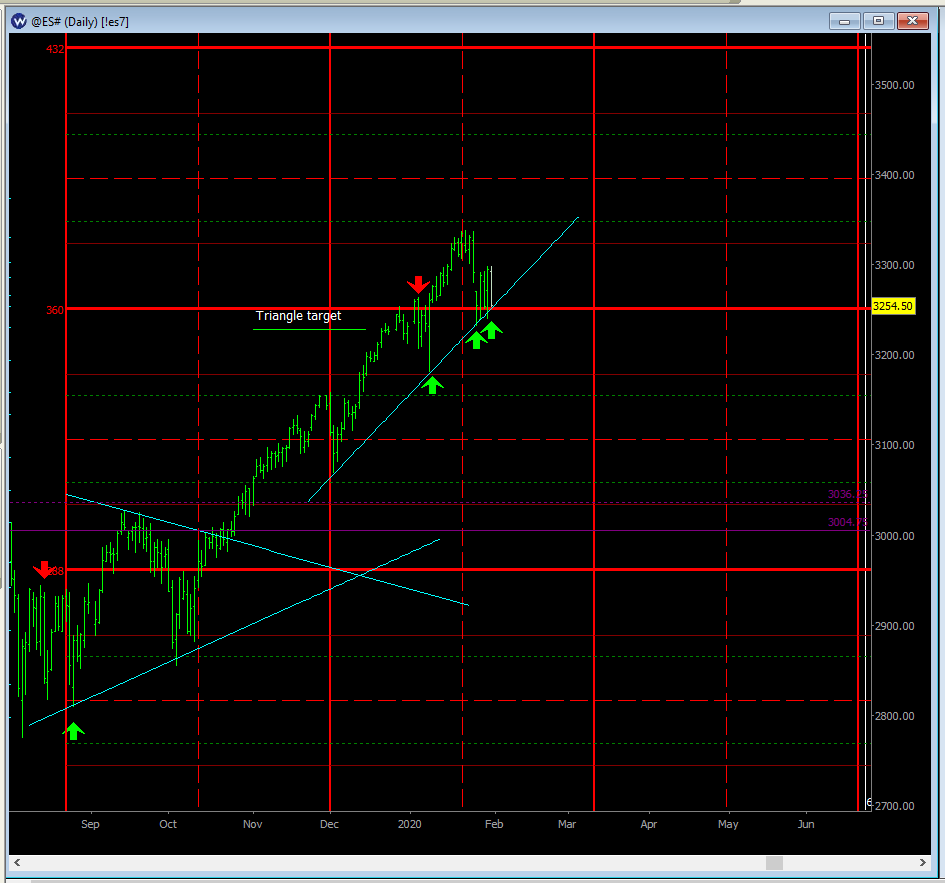
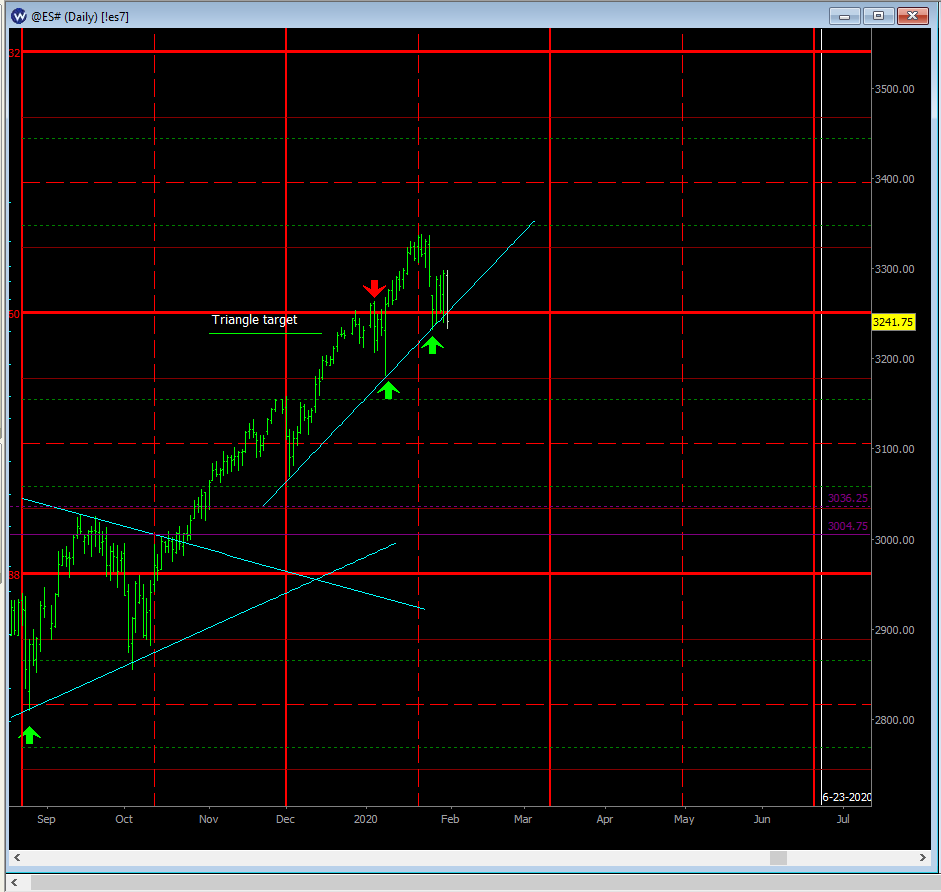
$ES daily shows we tested & held a trend line from the Dec 3rd lows multiple times. In addition, price has stayed above geometric support/resistance in the $ES 3250 area. Both data points are very bullish for higher prices. The target is the midpoint in the $ES 3400 area.
Watch that $ES daily trend line from the Dec 3rd lows closely. If we take it out, probabilities will no longer support the bullish projection & we will need to reassess.
$ES daily trend line from the Dec 3rd lows is now broken & we are below geometric support/resistance in the $ES 3250 area. If we close in this area today, probabilities will no longer support higher prices. When the market changes, we must change with it.
Daily $SPX chart below shows that the current point 9 high from the 1970& #39;s analog is due in the next 2 weeks (see pinned tweet for details). We are looking for one more push higher, to new all time highs. Possible targets are $ES 3373, 3393 & 3433.
$ES tagged 3392.50 yesterday & we are squarely in the cycle turn window. If we haven& #39;t seen the point 9 HIGH already, odds favor it happening in the next 7 trading days. Time to vigilantly watch price looking for clues to the effect of the new cycles.
Second target from list posted on Feb 10th hit with $ES high today at 3393.75, with a false break to boot. Let& #39;s see if the boyz push for one more high in the $ES 3400& #39;s before the cycle window closes next week.
Probabilities favor that we have put in the POINT 9 $SPX high on Feb 19th (see pinned tweet thread for detailed analysis).

 Read on Twitter