Friends,
Here is a thread wherein I shall post Trading related observations & answers to some of queries I receive from traders.
It will be a running thread; as and when I come across something interesting shall post here.
(Feel free to Retweet) & #39;Learning_Mkts& #39;
Here is a thread wherein I shall post Trading related observations & answers to some of queries I receive from traders.
It will be a running thread; as and when I come across something interesting shall post here.
(Feel free to Retweet) & #39;Learning_Mkts& #39;
Q: Why non-directional Options buying, on event day, is not good idea?
A: IVs are already High before event, anticipating post event big move. If one buys ATM CE & PE in hope of big profit in 1 leg overcompensating other, it may not work unless market really rips up or down
1/2
A: IVs are already High before event, anticipating post event big move. If one buys ATM CE & PE in hope of big profit in 1 leg overcompensating other, it may not work unless market really rips up or down
1/2
E.g: 11900 Straddle...
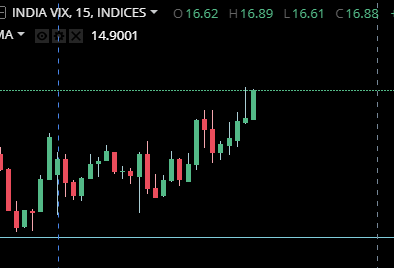
Today Vix rose even post #RBIPolicy & closed near High.
Still, rise in 11900 PE couldn& #39;t compensate fall in 11900 CE.
Thus, 11900 Straddle kept falling thruout session...
Img1 shows #Vix
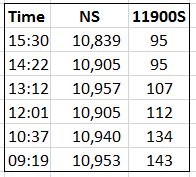
Img2 shows #Nifty Spot & 11900 Straddle price at different times...
Today Vix rose even post #RBIPolicy & closed near High.
Still, rise in 11900 PE couldn& #39;t compensate fall in 11900 CE.
Thus, 11900 Straddle kept falling thruout session...
Img1 shows #Vix
Img2 shows #Nifty Spot & 11900 Straddle price at different times...
- As can be seen, Straddle dropped sharply post event
- Tomm being expiry, even 120 points fall in NS in last 2 hrs, cudn& #39;t fight Theta decay. Thus, Straddle premium eroded.
- So, if u r Long SS on event day, better to exit before event.
& post event, take Directional trade!
- Tomm being expiry, even 120 points fall in NS in last 2 hrs, cudn& #39;t fight Theta decay. Thus, Straddle premium eroded.
- So, if u r Long SS on event day, better to exit before event.
& post event, take Directional trade!
There has been perennial debate about whether price (- OI- Volumes) lead the news or lag.
- Proponents of efficient market theory say Price discounts everything. But then, why tweet from @realDonaldTrump wud lead to huge swings in commodity/ world mkts? (like today)
1/2
- Proponents of efficient market theory say Price discounts everything. But then, why tweet from @realDonaldTrump wud lead to huge swings in commodity/ world mkts? (like today)
1/2
- As some people believe, markets are inefficient; then why reaction to News and Price Action do not match, sometimes? (e.g stock rises despite bad numbers)
IMO, it is mix of both...
Later this week, I shall present my case with examples for both sides.
Follow this thread.
2/2
IMO, it is mix of both...
Later this week, I shall present my case with examples for both sides.
Follow this thread.
2/2
This thread is on above topic..... https://twitter.com/voPAtrader/status/1162685721477447680">https://twitter.com/voPAtrade...
Here, to bust a trading myth. (It is often taught to new traders, probably by new trainers).
Q: Does Resistance- Support gets stronger with each touch, or weaker?
A:
You are standing by frozen lake. U have a big ball and with it, u want to breach icy surface...
1/n
Q: Does Resistance- Support gets stronger with each touch, or weaker?
A:
You are standing by frozen lake. U have a big ball and with it, u want to breach icy surface...
1/n
A. U hit ball hard on ice, it creates small cracks
B. Ball bounces a bit & U pick it up
C. Again throw wh high force, creates more cracks
D. Ball again bounces a bit & U pick it up
E. This time u use all strength n throw ball, ice breaks & ball goes inside in water
2/n
B. Ball bounces a bit & U pick it up
C. Again throw wh high force, creates more cracks
D. Ball again bounces a bit & U pick it up
E. This time u use all strength n throw ball, ice breaks & ball goes inside in water
2/n
F. Ball can& #39;t come out of lake (or over icy surface), by itself; unless u pull it up or somebody pushes from beneath.
3/n
3/n
Now, relate this to Price Action in trading.
Frozen lake surface is Support (it can be Res for Buyers).
Ball is Price & ur force is Volumes.
A, C: price visits to support repeatedly
B & D: Price retraces, Sellers take breather n come back stronger
E: Finally Support breaks.
4/n
Frozen lake surface is Support (it can be Res for Buyers).
Ball is Price & ur force is Volumes.
A, C: price visits to support repeatedly
B & D: Price retraces, Sellers take breather n come back stronger
E: Finally Support breaks.
4/n
F: Support turns into Resistance. It needs Volumes on Buy side to overcome resistance.
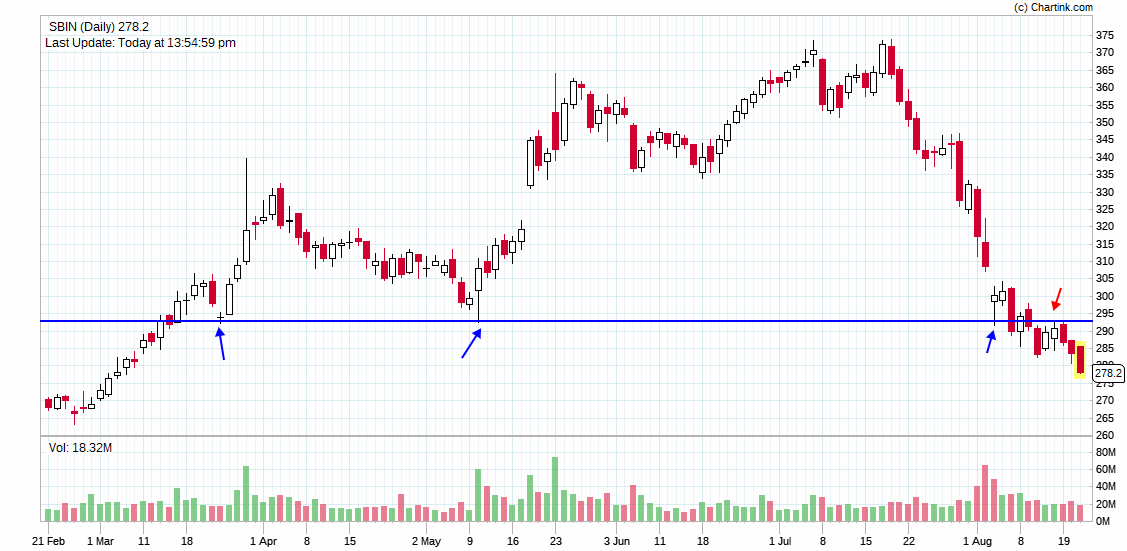
So, the answer is...... More visits to Support, Weaker it becomes. As opposing force becomes stronger than traders holding that support. (or Resistance),
PFA e.g. SBIN
So, the answer is...... More visits to Support, Weaker it becomes. As opposing force becomes stronger than traders holding that support. (or Resistance),
PFA e.g. SBIN
Q: Many stocks/ Index had bearish trend till Thursday & hv big Bullish bar with huge volumes on Friday. How to read this scenario and how to trade them?
My views to follow soon.....
My views to follow soon.....
> Wide Range Bullish bar with huge volumes ~
Big Gap up with huge volumes.
(Had news come post market, we wud have
had big gap up across the board)
In either case, huge change in sentiment is seen.
2/n
Big Gap up with huge volumes.
(Had news come post market, we wud have
had big gap up across the board)
In either case, huge change in sentiment is seen.
2/n
> Most important aspect of such days is VWAP.
Mark it on your chart/ notes for future reference.
Till price is above this VWAP or takes support there, no reason to Short (positional) that stock/ index.
3/n
Mark it on your chart/ notes for future reference.
Till price is above this VWAP or takes support there, no reason to Short (positional) that stock/ index.
3/n
Further, categorise stocks based on PA...
1.
Stocks which gapUp above Friday High & hold the gap for 1 hour. These are most Bullish stocks. Look to Buy them on retracement.
Supports: Friday High---vwap.
4/n
1.
Stocks which gapUp above Friday High & hold the gap for 1 hour. These are most Bullish stocks. Look to Buy them on retracement.
Supports: Friday High---vwap.
4/n
2.
Stocks which open within Friday& #39;s range & take support near VWAP. Look to Buy for intraday with SL 1- 1.5 ATR below VWAP.
If such stock just chops betn Friday& #39;s range, then Scalping is better & avoid overnight trades.
5/n
Stocks which open within Friday& #39;s range & take support near VWAP. Look to Buy for intraday with SL 1- 1.5 ATR below VWAP.
If such stock just chops betn Friday& #39;s range, then Scalping is better & avoid overnight trades.
5/n
3.
Stocks which breach Friday vwap and hold below it. These are weak stocks. As long as they remain below VWAP, look to Short them (or at least avoid Buy).
6/n
Stocks which breach Friday vwap and hold below it. These are weak stocks. As long as they remain below VWAP, look to Short them (or at least avoid Buy).
6/n
Note:
- Friday& #39;s High is Resistance. Keep watch for breach with good volumes.
- Low of 10 am bar would be last Support. Breach of that would be bad for any stock.
- Above are just guidelines from my diary; not trading recommendations. I shall try to post trade setups later.
n/n
- Friday& #39;s High is Resistance. Keep watch for breach with good volumes.
- Low of 10 am bar would be last Support. Breach of that would be bad for any stock.
- Above are just guidelines from my diary; not trading recommendations. I shall try to post trade setups later.
n/n
Q: Why buy stocks at higher prices, if u didn& #39;t buy them at lower prices? In other words, if u didn& #39;t think stock is good Buy at 500, then why you want to buy at 550?
Answer to follow..........
Answer to follow..........
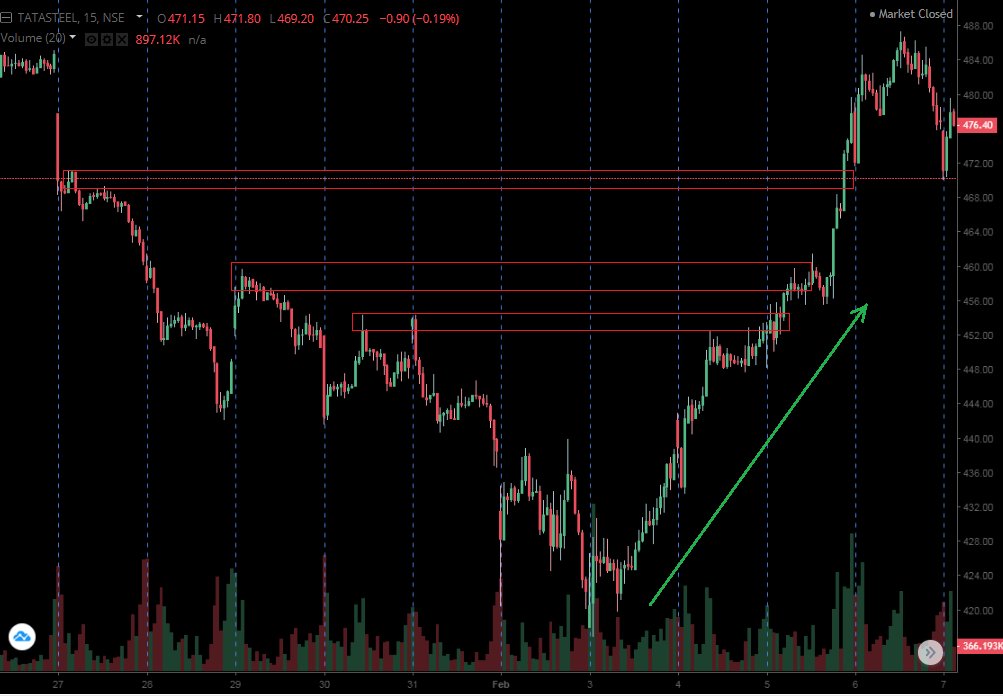
A: These are trading setups wherein entry is done AFTER confirmation. Confirmation can be...... Break of Resistance/ huge volumes/ momentum pickup.
Note:
There are different ways of trading. This is just 1 of those. Intention is to show, nothing wrong with it.
1/n
Note:
There are different ways of trading. This is just 1 of those. Intention is to show, nothing wrong with it.
1/n
e.g. U hv to bet in current ODI. Bet: At any point, will Kohli score 25 more runs?
-Some l bet soon as he comes to bat
-Traders in our case, l wait. As he scores 30-35 runs, ten bet.
Why?
Their thought process is, it is easier to go from 30 to 55, than going from 5 to 30.
2/n
-Some l bet soon as he comes to bat
-Traders in our case, l wait. As he scores 30-35 runs, ten bet.
Why?
Their thought process is, it is easier to go from 30 to 55, than going from 5 to 30.
2/n
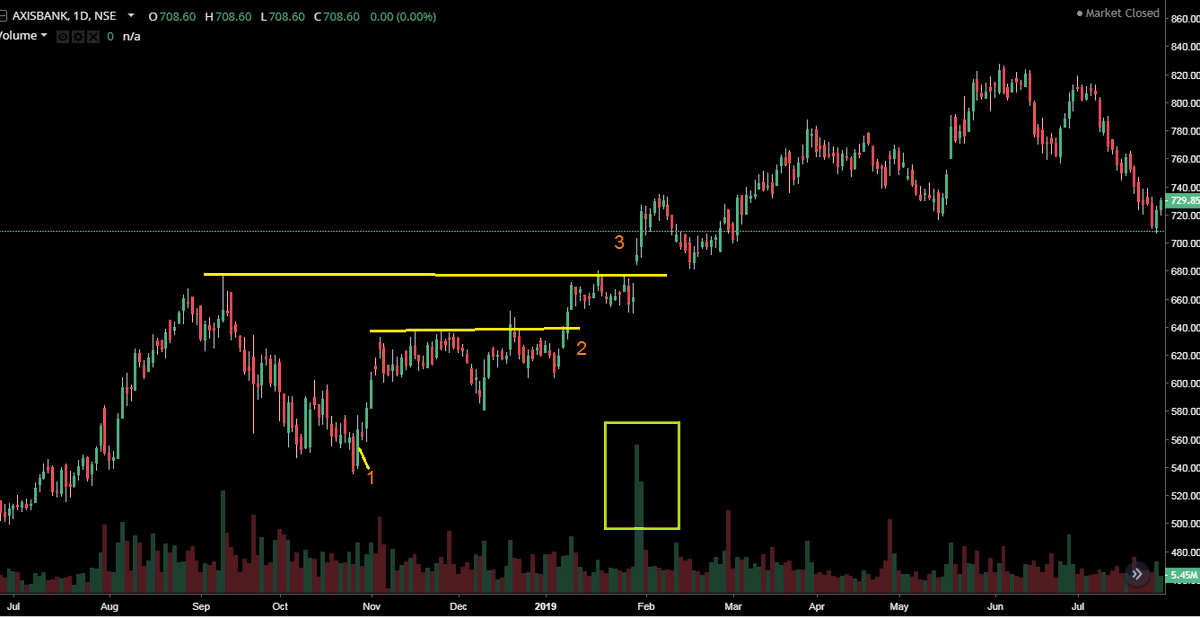
#Axisbank (postmortem)
Point 2: Swing High broken, some traders wud enter
3: Here, traders in our case wud enter.
Reasons: Breach of Res+ Big vol+ Gap momentum. For them, trade at pint 2 was dicey; But at 710, tey r ready to pay 12% premium, coz it has better odds to work
3/n
Point 2: Swing High broken, some traders wud enter
3: Here, traders in our case wud enter.
Reasons: Breach of Res+ Big vol+ Gap momentum. For them, trade at pint 2 was dicey; But at 710, tey r ready to pay 12% premium, coz it has better odds to work
3/n
(What about point 1? Only Fake Traders can enter at point 1 & hold for entire rally. Real traders are not this efficient. )
Let us take intraday example...
4/n
Let us take intraday example...
4/n
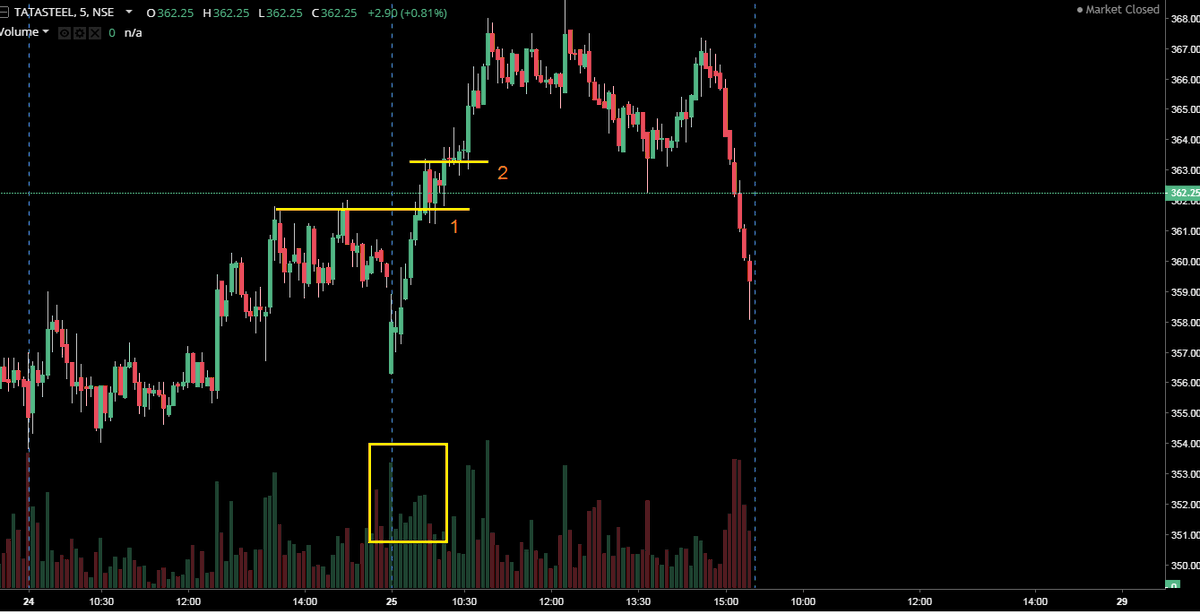
#Tatasteel
Point 1& 2: Breach of Resistance+ Good volumes + Momentum since Open.
So, even thou price is 1.5-2% higher than Open, still Buy trade had better confluence.
(Lastly, caution- it may not be prudent to bet Kohli l score another 25 runs, when he is already at 150)
n/n
Point 1& 2: Breach of Resistance+ Good volumes + Momentum since Open.
So, even thou price is 1.5-2% higher than Open, still Buy trade had better confluence.
(Lastly, caution- it may not be prudent to bet Kohli l score another 25 runs, when he is already at 150)
n/n
Never invest in a stock just because news about a big investor bought stake broke out......
That big investor will have different, entry-exit levels/ risk appetite/ drawdown tolerance/ patience.
Moreover, from news you may not get true picture about his average holding price...
That big investor will have different, entry-exit levels/ risk appetite/ drawdown tolerance/ patience.
Moreover, from news you may not get true picture about his average holding price...
Friends,
Observations abt GAPs #Nifty
- NF gap Up ~20% & Dn ~12% days
- 66% Gaps filled same day
- 80% Gaps filled in 10 days
- Gaps post key events, LS results/Budget filled >6-8 weeks (Few times, many months)
(Gap Up: CDO> PDH; Gap Dn: CDO< PDL)
p.s: 12 Dec& #39;19 Gap is Open
Observations abt GAPs #Nifty
- NF gap Up ~20% & Dn ~12% days
- 66% Gaps filled same day
- 80% Gaps filled in 10 days
- Gaps post key events, LS results/Budget filled >6-8 weeks (Few times, many months)
(Gap Up: CDO> PDH; Gap Dn: CDO< PDL)
p.s: 12 Dec& #39;19 Gap is Open
Note:
- NF Continuous data used in study & Series gaps considered (Sample size: <9 years data)
- All numbers are approximate, just to give you ballpark idea..... I use this data for further analysis in my #Excel_Models
#Stats #trading & #39;Learning_Mkts& #39;
- NF Continuous data used in study & Series gaps considered (Sample size: <9 years data)
- All numbers are approximate, just to give you ballpark idea..... I use this data for further analysis in my #Excel_Models
#Stats #trading & #39;Learning_Mkts& #39;
Stock markets and Onions!!!
In our native place, there are many farmers who grow different crops each year.... Sorghum/ Millet/ Groundnut/ Onions et al.
Most of them are small farmers; while they have been farming for decades, struggle to make ends meet.
& #39;Learning_Mkts& #39;
1/n
In our native place, there are many farmers who grow different crops each year.... Sorghum/ Millet/ Groundnut/ Onions et al.
Most of them are small farmers; while they have been farming for decades, struggle to make ends meet.
& #39;Learning_Mkts& #39;
1/n
Why most of them are not doing well?
Major part of answer lies in understanding of basic Demand-Supply dynamics...
- They select crop which has excellent price potential. Fair enough.
- But, they sow it when that crops& #39; supply is less and thus prices are high
2/n
Major part of answer lies in understanding of basic Demand-Supply dynamics...
- They select crop which has excellent price potential. Fair enough.
- But, they sow it when that crops& #39; supply is less and thus prices are high
2/n
e.g. When onions are Rs.100/kg, they decide to sow onions.
- Many small farmers do the same. So their input costs are high.
- When crop is ready, there is abundant onions in market and prices fall.
- Thus, when they want to sell in markets, most of time revenue <= costs
3/n
- Many small farmers do the same. So their input costs are high.
- When crop is ready, there is abundant onions in market and prices fall.
- Thus, when they want to sell in markets, most of time revenue <= costs
3/n
- In panic, they want to sell onions as quickly as possible, reduce prices further.
- A stage comes when they hv to sell crop dirt cheap... But, something is better than nothing, so they still sell it.
- At every stage, smart wholesalers/ farmers benefit at their expense
4/n
- A stage comes when they hv to sell crop dirt cheap... But, something is better than nothing, so they still sell it.
- At every stage, smart wholesalers/ farmers benefit at their expense
4/n
Lets come to #StockMarket ...
A. When a stock is in demand and thus relatively expensive, small retail traders invest in it.
B. As demand increases, stock further rises. More retail invests (FOMO)... Who is Selling to them? Ofcos, smart money.
5/n
A. When a stock is in demand and thus relatively expensive, small retail traders invest in it.
B. As demand increases, stock further rises. More retail invests (FOMO)... Who is Selling to them? Ofcos, smart money.
5/n
C. A stage comes when no Big money is willing to hold up price... naturally, prices fall. It breaks crucial Supports
D. Traders jump to dump stock at whatever prices. Prices fall further.
E. Finally, a level comes wherein, prices are too low. Here smart money, start to buy..
6/n
D. Traders jump to dump stock at whatever prices. Prices fall further.
E. Finally, a level comes wherein, prices are too low. Here smart money, start to buy..
6/n
In nutshell, Retail traders buy stocks at higher prices & sell to Smart money at lower levels.
n cycle repeats..
In the end, be it retail traders or small farmers, 95% of them don& #39;t make any money.
Farmers, at least get loan waivers; #traders quit #trading blaming markets
n/n
n cycle repeats..
In the end, be it retail traders or small farmers, 95% of them don& #39;t make any money.
Farmers, at least get loan waivers; #traders quit #trading blaming markets
n/n
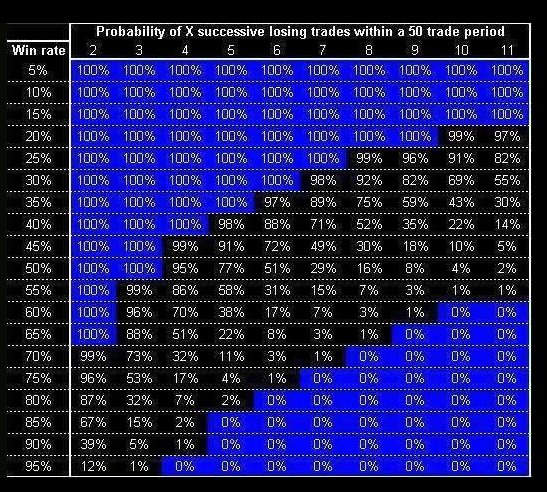
It is often said, 1 or 2 or even 10 trades don& #39;t decide how good/ bad trading system is.
This chart shows, why as traders we need to look at bigger sample size.
Note: This image was taken from internet few years back.
#trading #tradingpsychology
This chart shows, why as traders we need to look at bigger sample size.
Note: This image was taken from internet few years back.
#trading #tradingpsychology
Over Net, most study material on #trading covers, Good setups to trade/How to be profitable in trading, BUT few material tells what NOT to do.
In this thread, over series of tweets, I shall share & #39;how NOT to trade- what mistakes to avoid.& #39;
& #39;Learning_Mkts& #39; & #39;Trading_mistakes& #39;
In this thread, over series of tweets, I shall share & #39;how NOT to trade- what mistakes to avoid.& #39;
& #39;Learning_Mkts& #39; & #39;Trading_mistakes& #39;
Note:
- I have committed ALL mistakes mentioned in this thread.
- Most of them, many years back when I was rookie.
- I have committed ALL mistakes mentioned in this thread.
- Most of them, many years back when I was rookie.
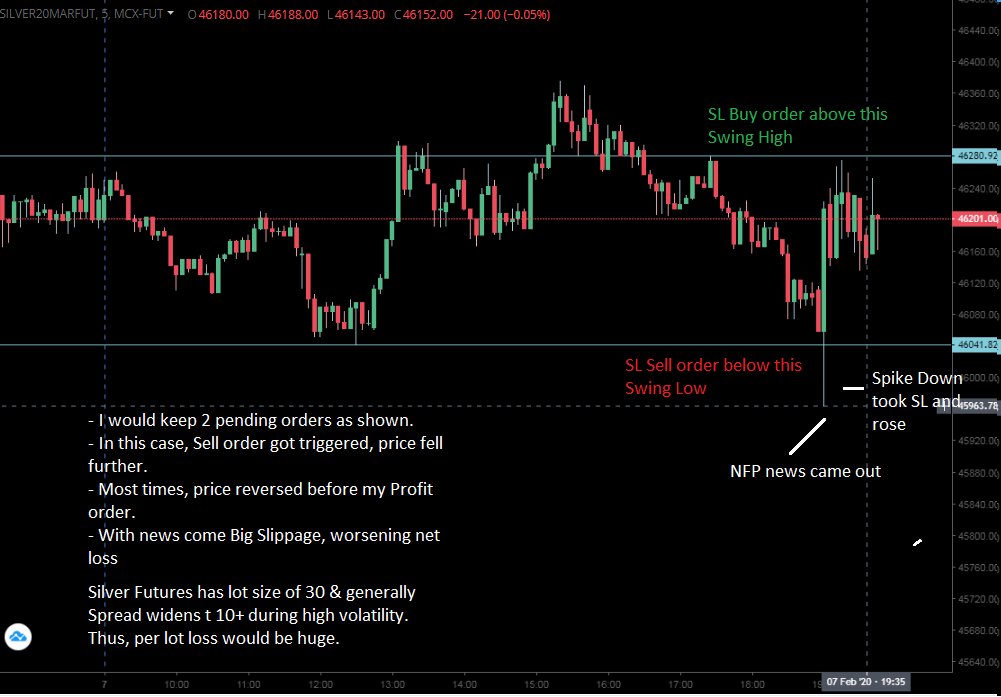
1. Trading news/ event with Pending orders
- NEVER SCALP (specially Futures), before- during news. ( #NFP / #RBI policy/ #Results ..)
- Bad news, Price fall/ Good news, price rise..... doesn& #39;t happen necessarily. This aspect covered in detail here ( https://twitter.com/voPAtrader/status/1162685721477447680)">https://twitter.com/voPAtrade...
2. Collecting pennies infront o running train
- Stock rose big, now l fall
- I l Short at next Resistance
- It didn& #39;t halt at prev Res, it will reverse at next
Such approach leads to bad trades.
NEVER bet against strong momentum.
(Differentiate betn Climax move & Momentum)
- Stock rose big, now l fall
- I l Short at next Resistance
- It didn& #39;t halt at prev Res, it will reverse at next
Such approach leads to bad trades.
NEVER bet against strong momentum.
(Differentiate betn Climax move & Momentum)
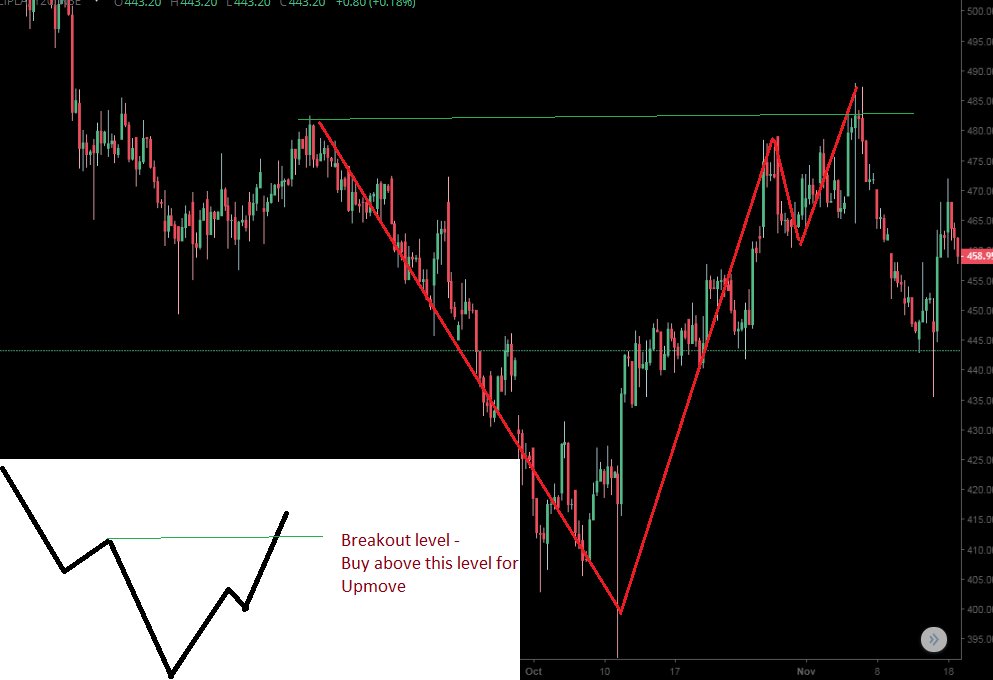
3. Follow Theory blindly (More examples to follow...)
A) Break of prior Sw High
- White img is what books teach; chart is what happens
- If retail traders, wh limited resources know Theory; Smart money wh huge resources/ experience won& #39;t know?
Always wait for Shake-off move!
A) Break of prior Sw High
- White img is what books teach; chart is what happens
- If retail traders, wh limited resources know Theory; Smart money wh huge resources/ experience won& #39;t know?
Always wait for Shake-off move!
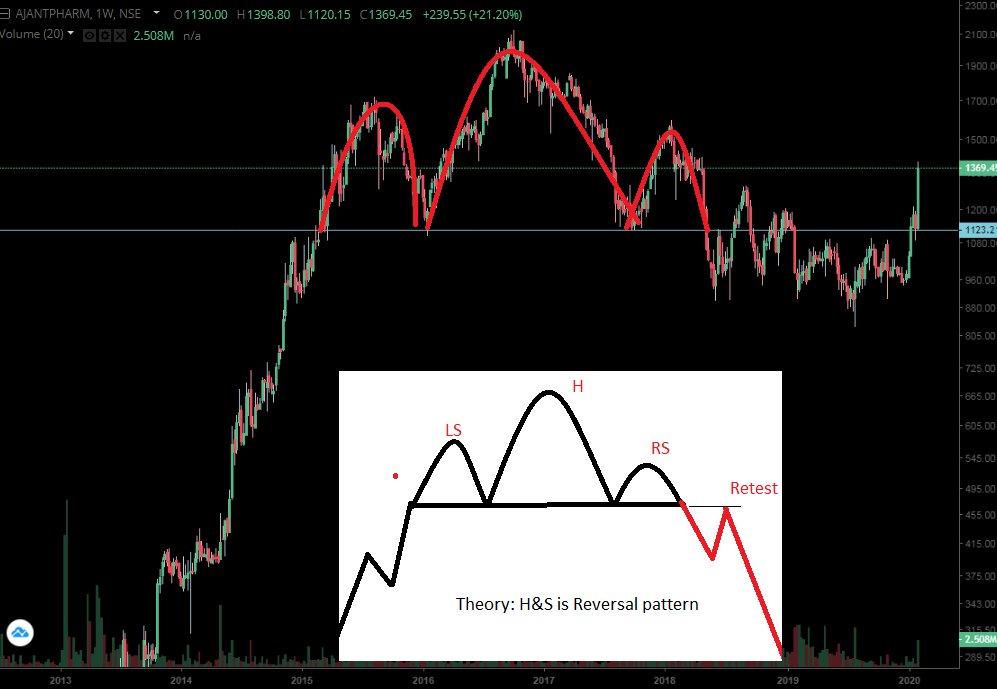
3. B)
- In 2018, MANY analysts/ traders had seen this H&S pattern for Ajantapharma Weekly....... There were floods of SELL calls.
Here is how it has behaved.
Conventional Theory is and will be always challenged in markets #trading #investing
- In 2018, MANY analysts/ traders had seen this H&S pattern for Ajantapharma Weekly....... There were floods of SELL calls.
Here is how it has behaved.
Conventional Theory is and will be always challenged in markets #trading #investing
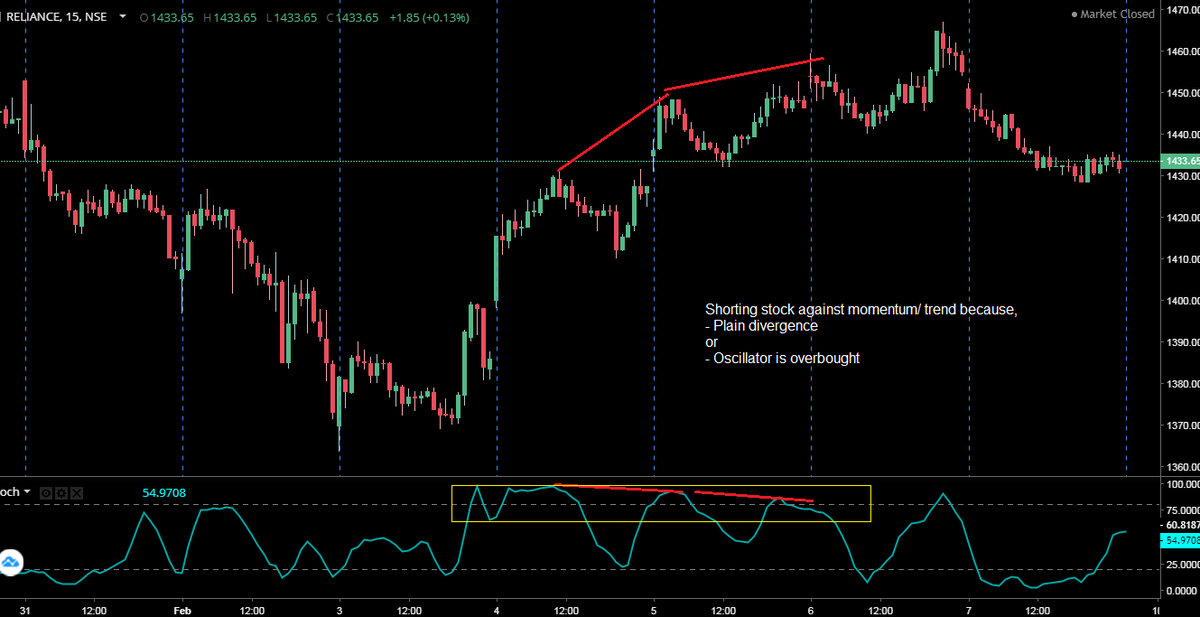
3. C)
- Oscillators are often used wrongly by new traders.
Divergence or OB are not just reasons to Short. Should hv confluence(Data/ HTF)
Note:
- I rarely use oscillators (Any price derived indicators) these years.
- For me, indicators should provide info what Price doesn& #39;t.
- Oscillators are often used wrongly by new traders.
Divergence or OB are not just reasons to Short. Should hv confluence(Data/ HTF)
Note:
- I rarely use oscillators (Any price derived indicators) these years.
- For me, indicators should provide info what Price doesn& #39;t.
Q: More often traders (new/ experienced) say, price took my StopLoss & then went into direction. I am mostly RIGHT in my analysis, still I don& #39;t make consistent money; operators/ Algos hunt my SL.
A: I shall answer this conundrum (with today& #39;s intraday examples to back it up)
A: I shall answer this conundrum (with today& #39;s intraday examples to back it up)
- Firstly, crux of the issue is...... Stops in most of such cases are hit because, retail traders (primitive Algos too) place Stops in same area.
- Thus, when there are too many Pending orders in small cluster, it become easy to take them out and move price.
- Thus, when there are too many Pending orders in small cluster, it become easy to take them out and move price.
Let us understand further...
- Typical Technical Analysis books recommend placing Stops beyond Swing High- Low/ Prior day High-Low/ around S-R
- n Traders follow it diligently....
- Typical Technical Analysis books recommend placing Stops beyond Swing High- Low/ Prior day High-Low/ around S-R
- n Traders follow it diligently....
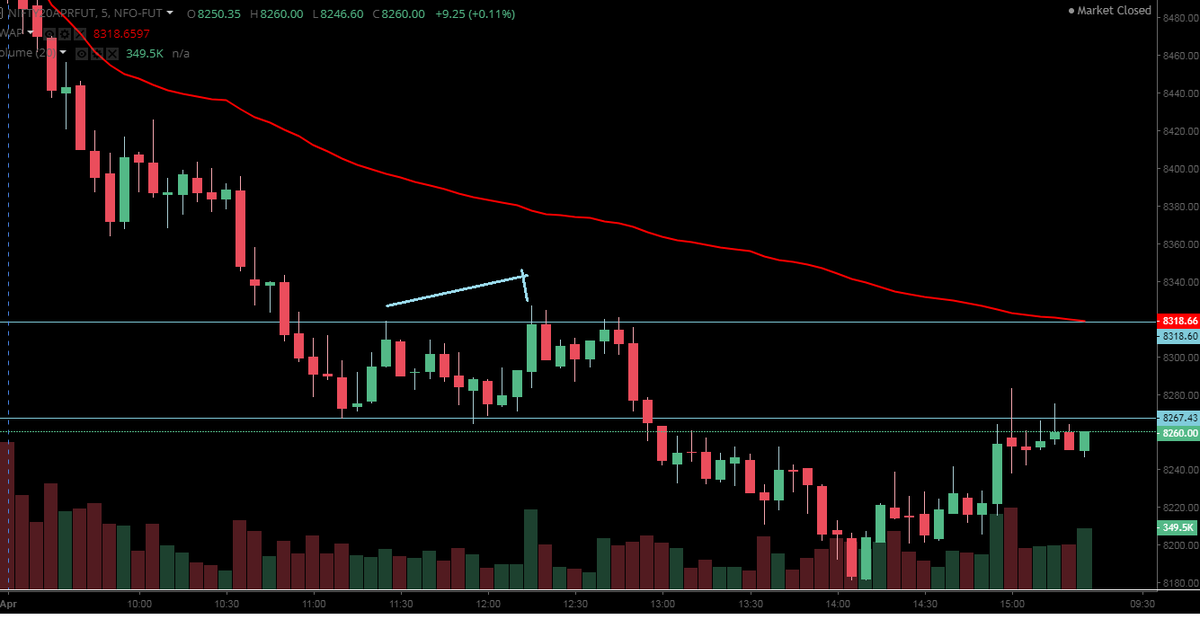
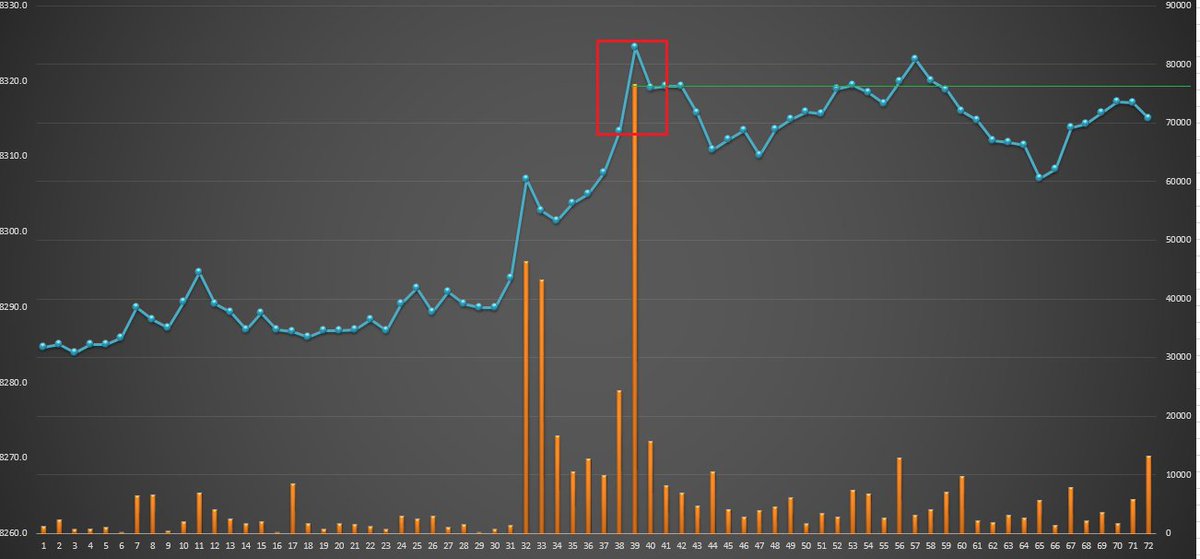
Ex. 1) Today, around 12.17pm, NF rose abv 8300+ pr swing High; that proved to be High for & #39;rest of session& #39;.
How did this happen?
Check img.
- Eager Bulls kept BreakOut SL Buy orders above Swing High & round no. 8300
- Weak Bears kept Stoploss for Shorts in same area
How did this happen?
Check img.
- Eager Bulls kept BreakOut SL Buy orders above Swing High & round no. 8300
- Weak Bears kept Stoploss for Shorts in same area
Now let us get into details.
- Check below img. Betn 8315-8325 , Volume was 77k+ i.e ter were more than 1000 NF Lots.
- In 10 seconds after 12.17.16 pm, volume was 1.1Lac+ i.e >1550 NF lots.
- These all orders were clustered in small 10-15 point area (that too AGAINST TREND)
- Check below img. Betn 8315-8325 , Volume was 77k+ i.e ter were more than 1000 NF Lots.
- In 10 seconds after 12.17.16 pm, volume was 1.1Lac+ i.e >1550 NF lots.
- These all orders were clustered in small 10-15 point area (that too AGAINST TREND)
- A car needs fuel to run. It needs large qty of fuel to go LONG distance; same way trend needs orders from opposite side.
- in above case, Due to such huge volumes, (car got large qty fuel), strong Sellers ensured NF never saw this level and dropped 140+ pts in <2hrs
- in above case, Due to such huge volumes, (car got large qty fuel), strong Sellers ensured NF never saw this level and dropped 140+ pts in <2hrs
Thus, mistake is not of Algos/ SL hunters/ Rahu- Ketu...... it is of traders who follow theory blindly and apply it wrongly. We need to understand, if we know logical places to keep SL are beyond key levels/ swings, then smart people/ operators know that too.
After #Nifty gaped down >4%, did you catch LONG side trades yesterday?
At least on Twitter, it seemed half of #traders caught direction right and minted big way.
Anyway, in below thread, I am sharing insights into my techniques to have bias for such days.
At least on Twitter, it seemed half of #traders caught direction right and minted big way.
Anyway, in below thread, I am sharing insights into my techniques to have bias for such days.
Q: How to avoid getting caught on wrong side, post big gap up/ down?
>
I use Market Internals (including KMI) for this purpose. They give excellent insights into whether price likely to fill the gap or trend in direction of gap or might just consolidate.....
>
I use Market Internals (including KMI) for this purpose. They give excellent insights into whether price likely to fill the gap or trend in direction of gap or might just consolidate.....
Market Internals.....
Market Internals for #Nifty are 50 stocks NS is comprised of.
Key Market Internals (KMI): Top 10 stocks which have ~60% weightage.
#Reliance #Infy #TCS #HDFC #hdfcbank https://abs.twimg.com/hashflags... draggable="false" alt=""> #ICICIBank #KOTAKBANK #Bhartiartl #HUL #ITC
I analyse their price action/ behavior.
Market Internals for #Nifty are 50 stocks NS is comprised of.
Key Market Internals (KMI): Top 10 stocks which have ~60% weightage.
#Reliance #Infy #TCS #HDFC #hdfcbank
I analyse their price action/ behavior.
Problem statements:
- Post big GapDown, traders panic/ Short at Open/ Cover overnight Bullish trades; opposite actions in case of GapUp
- Their reaction is driven by emotions rather than analysis
- Thus, often they end up Selling at bottom/ Buying at top/ Book profits too early
- Post big GapDown, traders panic/ Short at Open/ Cover overnight Bullish trades; opposite actions in case of GapUp
- Their reaction is driven by emotions rather than analysis
- Thus, often they end up Selling at bottom/ Buying at top/ Book profits too early
Solution:
If we look at how Market Internals performing, these traps can be avoided.
I check...
1) How are MIs trading wrt Open?
2) Are they looking to fill GAPs?
3) Finally, are they making new High/ Low on small timeframe?
I shall elaborate thru examples from last 1 month...
If we look at how Market Internals performing, these traps can be avoided.
I check...
1) How are MIs trading wrt Open?
2) Are they looking to fill GAPs?
3) Finally, are they making new High/ Low on small timeframe?
I shall elaborate thru examples from last 1 month...
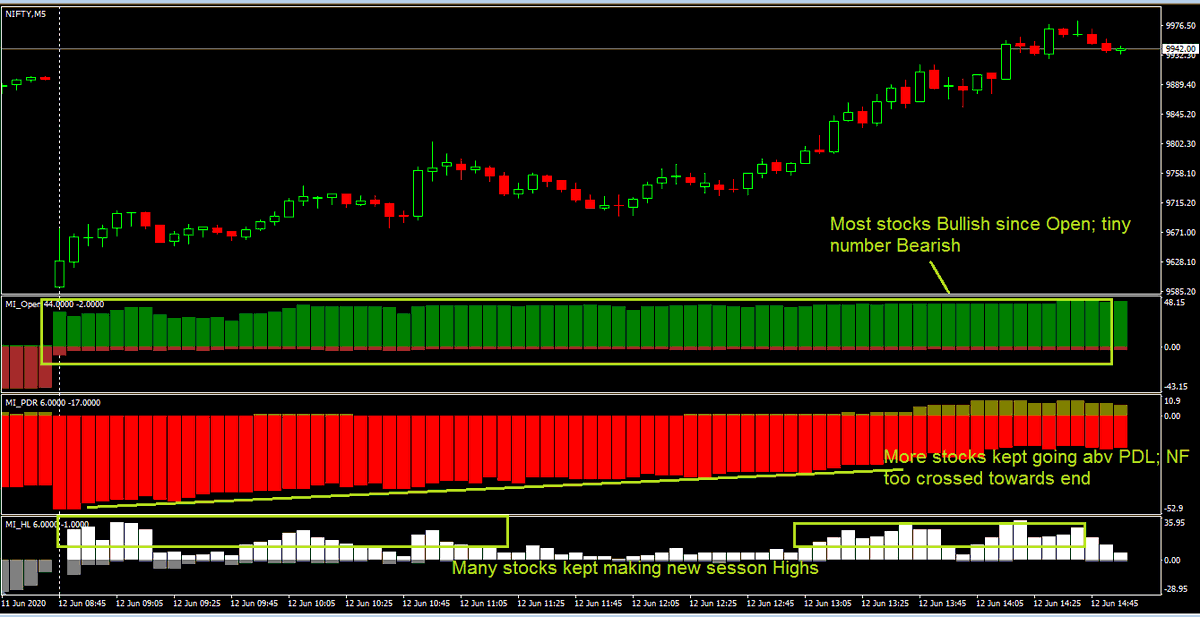
1. 12Jun (Nf gaped down >300 pts)
1) Most MI-all KMIs Bullish since Open
2) All 50 gaped below PDL; No. of stocks getting abv PDL rose thruout
3) Most MI were making new Highs, hardly any making new Low
--> Avoid Shorts, aggressive traders can look for Long setups
1) Most MI-all KMIs Bullish since Open
2) All 50 gaped below PDL; No. of stocks getting abv PDL rose thruout
3) Most MI were making new Highs, hardly any making new Low
--> Avoid Shorts, aggressive traders can look for Long setups
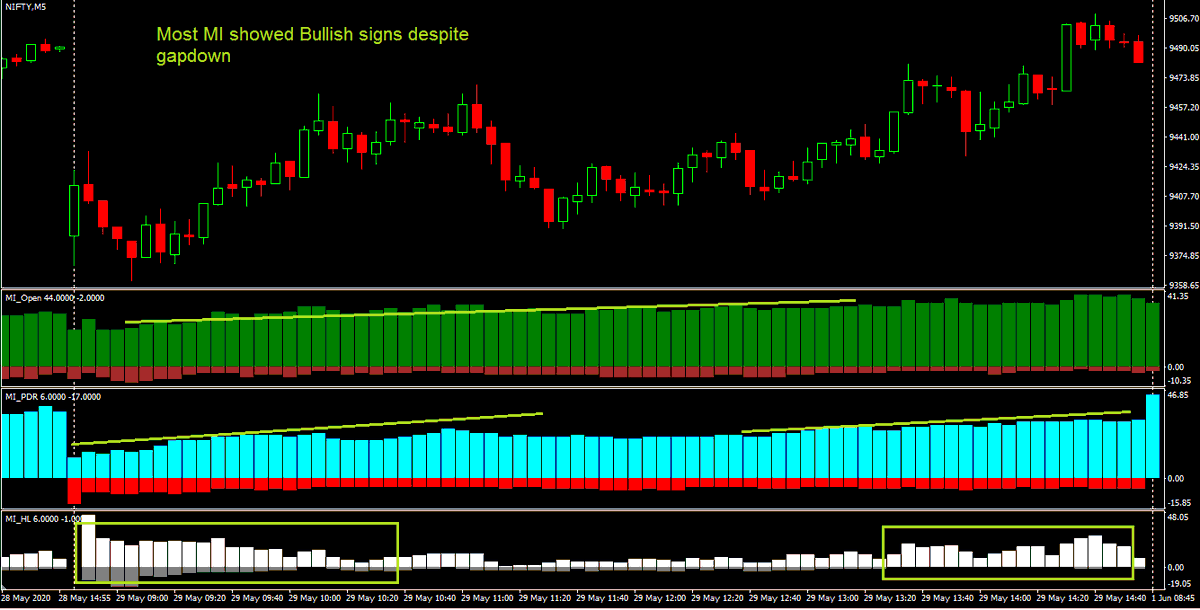
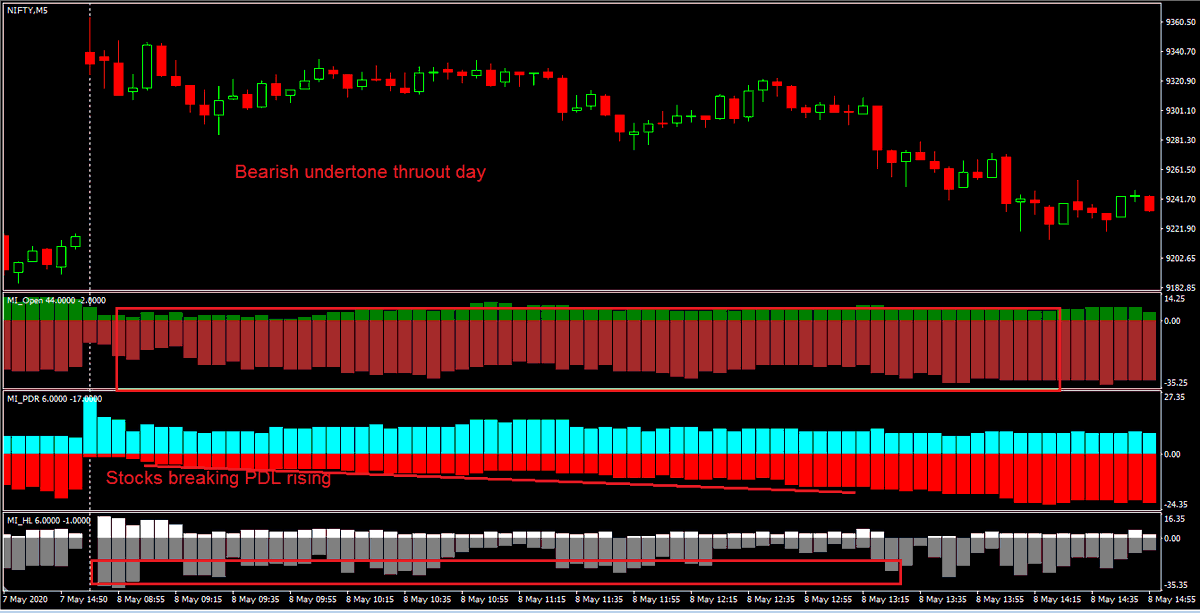
PFA chart (I added my proprietary indicators, for understanding)
1st window: Green- No. of NF stocks with Bullish PA from Open vs Brown- Bearish
2nd: No. of NF stocks abv PDH vs Red- Stocks below PDL
3rd: White- NF stocks around new session Highs vs Gray- around new Lows
1st window: Green- No. of NF stocks with Bullish PA from Open vs Brown- Bearish
2nd: No. of NF stocks abv PDH vs Red- Stocks below PDL
3rd: White- NF stocks around new session Highs vs Gray- around new Lows
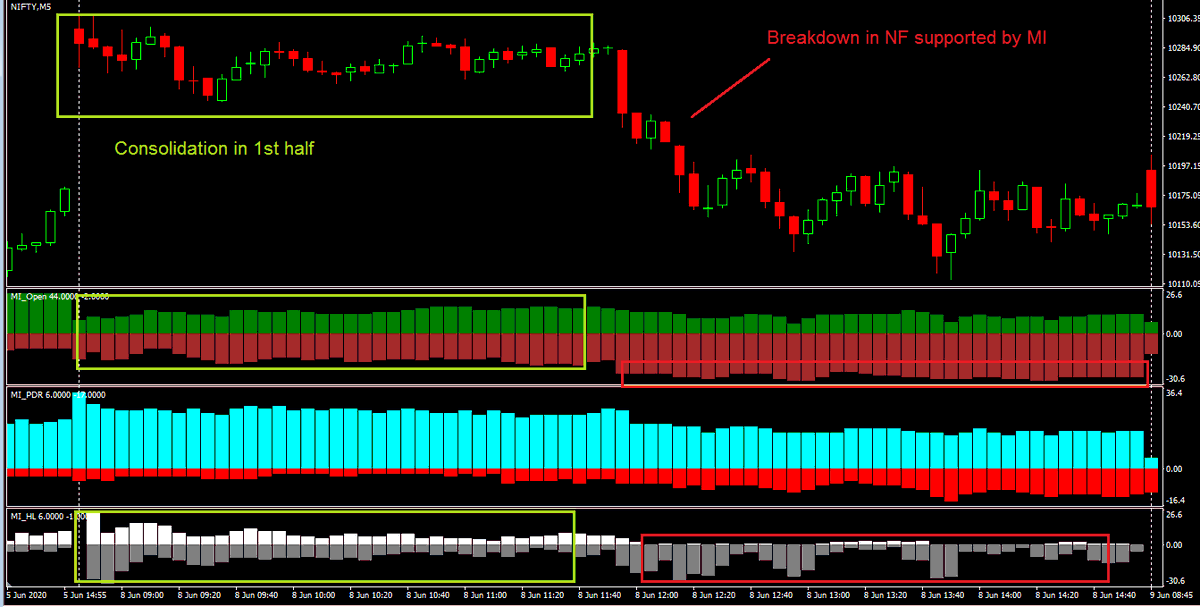
2. 8Jun (Nf gaped Up >120 pts)
- MI Parameters were indecisive in 1st half; NF in range. Thus, await BO/ BD
- In 2nd half, NF broke below session Low and MI supported. Many stocks made new session Lows then. --> Go with Down Momentum
--> Post consolidation, Shorts for Gap Fill
- MI Parameters were indecisive in 1st half; NF in range. Thus, await BO/ BD
- In 2nd half, NF broke below session Low and MI supported. Many stocks made new session Lows then. --> Go with Down Momentum
--> Post consolidation, Shorts for Gap Fill
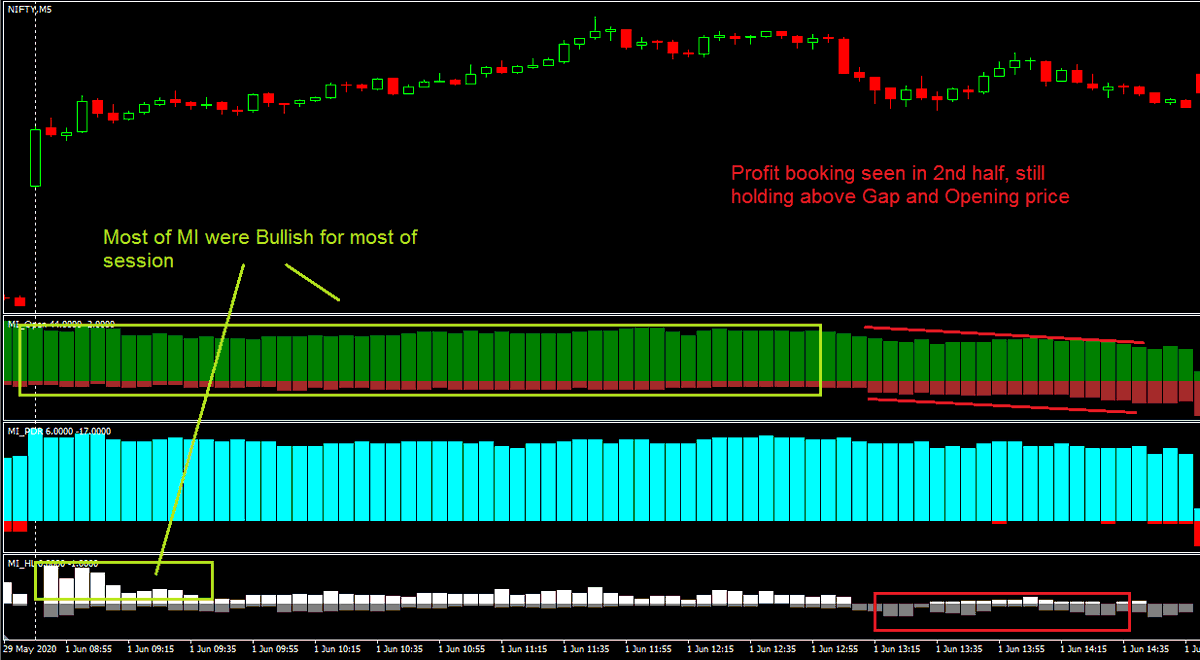
1. 1Jun (Nf gaped Up >140 pts)
1) Most MI-all KMIs Bullish since Open
2) Most stocks had gapped above PDH; they maintained above PDH mostly
3) Initially, most MI made new Highs despite gapU
--> Gap Continuation, look for Longs
1) Most MI-all KMIs Bullish since Open
2) Most stocks had gapped above PDH; they maintained above PDH mostly
3) Initially, most MI made new Highs despite gapU
--> Gap Continuation, look for Longs
4. 29May (Nf gaped down 100 pts)
1) Most MI Bullish since Open
2) Stocks going above PDH kept rising thruout day
3) Most MI made new Highs and hardly and new Lows
--> Gap fill likely, look for Longs setups
1) Most MI Bullish since Open
2) Stocks going above PDH kept rising thruout day
3) Most MI made new Highs and hardly and new Lows
--> Gap fill likely, look for Longs setups
5. 8May (Nf gaped up >170 pts)
1) Most MI Bearish since Open
2) Stocks going below PDL kept rising thruout day
3) Most MI made new Lows and small number made new Highs
--> Gap fill likely, look for Short setups
1) Most MI Bearish since Open
2) Stocks going below PDL kept rising thruout day
3) Most MI made new Lows and small number made new Highs
--> Gap fill likely, look for Short setups
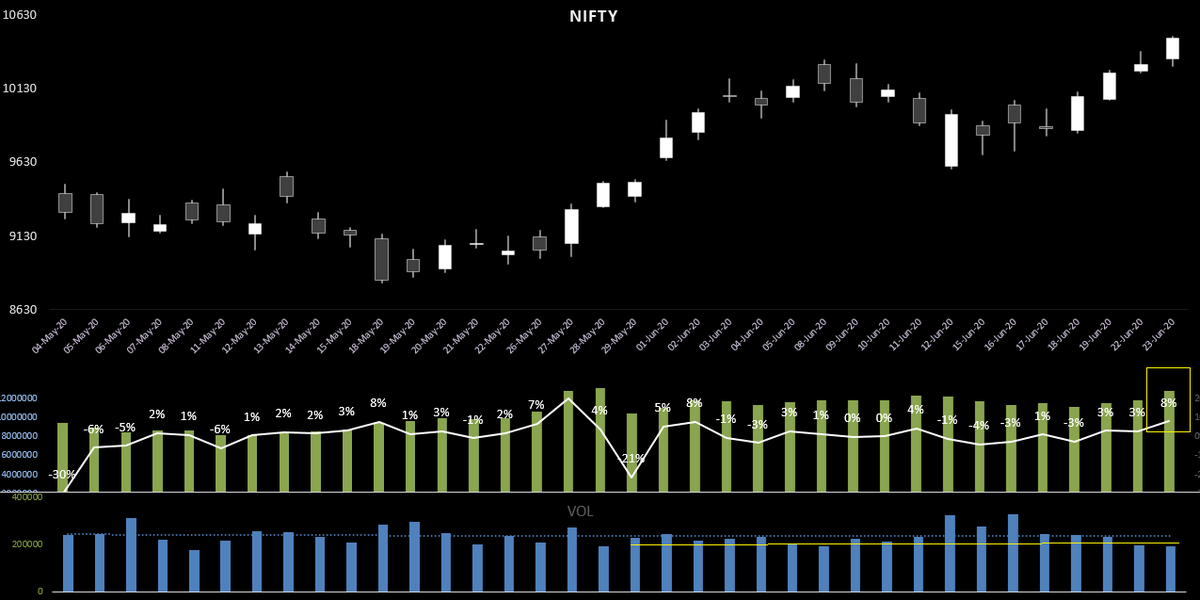
Q: Why I do not refer to current series Volumes in last week of expiry?
> Volumes are deceiving during that time....For reasons like, participants unwind their positions/ Rollovers occur/ New positions are created in next series
Thus, COI is better alternative
& #39;Learning_Mkts& #39;
> Volumes are deceiving during that time....For reasons like, participants unwind their positions/ Rollovers occur/ New positions are created in next series
Thus, COI is better alternative
& #39;Learning_Mkts& #39;
Today& #39;s #Nifty is good example for this scenario...
- If I look at only Jun F volumes, volumes are below average, when NF rose 1.5%. This gives false impression that, rise was on poor volumes
- But, COI rose 8% over yesterday. -> Most Bullish volumes got added in July series.
- If I look at only Jun F volumes, volumes are below average, when NF rose 1.5%. This gives false impression that, rise was on poor volumes
- But, COI rose 8% over yesterday. -> Most Bullish volumes got added in July series.
Generally traders know importance of VWAP in markets.....
For me, hierarchy is....
Intraday VWAP < Trend Day (or Event day wh good volumes) VWAP < Series VWAP (or AVWAP)
For me, hierarchy is....
Intraday VWAP < Trend Day (or Event day wh good volumes) VWAP < Series VWAP (or AVWAP)

 Read on Twitter