1,
Listen up, this is how market structure works within a market cycle. Since I have been trading BTC this has constantly happened every few months. These cycles were happening every month and has slowly been drawn out to every few months(I& #39;d assume because of liquidity increase)
Listen up, this is how market structure works within a market cycle. Since I have been trading BTC this has constantly happened every few months. These cycles were happening every month and has slowly been drawn out to every few months(I& #39;d assume because of liquidity increase)
2,
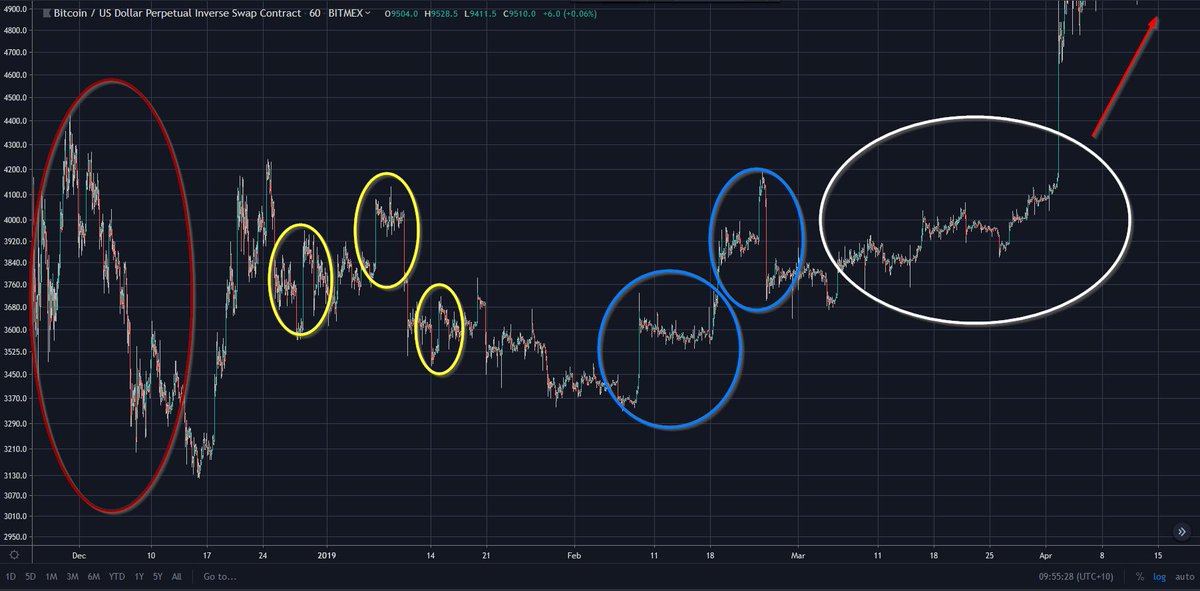
Red Circle.
A major support or resistance was just broken and we get large erratic moves. Keep in mind everyone that is holding a position and that level has been broken is now holding an offside position. They are now very vulnerable and need to take action on their posi
Red Circle.
A major support or resistance was just broken and we get large erratic moves. Keep in mind everyone that is holding a position and that level has been broken is now holding an offside position. They are now very vulnerable and need to take action on their posi
3,
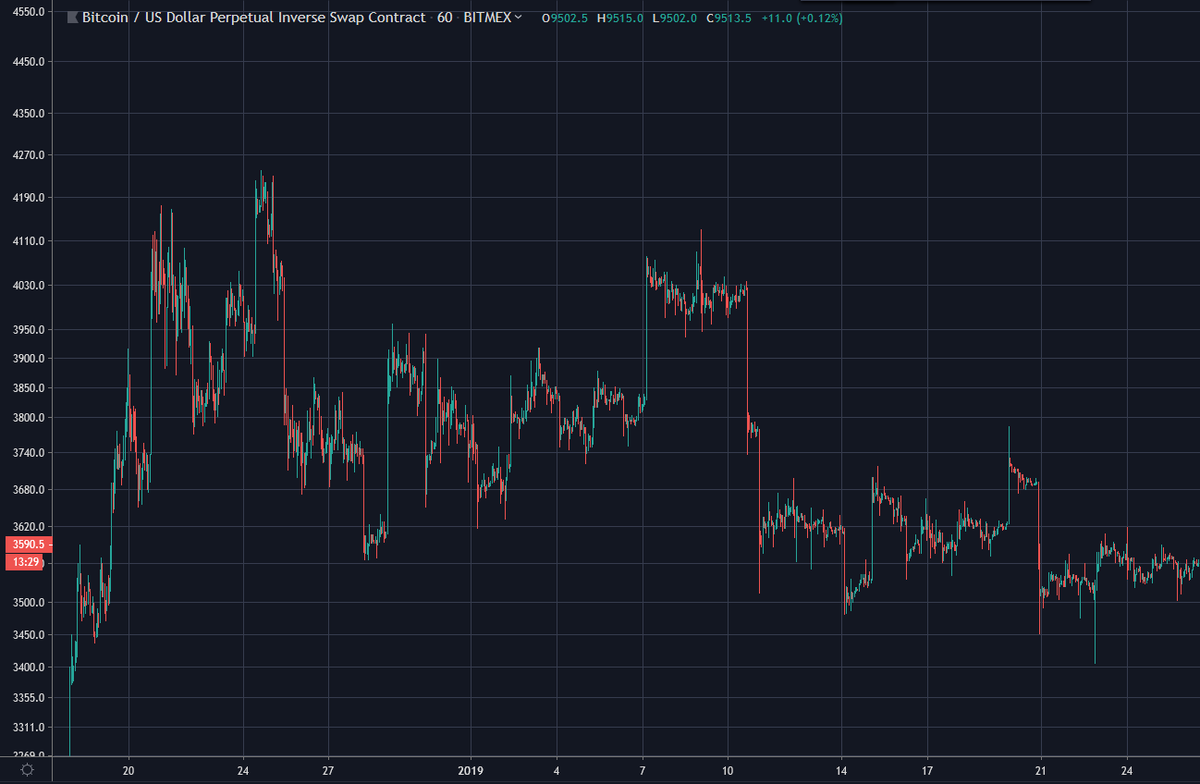
Yellow Circles,
Price has started to settle down and a equilibrium/fair price point is now found. We start to get large accumulation on both sides as HTF traders re-enter. new entrants,accumulation and stable prices cause stop runs, hence bart simpson patterns start occurring
Yellow Circles,
Price has started to settle down and a equilibrium/fair price point is now found. We start to get large accumulation on both sides as HTF traders re-enter. new entrants,accumulation and stable prices cause stop runs, hence bart simpson patterns start occurring
4,
Blue Circles,
The excitement of new prices has now disappeared. price accumulation takes longer with both sides getting thicker as MMers come back in masses. Although these moves are generally larger than the bart simpson moves, it takes longer for them to occur.
Blue Circles,
The excitement of new prices has now disappeared. price accumulation takes longer with both sides getting thicker as MMers come back in masses. Although these moves are generally larger than the bart simpson moves, it takes longer for them to occur.
5,
White Circle
This is the area where the real battle between bulls and bears occur. Tight ranges with rapidly increasing open interest. darth mauls are common to wipe OI then continue on it& #39;s way towards major S/R. Once one side is cracked expect massive volatility.
White Circle
This is the area where the real battle between bulls and bears occur. Tight ranges with rapidly increasing open interest. darth mauls are common to wipe OI then continue on it& #39;s way towards major S/R. Once one side is cracked expect massive volatility.

 Read on Twitter


