In light of yesterday& #39;s Mueller testimony, let& #39;s reflect on American Democracy.
More specifically, how democratic is the US? "City on the Hill" or "Overinflated Sense of Self"?
Ultimately, this is a question about measurement
[THREAD]
More specifically, how democratic is the US? "City on the Hill" or "Overinflated Sense of Self"?
Ultimately, this is a question about measurement
[THREAD]
To be clear, measuring democracy is HARD. @SevaUT, in this @monkeycageblog piece from 2015, reflected on the difficulties of measuring democracy in the Former Soviet Republics https://www.washingtonpost.com/news/monkey-cage/wp/2015/06/23/how-do-you-measure-democracy/?utm_term=.8fbff038ded8">https://www.washingtonpost.com/news/monk...
@sarahsunnbush in @Journal_of_GSS offers an updated take on the issue https://academic.oup.com/jogss/article-abstract/4/3/372/5533395?redirectedFrom=fulltext">https://academic.oup.com/jogss/art...
She focuses on two common datasets
- Freedom in the World Index from @freedomhouse
- Polity from the Polity Project
https://www.systemicpeace.org/polityproject.html">https://www.systemicpeace.org/politypro...
- Freedom in the World Index from @freedomhouse
- Polity from the Polity Project
https://www.systemicpeace.org/polityproject.html">https://www.systemicpeace.org/politypro...
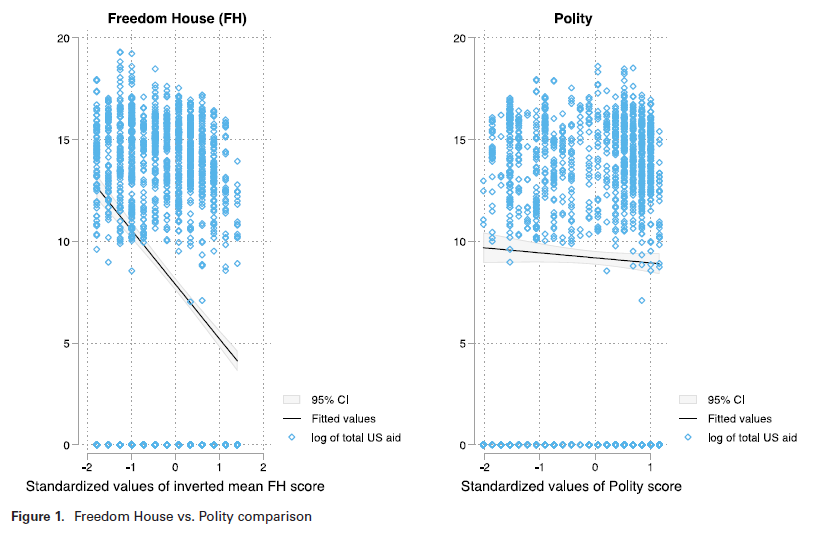
Looking specifically at the research on how external democracy aid influences democracy levels, she shows that the relationship completely depends on the chosen measure of democracy.
This is partially because they are measuring slightly different conceptions of democracy:
- @freedomhouse accounts more directly for personal and civil rights.
- polity focuses more on institutional features
The dataset chosen depends on the goal of the analyst.
- @freedomhouse accounts more directly for personal and civil rights.
- polity focuses more on institutional features
The dataset chosen depends on the goal of the analyst.
But I found one point by @sarahsunnbush to be particularly revelatory: that the coding, regardless of the coding rule, is not consistently applied -- US allies tend to receive better scores.
When making that point, she cites this nifty piece by @NilsSteiner https://www.tandfonline.com/doi/abs/10.1080/13876988.2013.877676">https://www.tandfonline.com/doi/abs/1...
@JeffDColgan in the same issue of @Journal_of_GSS takes this comment a step further, showing that coder bias can lead to unequal treatment of countries or unequal coding of countries at different times. https://academic.oup.com/jogss/article-abstract/4/3/358/5533399?redirectedFrom=fulltext">https://academic.oup.com/jogss/art...
One of the datasets he explores is Polity (notice a trend?)
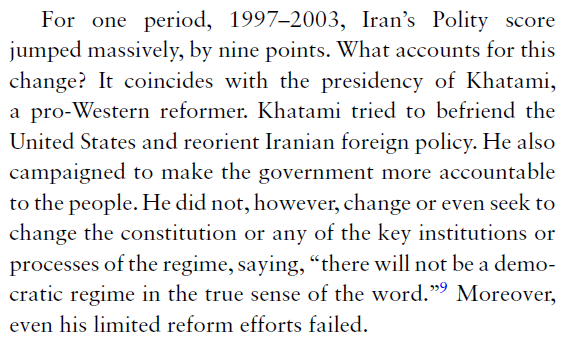
This passage is VERY telling (and perhaps damning):
This passage is VERY telling (and perhaps damning):
So what does this all mean for how we measure American democracy?
We& #39;ve had a related discussion before on Twitter, thanks to @KSchultz3580 https://twitter.com/KSchultz3580/status/1105911723649724416">https://twitter.com/KSchultz3...
We& #39;ve had a related discussion before on Twitter, thanks to @KSchultz3580 https://twitter.com/KSchultz3580/status/1105911723649724416">https://twitter.com/KSchultz3...
@KSchultz3580 showed the long term score as well https://twitter.com/KSchultz3580/status/1105916491277336576">https://twitter.com/KSchultz3...
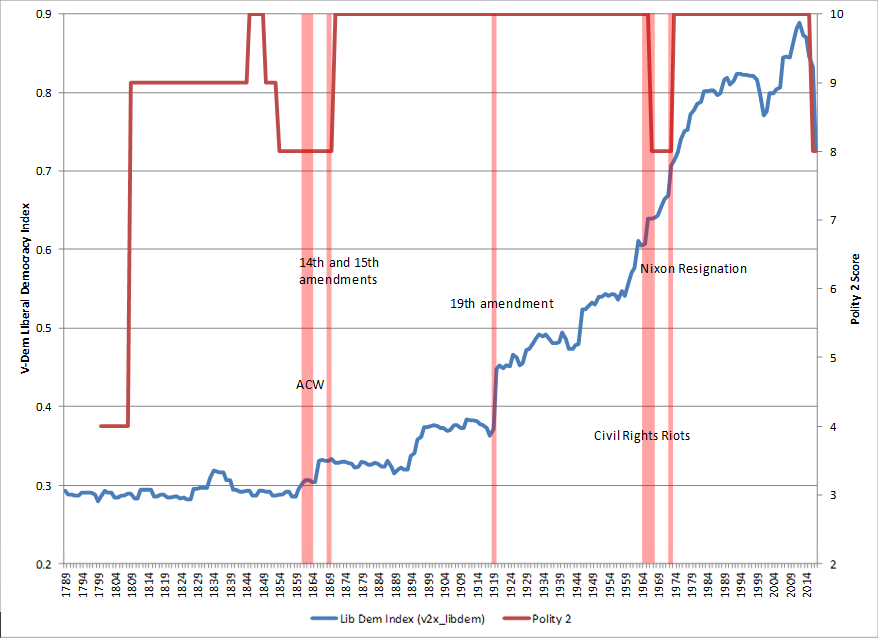
Seeing these charts, folks noticed the almost immediate decline in the US score in 2016. It went form a 10 (highest Polity score) to an 8.
Huh. A few things to note about that...
Huh. A few things to note about that...
1) A key component in the Polity coding is "Executive Constraints". You can see this by looking at the weights in the codebook
Well, given the # of times that Trump has had policies struck down or modified by courts, or had the Congress fail to pass a bill, or had governors refuse to carry out a policy, or had investigations...
...well, seems pretty constrained.
...well, seems pretty constrained.
Sure, Trump has turned to Executive Orders, but so did his predecessors.
After all, the phrase "Imperial Presidency" has been around for quite some time #v=onepage&q&f=false">https://books.google.com/books?id=zbLO9aNL6ncC&printsec=frontcover&source=gbs_ge_summary_r&cad=0 #v=onepage&q&f=false">https://books.google.com/books...
After all, the phrase "Imperial Presidency" has been around for quite some time #v=onepage&q&f=false">https://books.google.com/books?id=zbLO9aNL6ncC&printsec=frontcover&source=gbs_ge_summary_r&cad=0 #v=onepage&q&f=false">https://books.google.com/books...
Of course, the change in coding might be due to changes in political participation or even polarization. Indeed, the US coding sheet states the following
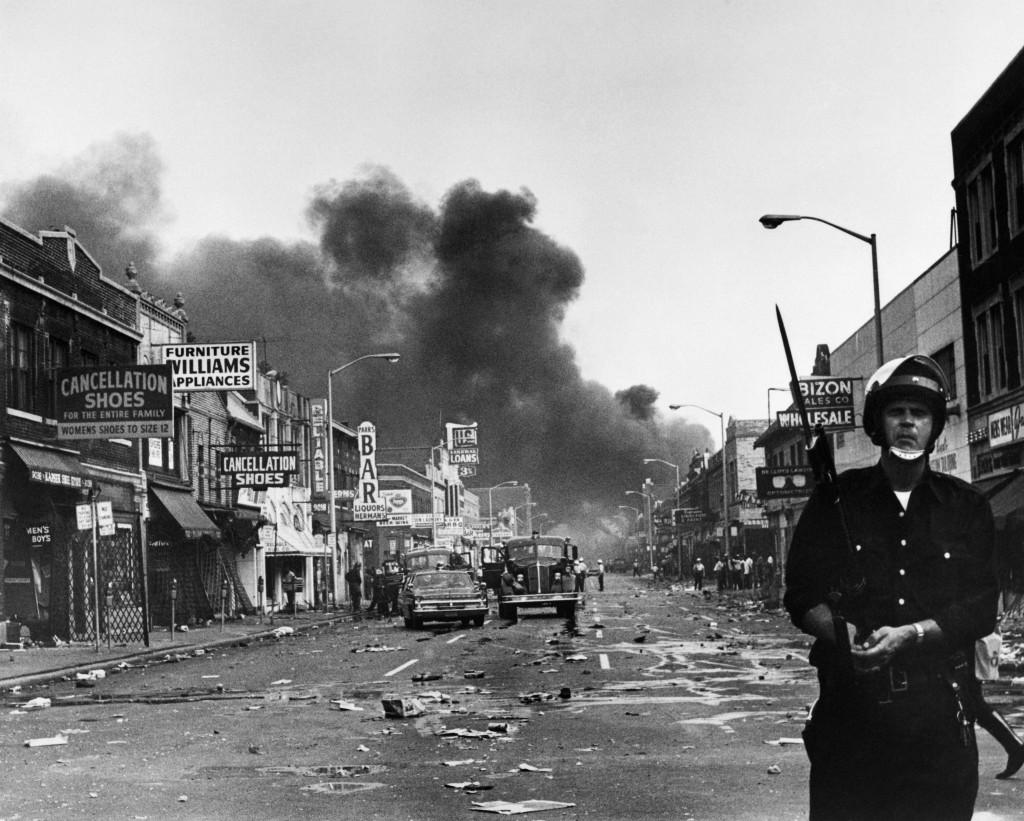
3) The long term Polity scores indicate that the US is now LESS democratic than in the 1840s. When students see this graph, they are always like "wait, didn& #39;t we have, like, slavery back in the 1850s? And, you know, women couldn& #39;t vote? Is NOW really less democratic?"
So why the drop in 2016?
One possibility is "Trump Derangement Syndrome", as described in this @NRO piece https://www.nationalreview.com/2019/07/trump-derangement-syndrome/">https://www.nationalreview.com/2019/07/t...
One possibility is "Trump Derangement Syndrome", as described in this @NRO piece https://www.nationalreview.com/2019/07/trump-derangement-syndrome/">https://www.nationalreview.com/2019/07/t...
In other words, just as the Polity coders increased Iran& #39;s score because they liked Khatami, the Polity coders may have decreased the US score because they dislike Trump.
I mean, he wasn& #39;t yet even in office in 2016
I mean, he wasn& #39;t yet even in office in 2016
Another possibility is that the US score was too high in the past. Indeed, coding from an alternative dataset -- @vdeminstitute -- gave the US substantially lower scores in the past (as shown in the above figure)
So what does this all mean for US democracy?
Calibrating for the bias in the data, US democracy today is probably better than the data say, and US democracy in the past was probably worse than the (Polity) data suggests.
[END]
Calibrating for the bias in the data, US democracy today is probably better than the data say, and US democracy in the past was probably worse than the (Polity) data suggests.
[END]

 Read on Twitter


