My best kept secret* is that string & wiring diagrams--plucked straight out of applied category theory--are *fabulous* for software and system design. And you don& #39;t have to learn a damn thing to start using them.  https://abs.twimg.com/emoji/v2/... draggable="false" alt="🙌" title="Raising hands" aria-label="Emoji: Raising hands">
*will talk to anyone who& #39;ll listen
*will talk to anyone who& #39;ll listen
I& #39;ve been using them as a software design tool for about 2 or 3 years, and they& #39;ve been great as teaching tools too, with junior and senior colleagues alike.
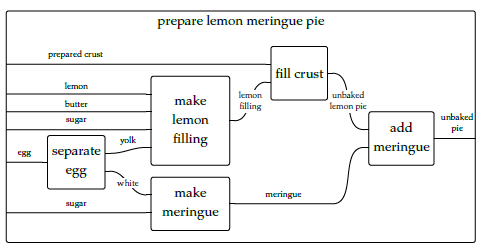
This meringue recipe is a string diagram, from Fong & Spivak& #39;s "Seven Sketches of Compositionality". Notice that the lines are "data" and the boxes are "functionality" -- the opposite of many programmers& #39; instincts, but it& #39;s a really helpful framing.
The wires (ie data) coming in from the left are inputs, the wires to the right are outputs. Each box is also a slot where you can recursively plug in more string diagrams - programs inside programs.
This is great for sketching abstraction layers in a codebase! You don& #39;t want all your components to be visible at once; you want every layer to roughly have the same limited level of complexity, locally understandable.
The discipline also encourages you to think about properties you want preserved when you plug one string diagram in another. Equality? Ordering? Sequencing? If the act of plugging in one string diagram into another preserves them, then it& #39;s guaranteed top to bottom.
The cool thing is that unlike the usual handwavey architectural boxy-liney things we draw, string diagrams are a graphical language that forms precise mathematical statements! It does takes some practice to get this right though.
The underlying concept is a "monoidal category", which lets us compose vertically & horizontally. In category lingo, the lines are "objects", the boxes "morphisms", boxes after boxes "composition" (∘), and wires on top of wires "tensoring" (⨂)
(diagrams by Fong & Spivak)
(diagrams by Fong & Spivak)
A lot of applied category theory involves nailing features onto monoidal categories, which come with beautiful, intuitive string diagrams - crossing or braiding wires, bending wires back into loops, attaching cost or weights to the wires, etc. You can model quite a lot of stuff.
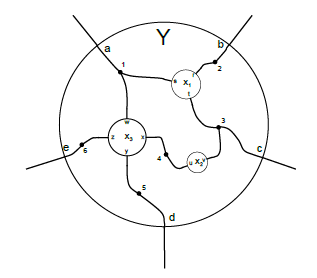
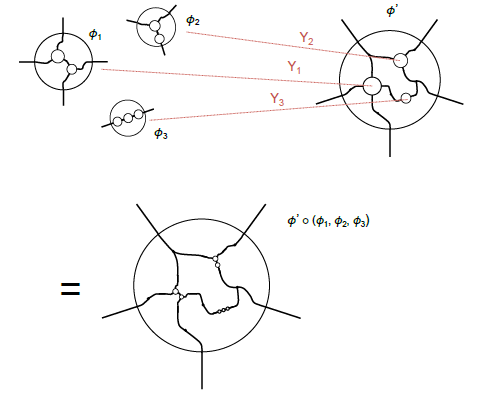
Wiring diagrams are really useful too! It& #39;s another self-similar recursive diagram, this time with little circles inside a big circle, joined by wires. You can plug whole diagrams into the little circles, as long as you hook up all the wires.
(diagrams by David Spivak)
(diagrams by David Spivak)
These are _great_ for designing systems. You can use the holes to represent bounded contexts - say - "Accounting stuff" where you regard the other team& #39;s stuff as a black box with network calls, dependencies or dataflow going in and out at the edge.
I& #39;m never impressed when I see one of those architecture diagrams with a big tangled mess of dozens of boxes and lines - it& #39;s not _necessarily_ because everything is complex, it& #39;s just nobody should ever need to look at everything at once and it& #39;s a bad diagram.
Like string diagrams, the discipline here helps you cut out detail, and preserve principled ignorance between systems-of-systems. It helps you think about properties that are preserved when you compose diagrams - consistency? Deterministic behaviour? SLAs?
The underlying concept is an "operad", which I& #39;ll loosely say describes composable things with an arbitrary number of inputs and one output. Like functions! Or trees! The glue that lets you hook up the wires when you put wiring diagrams inside each other is called a "cospan".
Further reading if you& #39;re interested:
"Seven Sketches of Compositionality" by Brendan Fong & David Spivak. Free online book: https://arxiv.org/abs/1803.05316
"Operad">https://arxiv.org/abs/1803.... of wiring diagrams" by Spivak. It& #39;s got neat CS case studies with plug-and-play systems, DBs, etc https://arxiv.org/abs/1305.0297 ">https://arxiv.org/abs/1305....
Recommended follows for applied category theory:
@johncarlosbaez
@DrEugeniaCheng
@math3ma
@_julesh_
@JadeMasterMath
@johncarlosbaez
@DrEugeniaCheng
@math3ma
@_julesh_
@JadeMasterMath

 Read on Twitter


