I just ran into an interesting performance issue. We're implementing a feature that collects runtime metrics from apps in the background (using EventListener/EventCounters, collection is done in-process). I load-tested it and found a 4.5% overhead, far above what I expected [...]
The setup is 2 Amazon EC2 instances on Linux. One c5.xlarge (4 cores) generating the traffic using wrk, one c5.large (2 cores) hosting an aspnetcore app that is instrumented using our library. Thoughput was ~13.8K requests/second with the new metrics, ~14.5K without
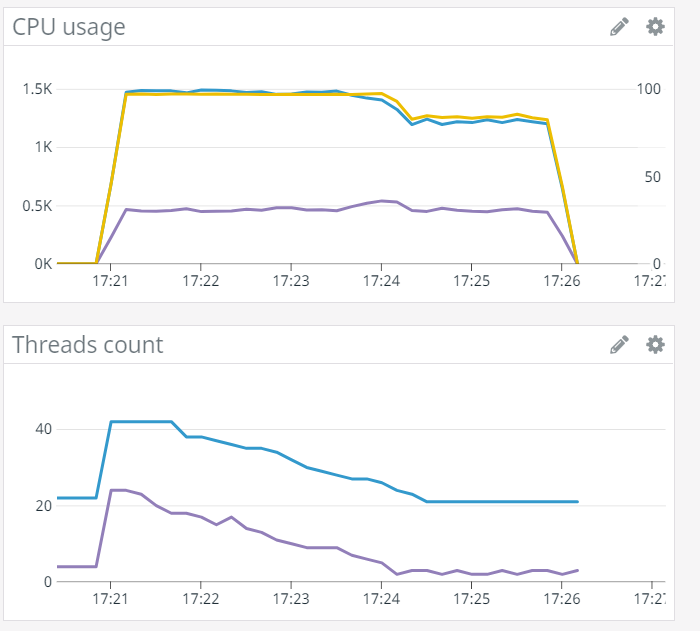
What struck me immediately was the CPU usage, that averaged to 85% when metrics are enabled. At the beginning of each run there could be a 1-2 minutes timeframe where CPU was at 100%, but it would eventually fall down. With metrics disabled, CPU was at 100% all the time
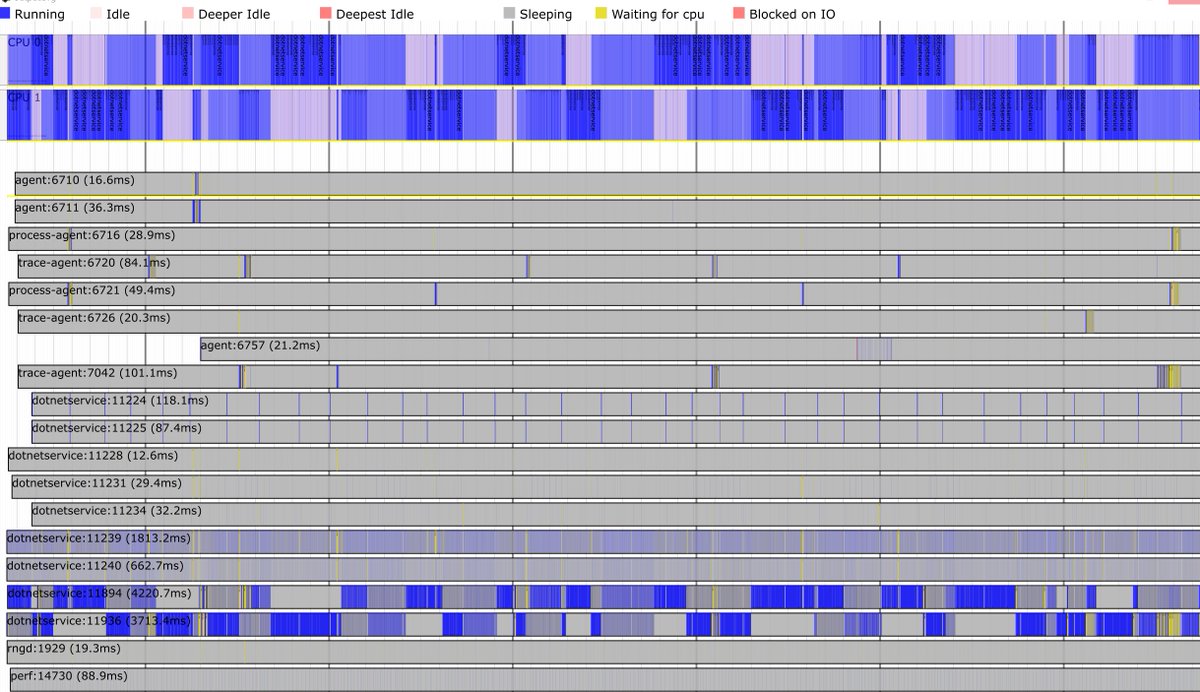
I spent some time looking for a wall-clock profiler on Linux. In the process I discovered perf timechart, which unfortunately produces a 500MB svg file for 5 seconds of profiling, which is completely unusable. That's a shame because the issue is clearly visible in the preview
Eventually I remembered that good old dotTrace now works on Linux. It allowed me to discover that our statsd client uses a threadpool worker to consume a background queue. The thread spends most of its time waiting synchronously for new items. Not ideal but shouldn't be harmful.
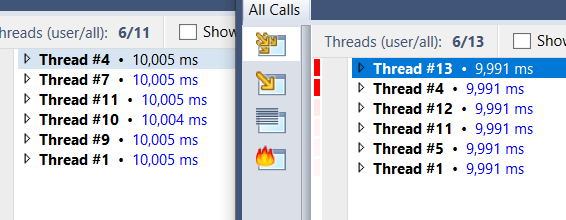
Then I captured another trace with metrics disabled, and something struck me: both traces had the same number of managed threads, even though the one with metrics enabled had the one worker spending 99.9% of the time waiting  (metrics disabled on the left, enabled on the right)
 (metrics disabled on the left, enabled on the right)
For some reason it looks like the threadpool won't grow above 3 threads for this app. When one of those threads was busy waiting, the 2 remaining ones weren't enough to saturate the CPU. To confirm, I changed the consumer to use a dedicated thread, and CPU usage went back to 100%
Going back to the previous runs where CPU was at 100% and fell down to 85%, it looks like the threadpool started with a large number of workers, then progressively scaled down to 3. Past this point, it oscillated between 2 and 3, but never got to 4.
That's a bit of an extreme case, but I'm surprised the threadpool failed to conclude that the app performed better with 4 threads than 3. It's possible to enable events that give the throughput measured by the threadpool, I'll try playing with them: https://docs.microsoft.com/en-us/dotnet/framework/performance/thread-pool-etw-events#threadpoolworkerthreadadjustment

 Read on Twitter


